Scan: Success
A Successful Scan completed every requested check on every targeted container. Anomalies (if any) are recorded; if none were found, the operation reports zero anomalies and every check is shown as passed in the Checks sub-tab.
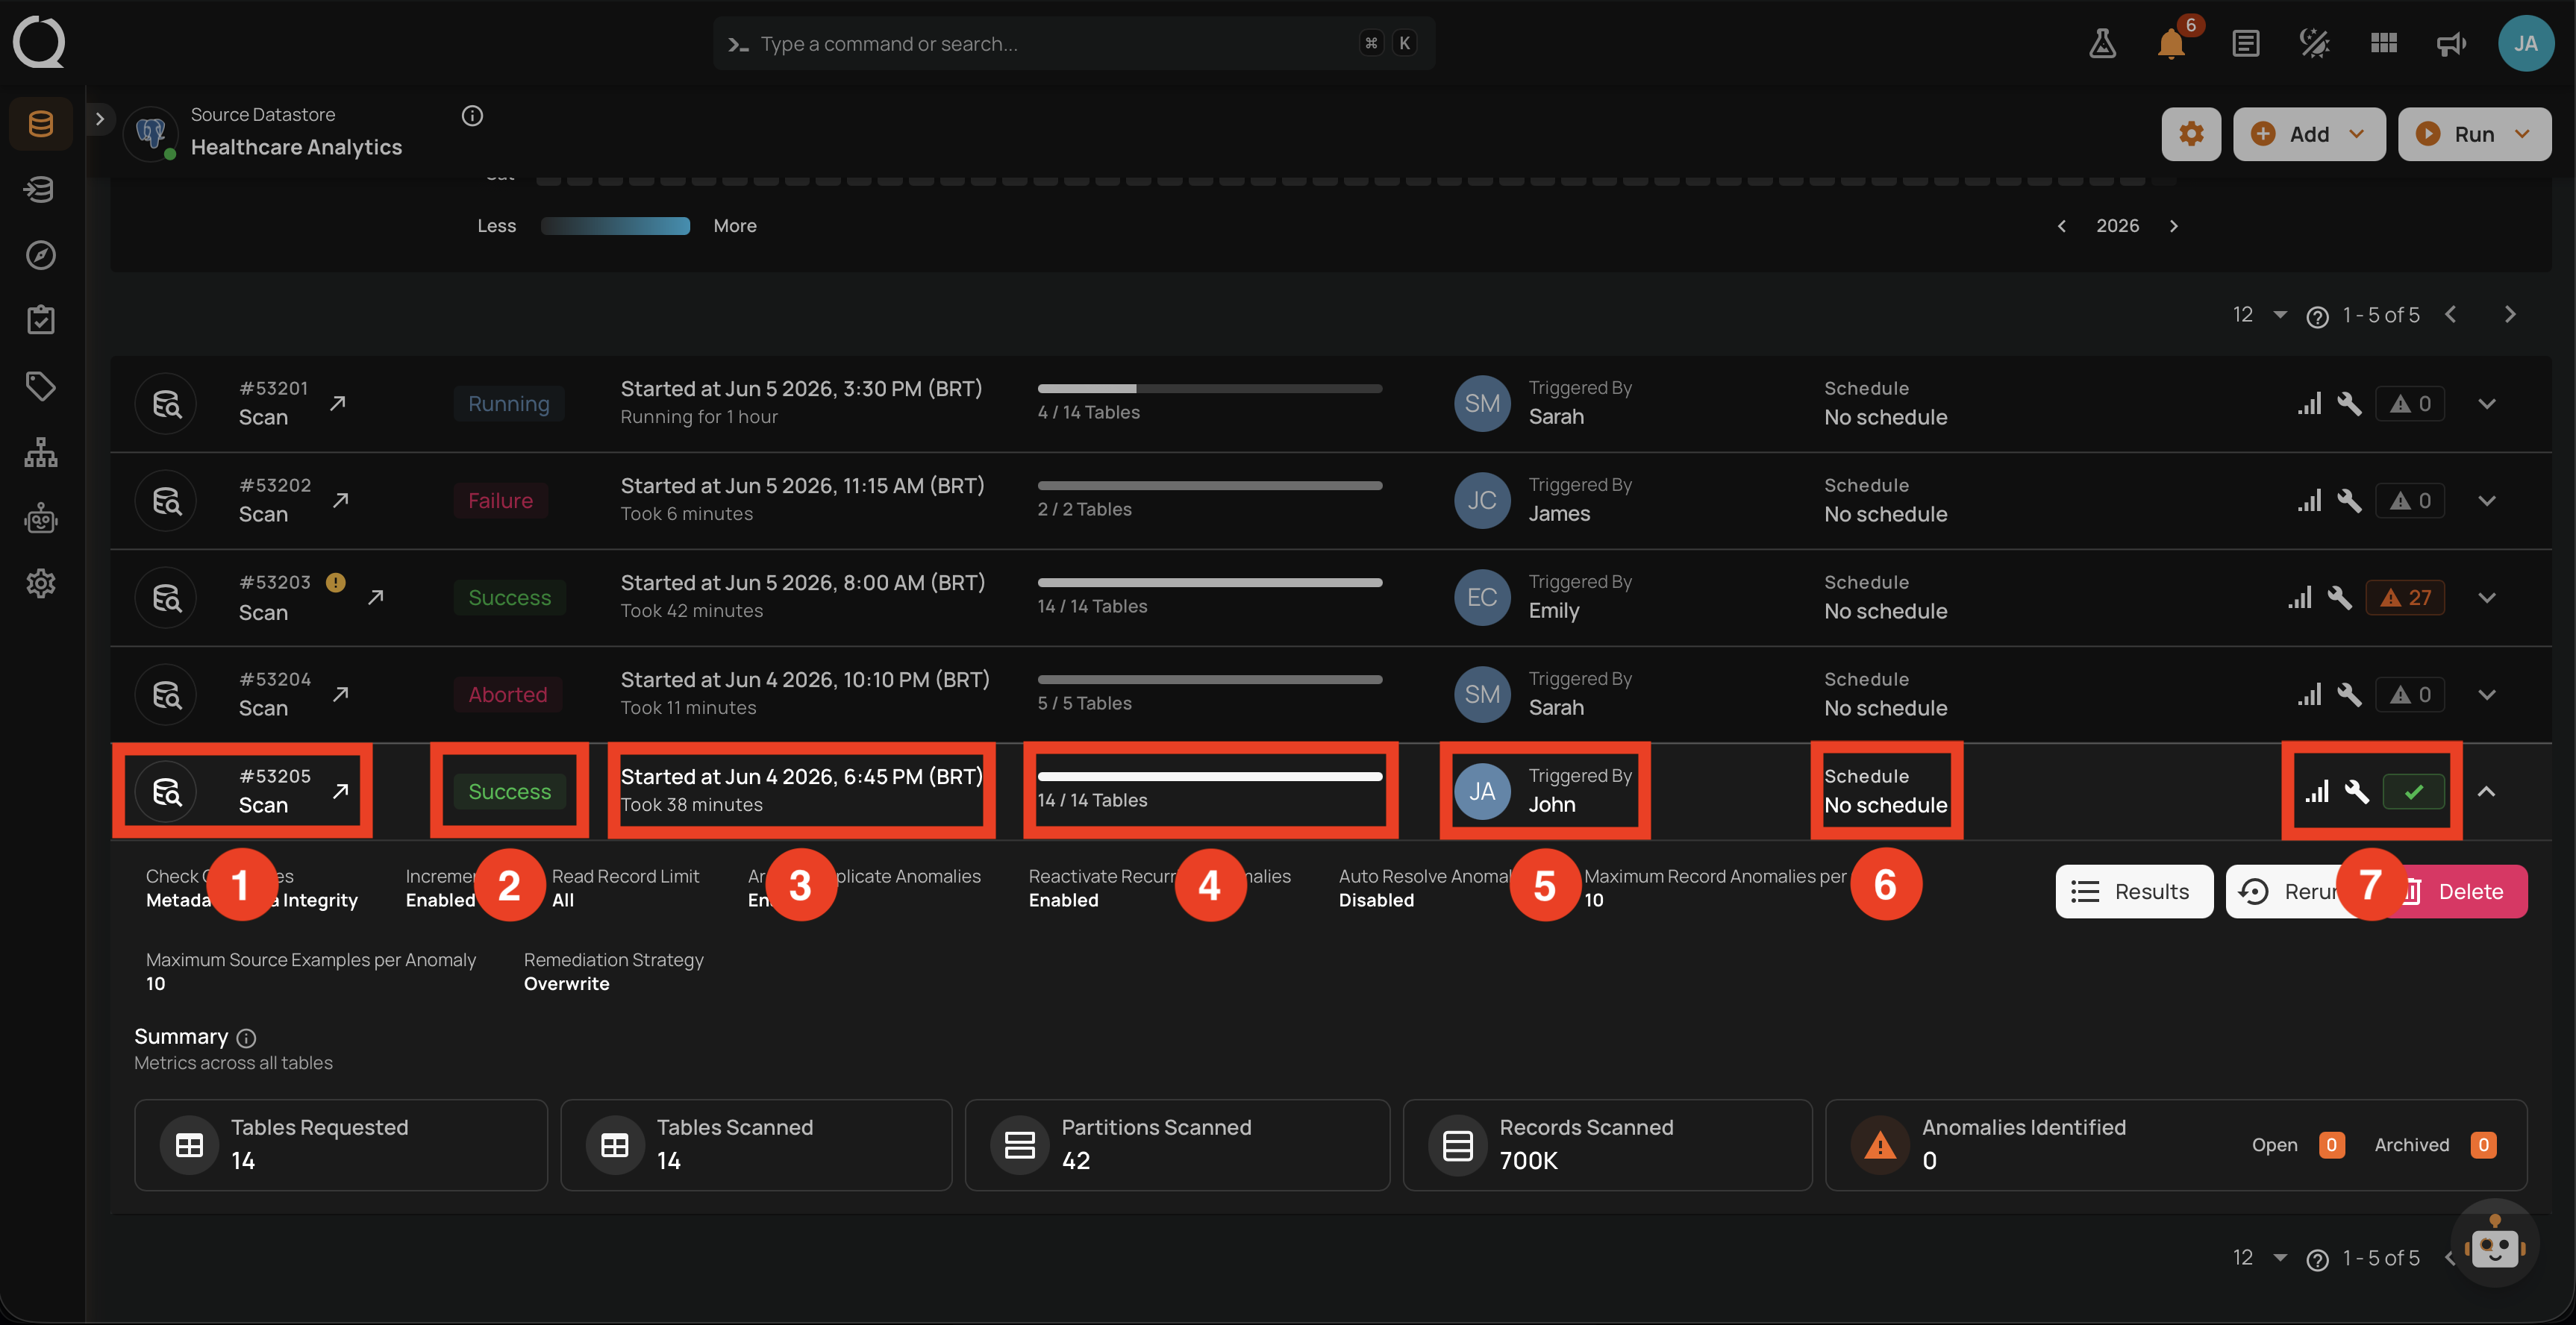
Expanded row in the operations list
From the Activity tab, every operation appears as a row. Expanding a row reveals three parts: the header (identity and status), the details (settings used), and the summary (outcome metrics).
Header of the operation
| No. | Element | What it shows |
|---|---|---|
| 1 | Operation ID and type | The unique identifier (for example #53388) and the operation type (Scan). Next to the ID, the View operation icon () opens the dedicated Overview page (the same page covered in Operation detail page below). |
| 2 | Status badge | The terminal state. For Success it shows the green Success badge. |
| 3 | Time info | The operation's timing: Started At (start timestamp, for example Started at Jun 4 2026, 6:45 PM (BRT)) and Duration (how long it ran, for example Took 38 minutes). |
| 4 | Progress | The number of containers processed against the total requested (for example, 14 / 14 Tables). |
| 5 | Triggered by | The user (avatar and name) who launched the operation, or the schedule that triggered it. |
| 6 | Schedule | The named schedule if the operation was scheduled, otherwise No schedule. |
| 7 | Quick stats icons | A cluster of small status icons on the right of the row. Each icon shows a tooltip on hover summarizing configuration and result counters at a glance. See the Right-side icons (No. 7) in detail breakdown below this table. These are not the row action buttons (Results, Rerun, Delete); those live in the expanded Details section. |
Right-side icons (No. 7) in detail
The scan-row cluster contains the following icons, left to right:
| Icon | Tooltip | Meaning |
|---|---|---|
| Incremental Field | Whether the scan ran in Incremental mode (filled when active) or Full (grey when the scan was Full). | |
| Remediation Strategy | The remediation strategy used for this run (filled when Append or Overwrite is set, grey when None). |
|
| / | Anomalies Identified | Total number of anomalies detected in this scan, with Open and Archived counts in the tooltip. The pill is orange with the count when anomalies were found, green check when zero. |
| Anomalies Auto-Resolved | Number of previously open anomalies (Active or Acknowledged) that this scan automatically resolved. Shown only on Full scans where Auto Resolve was enabled and at least one anomaly was resolved. |
The row header is intended for quick triage: at a glance you can confirm the operation ran to completion, see how long it took, who started it, and decide whether to open the full results or remove the record.
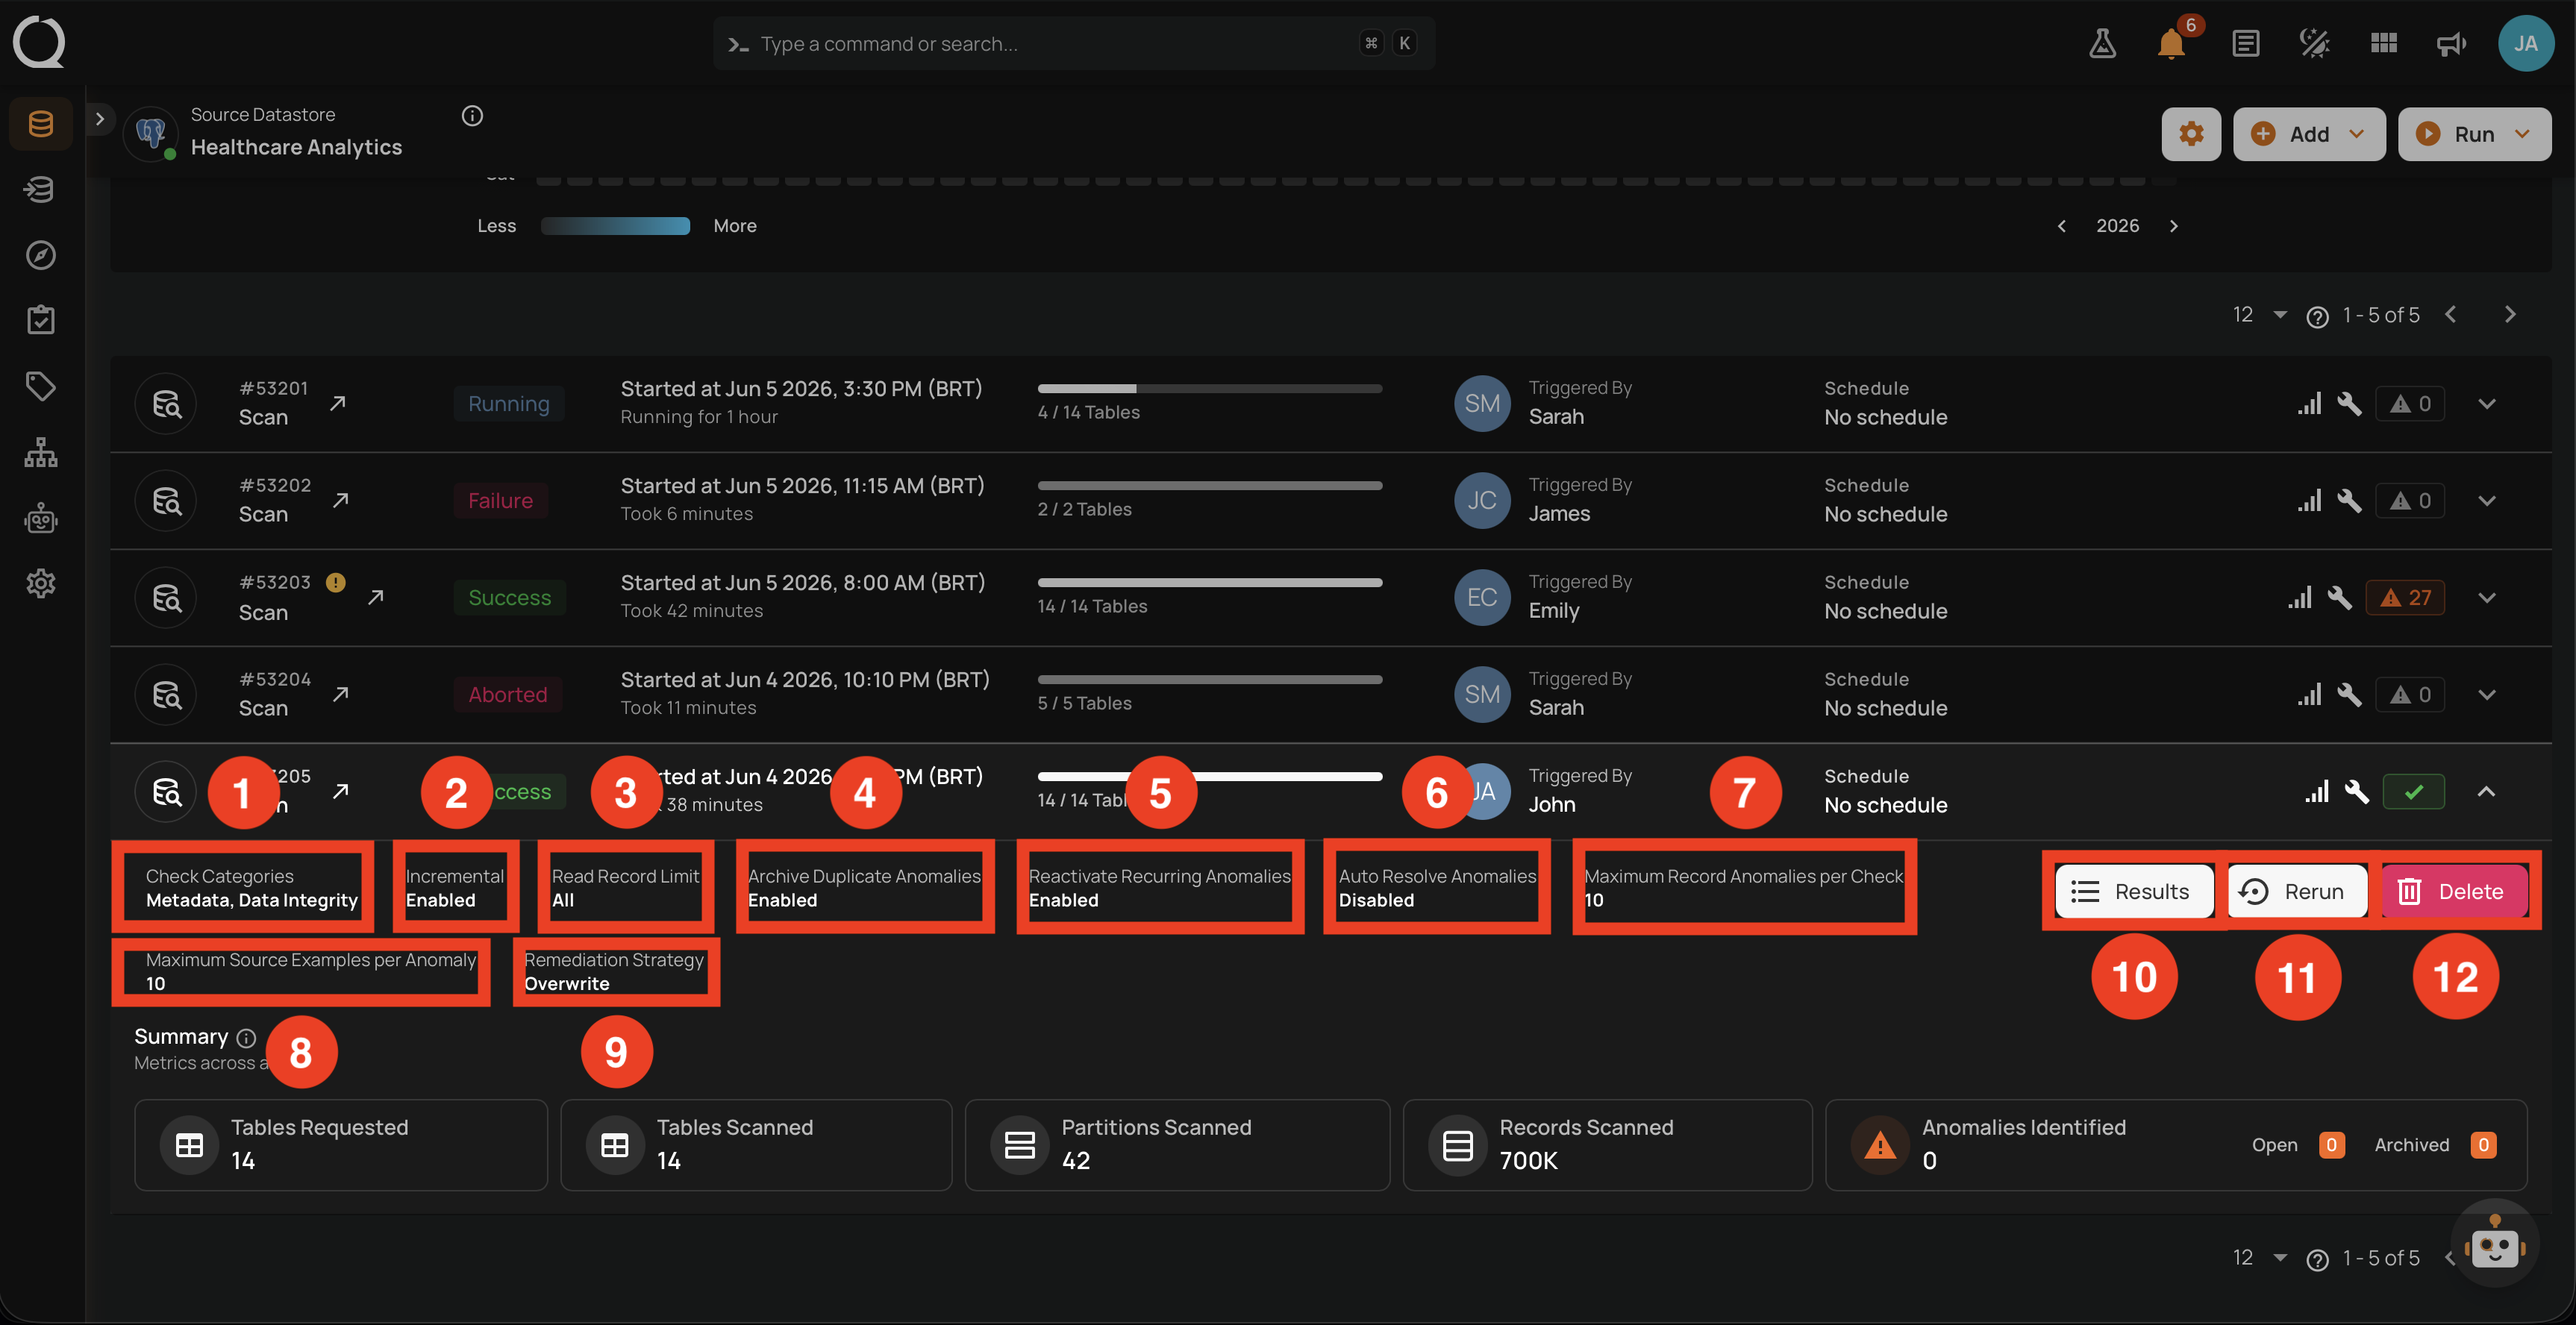
Details of the operation
Expanding the row reveals the Settings that were used for the run (read-only) and the inline action buttons (Results, Rerun, Delete) to operate on the record. This block confirms exactly how the scan was configured (including the Anomaly Options and Advanced Options chosen in Step 4) and gives you the actions to inspect, replay, or remove the operation.
| No. | Setting | What it shows |
|---|---|---|
| 1 | Check Categories | Which categories ran: Metadata, Data Integrity, or both. |
| 2 | Incremental | Whether the read strategy was Incremental (Enabled) or Full (Disabled). |
| 3 | Read Record Limit | The per-container record cap from Step 3 (All means no cap). |
| 4 | Archive Duplicate Anomalies | Whether duplicate anomalies are archived (Enabled/Disabled). |
| 5 | Reactivate Recurring Anomalies | Whether archived anomalies are reactivated when their fingerprint reappears. |
| 6 | Auto Resolve Anomalies | Whether previously open anomalies are resolved when no longer detected (Full scans only). |
| 7 | Maximum Record Anomalies per Check | The rollup threshold used for the run. |
| 8 | Maximum Source Examples per Anomaly | How many source records were captured per anomaly. |
| 9 | Remediation Strategy | The remediation strategy applied (Append, Overwrite, or None). |
| 10 | Results | Action button that opens the Scan Results modal for the operation. |
| 11 | Rerun | Replays the operation with the same configuration. |
| 12 | Delete | Removes the operation record from the Activity list. Anomalies and other downstream artifacts produced by the Run are preserved. |
The settings (1-9) are read-only on the row; to change them, configure a new scan from the Scan Operation modal. The action buttons (10-12) operate on this specific record: Results opens the Scan Results modal, Rerun replays the operation with the same configuration, and Delete removes the operation record (downstream anomalies and artifacts are preserved). The block is most useful for confirming that a recurring schedule is still using the expected settings, and for debugging unexpected anomaly counts (for example, when Auto Resolve was unexpectedly disabled).
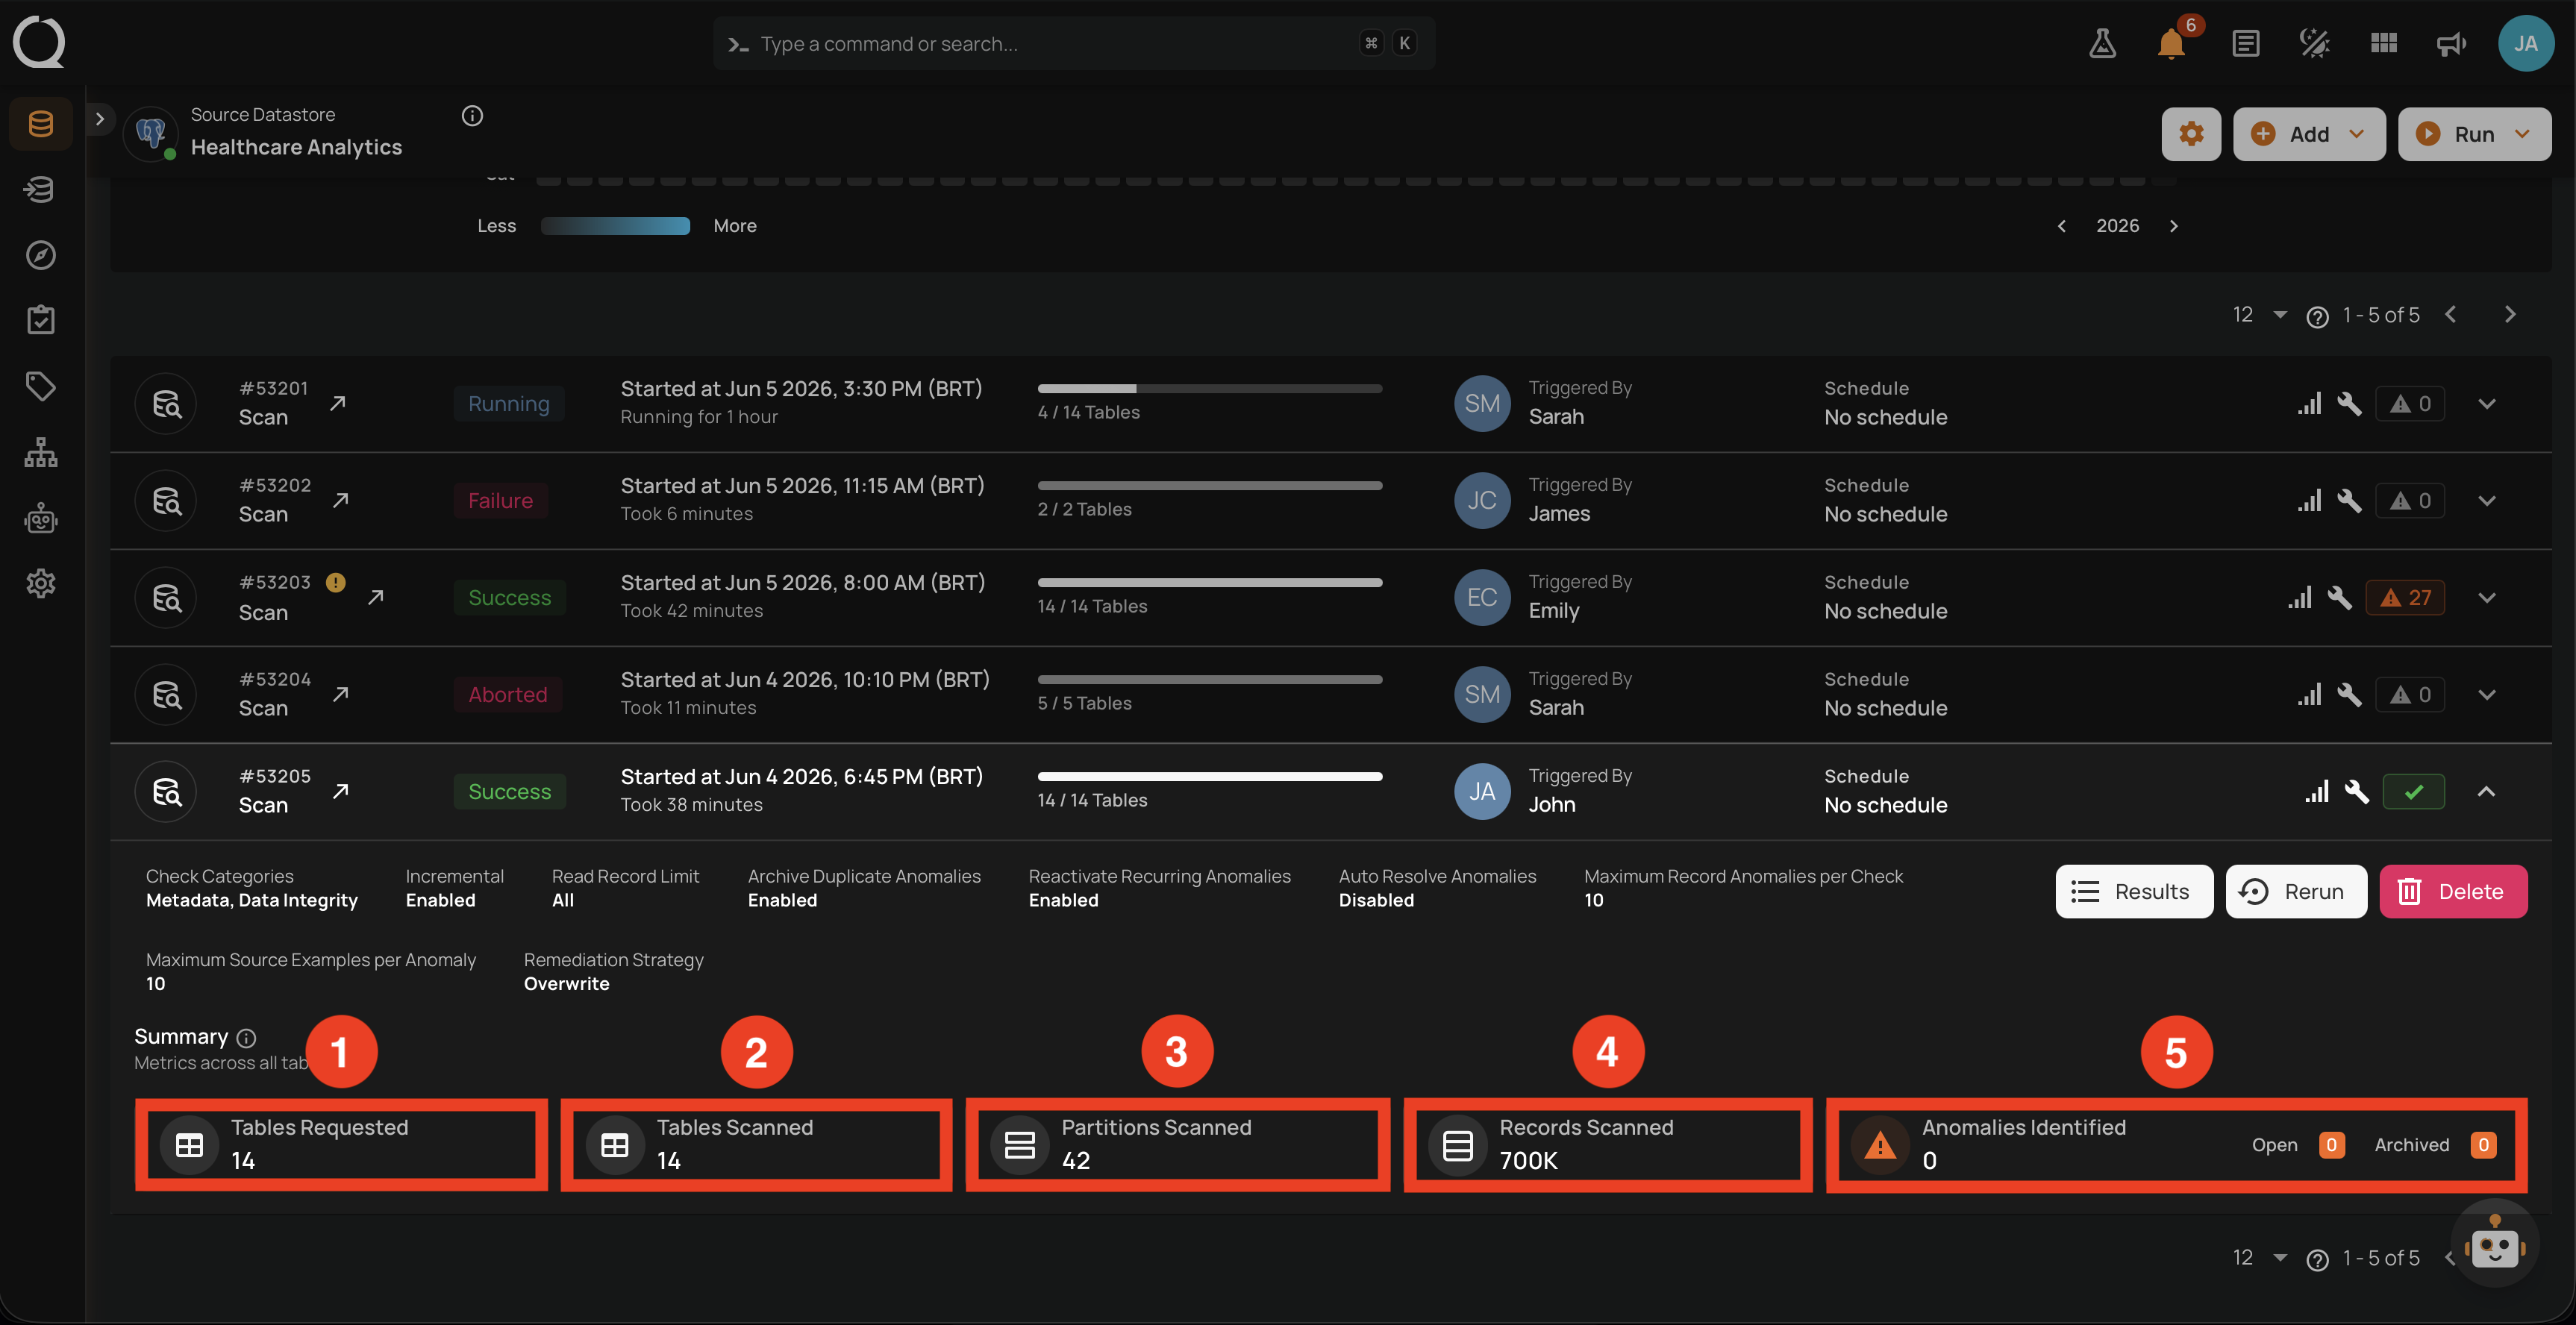
Summary
The Summary section reports the headline metrics for the run. These are the numbers most stakeholders care about and the first thing to share after a scan completes.
| No. | Metric | What it shows |
|---|---|---|
| 1 | Tables Requested | How many containers were targeted by the run, before any per-container skip or fallback. |
| 2 | Tables Scanned | How many of those containers were actually scanned. For Success scans, this typically equals Tables Requested. |
| 3 | Partitions Scanned | Total number of partitions read across all scanned containers. |
| 4 | Records Scanned | Total number of records processed (formatted with K/M/B suffixes when large). |
| 5 | Anomalies Identified | The total count of anomalies detected during the run, with separate Open and Archived counters. |
Compare Tables Requested versus Tables Scanned to detect silent partial failures: if they diverge, some containers were skipped (typically due to Unloadable status). The Anomalies Identified counter is split into Open and Archived because the Archive Duplicate Anomalies setting may have moved some anomalies straight to Archived.
Operation detail page
Clicking the row opens the dedicated operation detail page, which has two top-level tabs: Overview and Results. The Overview tab presents the same information as the expanded row, plus a chronological timeline. The Results tab drills into each container.
Overview tab
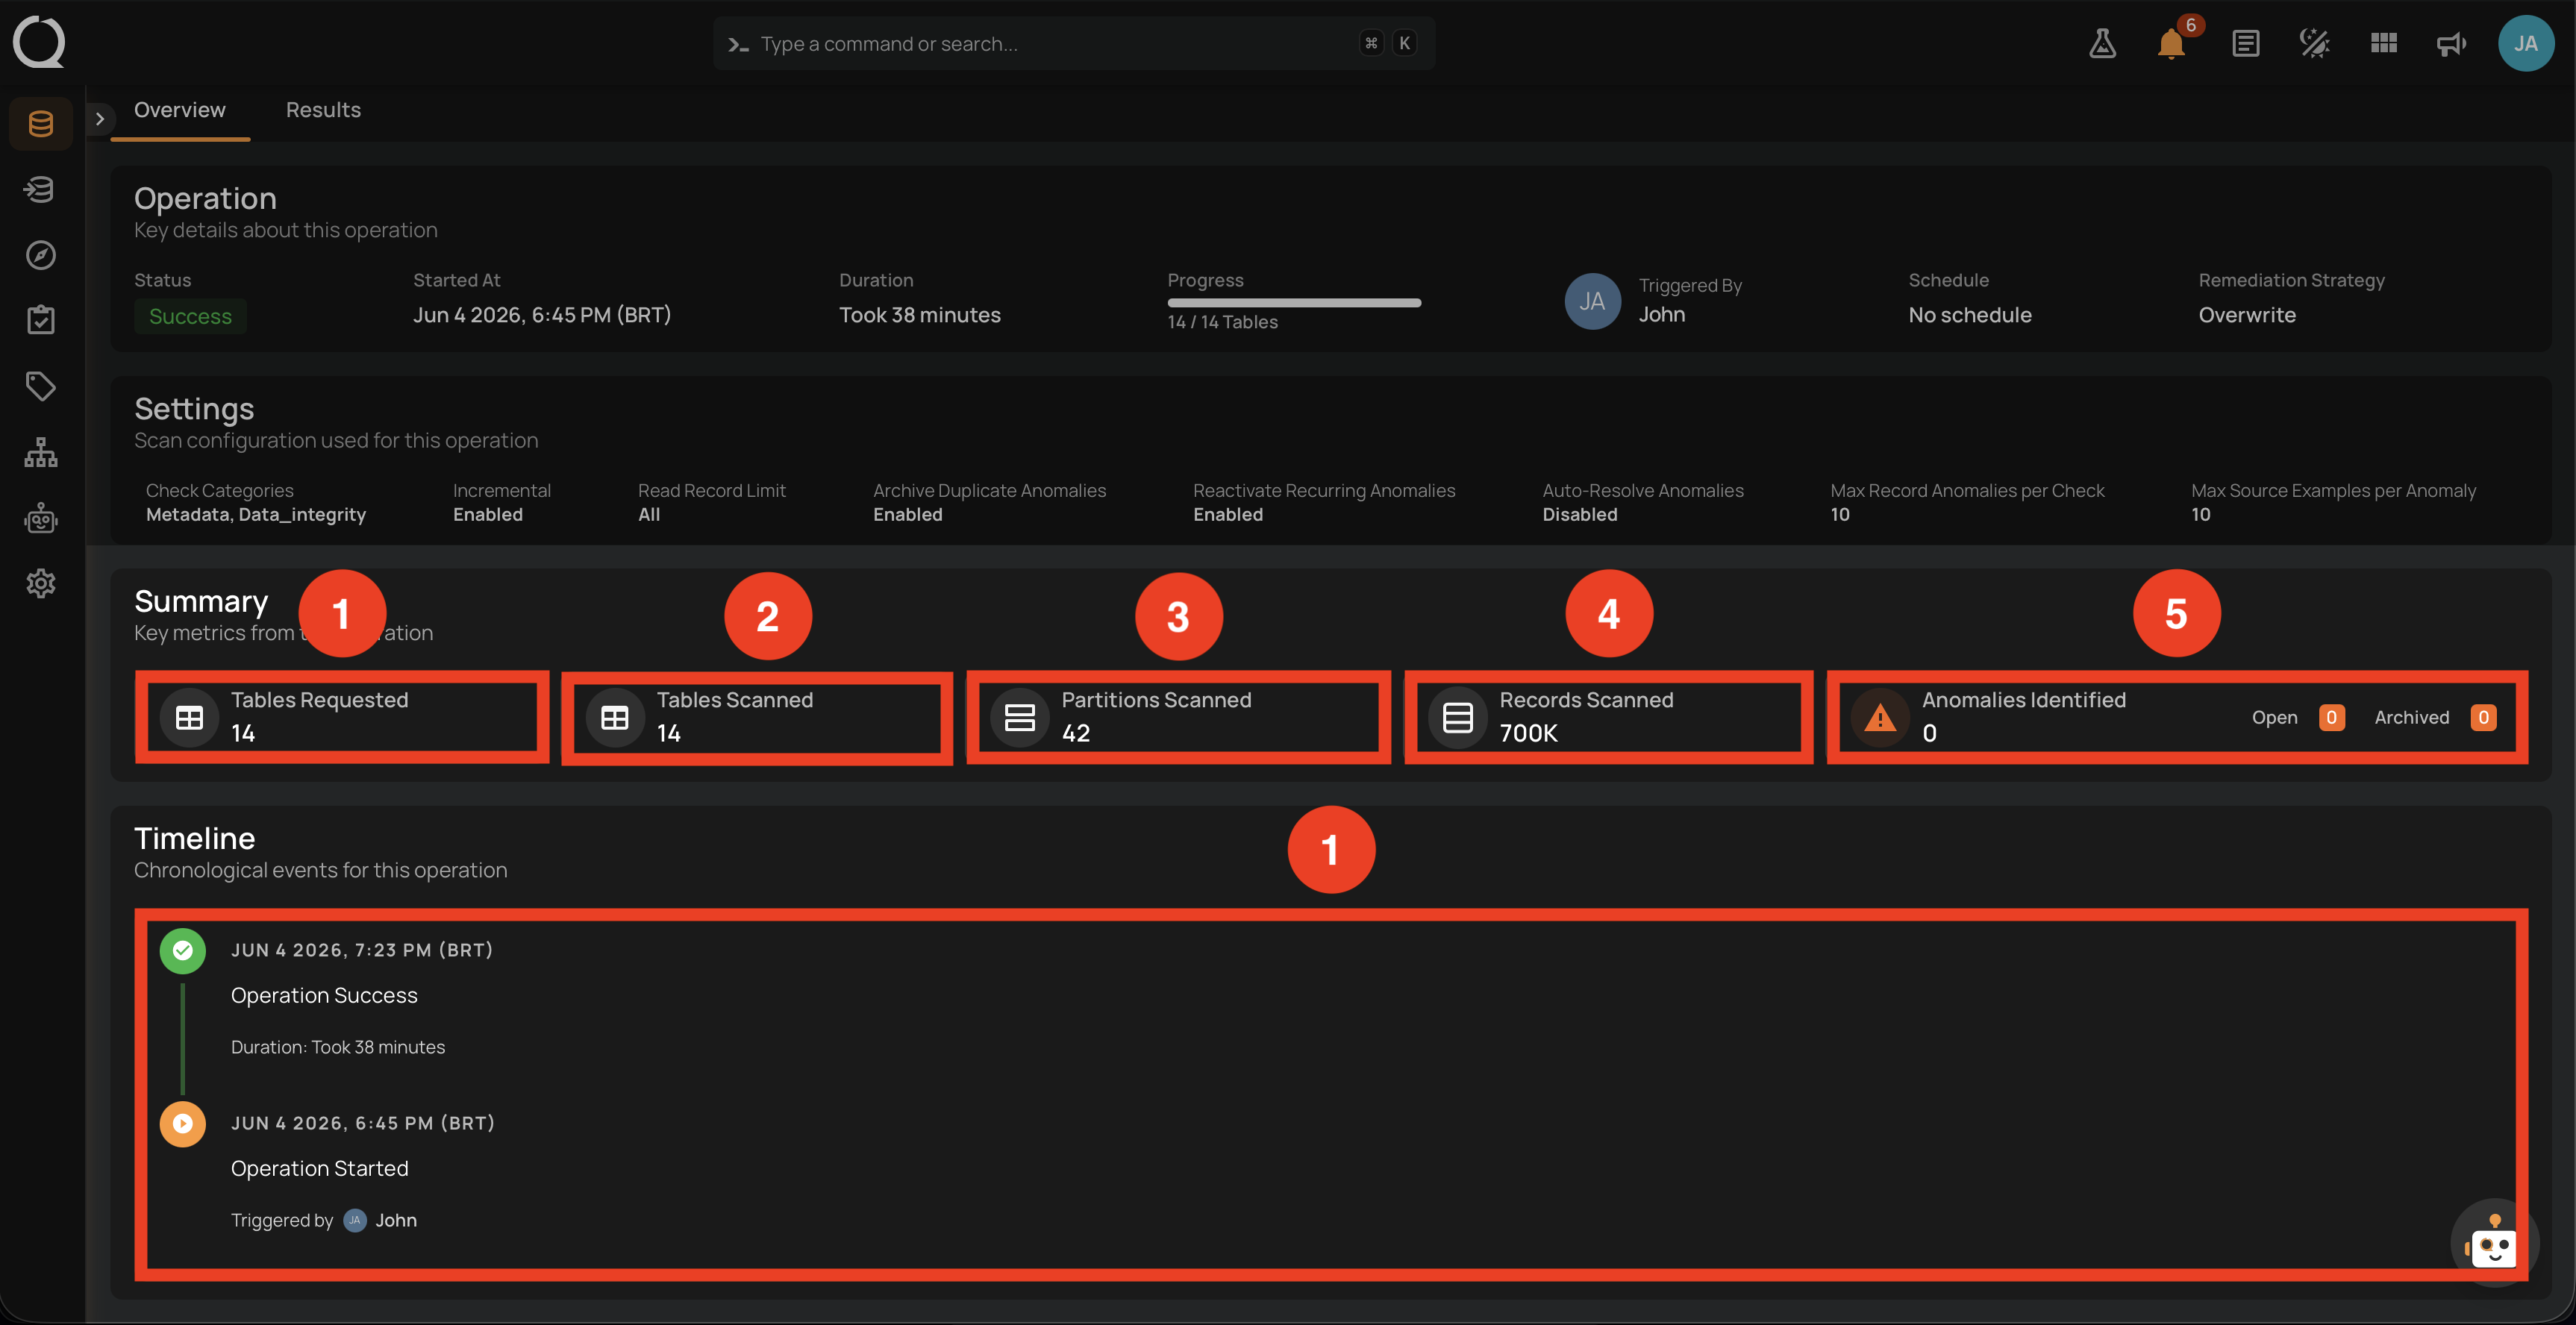
The Overview tab opens with a snapshot of the run, organized into four blocks: Operation, Settings, Summary, and Timeline.
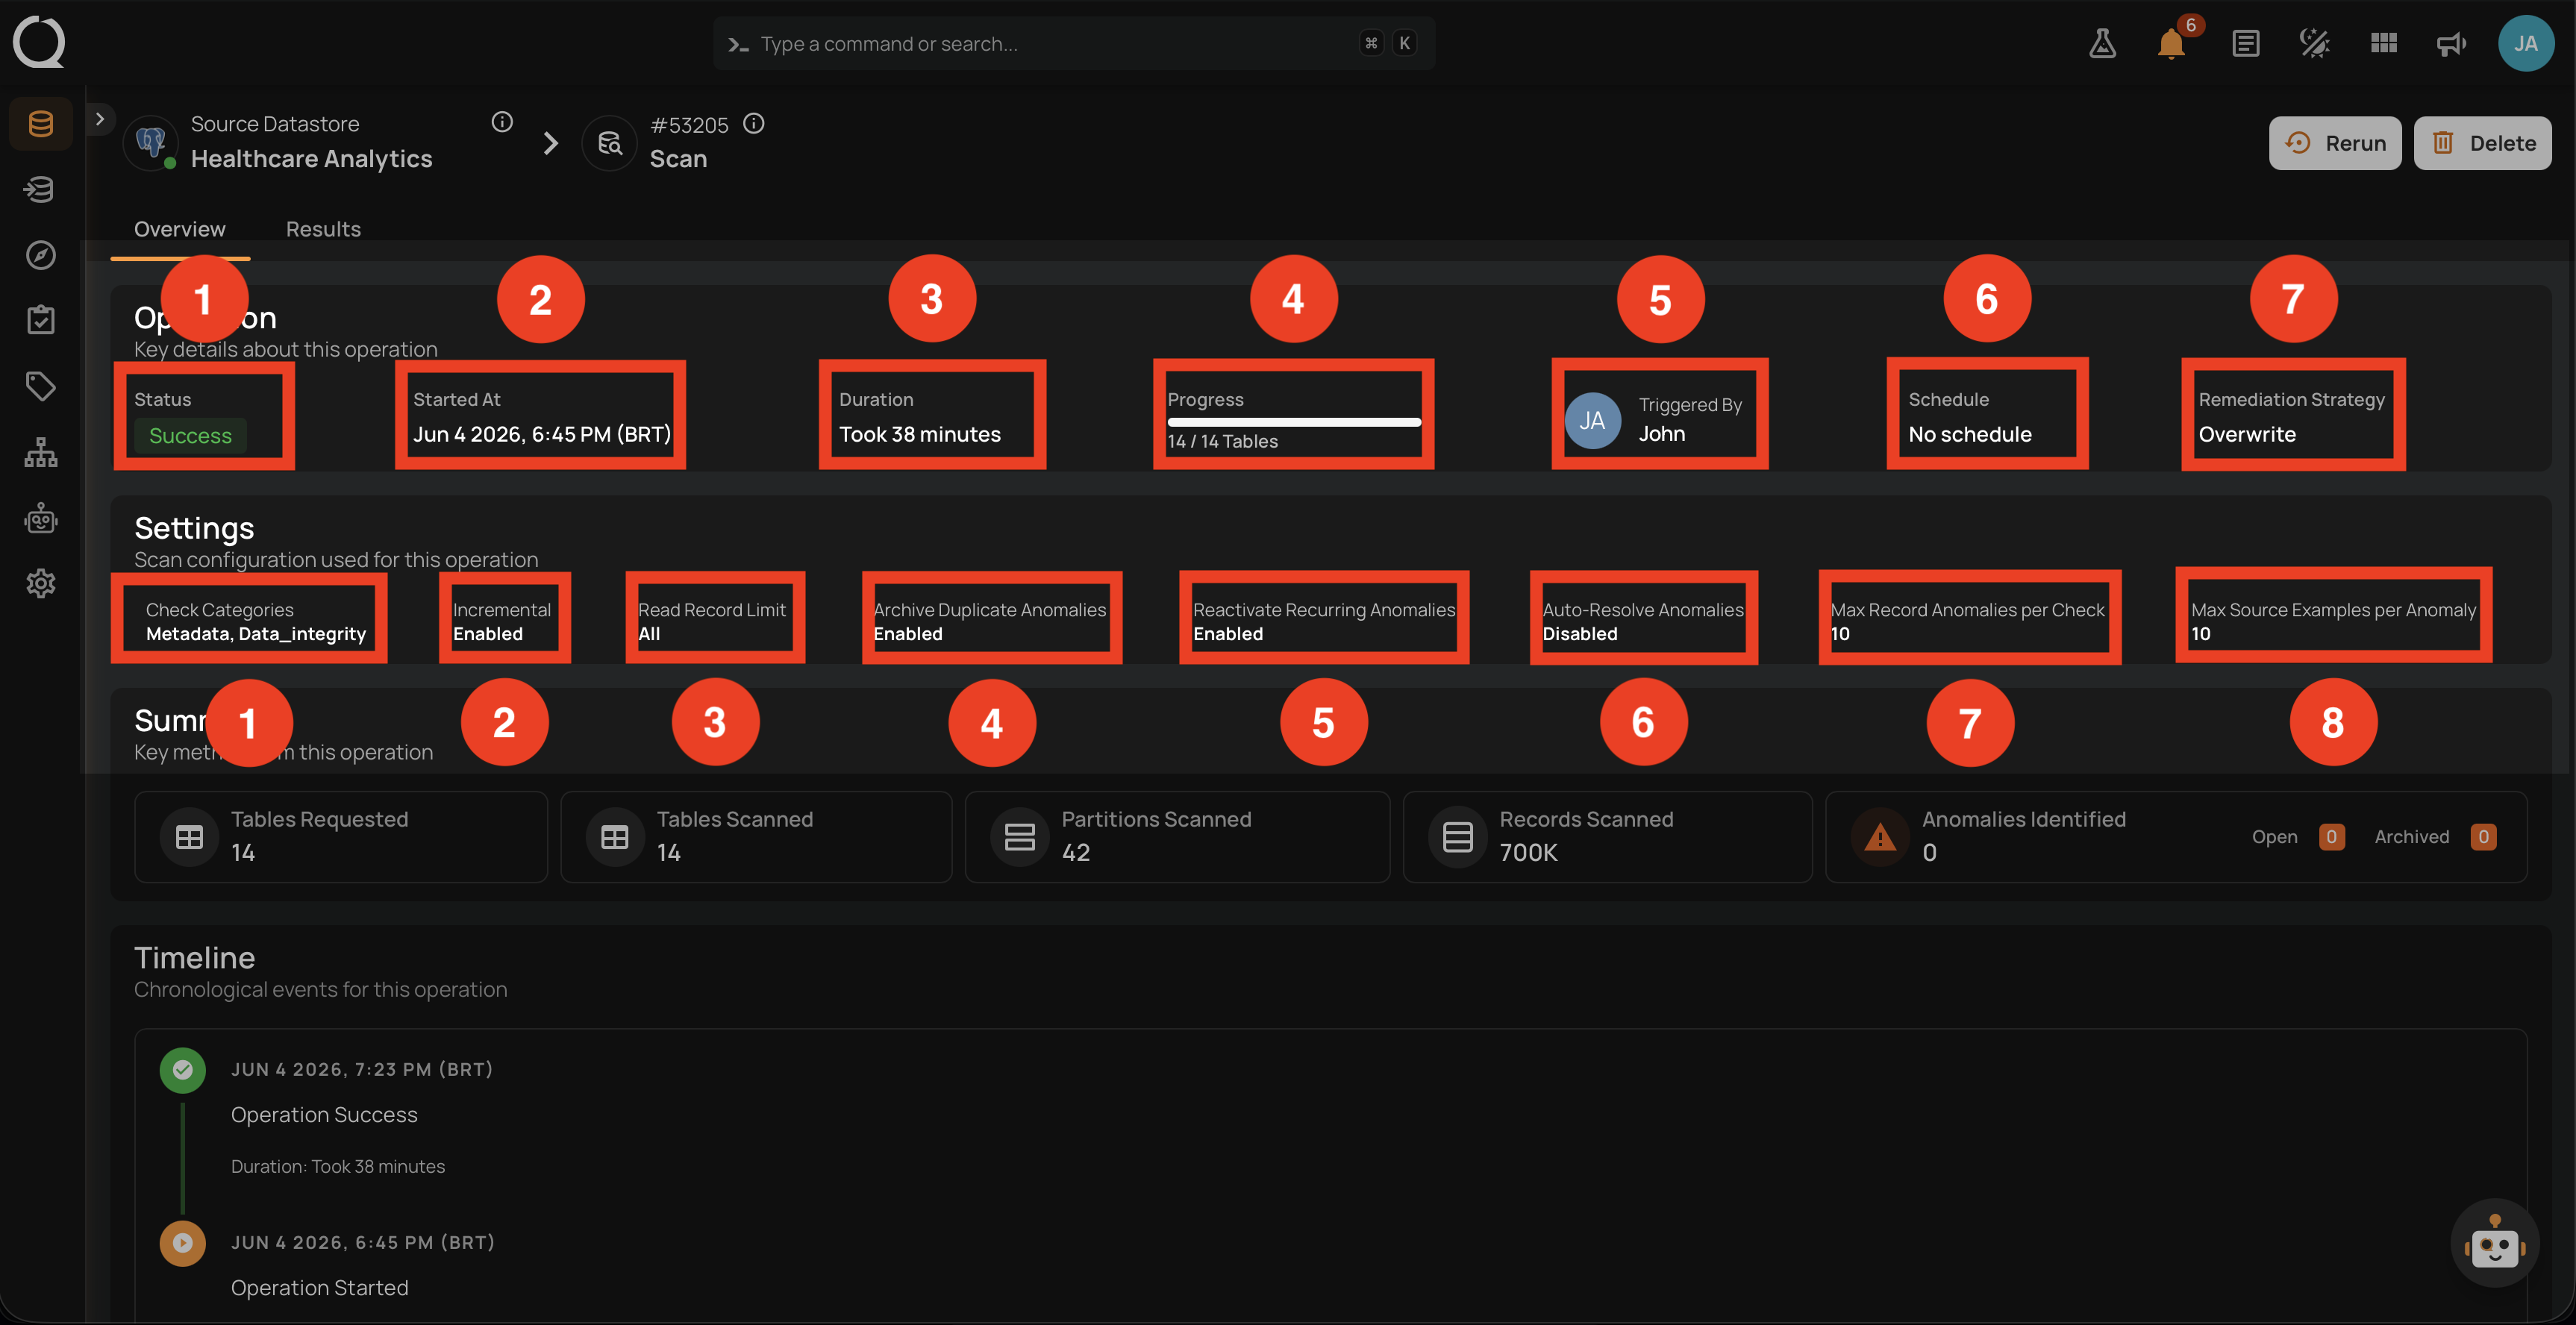
Operation block
The Operation block at the top carries the properties that summarize the run identity and outcome.
| No. | Element | What it shows |
|---|---|---|
| 1 | Status | The state badge (Success). |
| 2 | Started At | Exact start timestamp in the operator's timezone (for example, Jun 4 2026, 6:45 PM (BRT)). |
| 3 | Duration | How long the run lasted (for example, Took 38 minutes). |
| 4 | Progress | Containers processed against total requested (14 / 14 Tables). |
| 5 | Triggered By | User (avatar and name) or schedule. |
| 6 | Schedule | The named schedule (or No schedule). |
| 7 | Remediation Strategy | Effective remediation strategy for the run (Overwrite, Append, or None). |
Settings block
The Settings block lists the scan settings used for the run.
| No. | Setting | What it shows |
|---|---|---|
| 1 | Check Categories | Categories selected in Step 2 (for example, Metadata, Data_Integrity). |
| 2 | Incremental | Whether Incremental was the read strategy (Enabled/Disabled). |
| 3 | Read Record Limit | Per-container record cap (All if uncapped). |
| 4 | Archive Duplicate Anomalies | Setting from Step 4 (Enabled/Disabled). |
| 5 | Reactivate Recurring Anomalies | Setting from Step 4. |
| 6 | Auto-Resolve Anomalies | Setting from Step 4 (Full scans only). |
| 7 | Max Record Anomalies per Check | Rollup threshold used for this run. |
| 8 | Max Source Examples per Anomaly | Source examples cap used. |
Together, the Operation and Settings blocks act as the canonical "what happened" snapshot of the run. If the operation looks wrong, this is the first place to check the inputs.
Summary block
Scrolling down on the Overview tab shows the Summary block, which repeats the headline metrics from the expanded row.
| No. | Element | What it shows |
|---|---|---|
| 1 | Tables Requested | Total containers targeted (14). |
| 2 | Tables Scanned | Total containers actually scanned (14). |
| 3 | Partitions Scanned | Total partitions read (42). |
| 4 | Records Scanned | Total records processed (700K). |
| 5 | Anomalies Identified | Open and Archived counters (Open 0, Archived 0). |
Timeline block
The Timeline is a chronological list of every event recorded for the operation. Each entry in the list follows the same structure.
| Part | Element | What it shows |
|---|---|---|
| Status icon | Marker on the left | A marker colored by event type. See the legend below. |
| Timestamp | Date and time | When the event was recorded, in the viewer's timezone (for example, JUN 4 2026, 7:23 PM (BRT)). Sorted from most recent at the top to oldest at the bottom. |
| Event title | Short label | The event identity (for example, Operation Started, Operation Success, Operation Aborted, Container scan completed). |
| Event detail | Context line | Additional information specific to the event: duration of the run, the user who triggered the operation (with avatar), the container name involved, the abort reason, or other event-specific data. Some events have no detail line. |
Timeline icon legend:
- Operation Success terminal entry.
- Operation Failure terminal entry.
- Operation Aborted terminal entry.
- Operation In Progress (Queued or Running, animated in the UI).
- Operation Started.
- Per-container entries inherit the same icon and color based on each container's own outcome (Success/Failure/Aborted/Running).
For a Success scan, the typical events shown are:
Operation Successat the top, withDuration: Took N minutes.- One
Container scan completedentry per container scanned (when the operation includes per-container events). Operation Startedat the bottom, withTriggered by <user>.
The Timeline is the audit trail for the operation. Use it to confirm exactly when a specific container started scanning, when the first anomaly was emitted, or when the operation transitioned to a final state. For Aborted and Failure operations, the Timeline also records the user or system that triggered the abort and the timestamp. Use this as the audit record for the operation.
Results tab
The Results tab lists every container scanned by the operation, with anomaly counts and overall status. Each row links to the container's detail page. Use this view to find the containers with the most anomalies or to navigate to a specific scanned table.
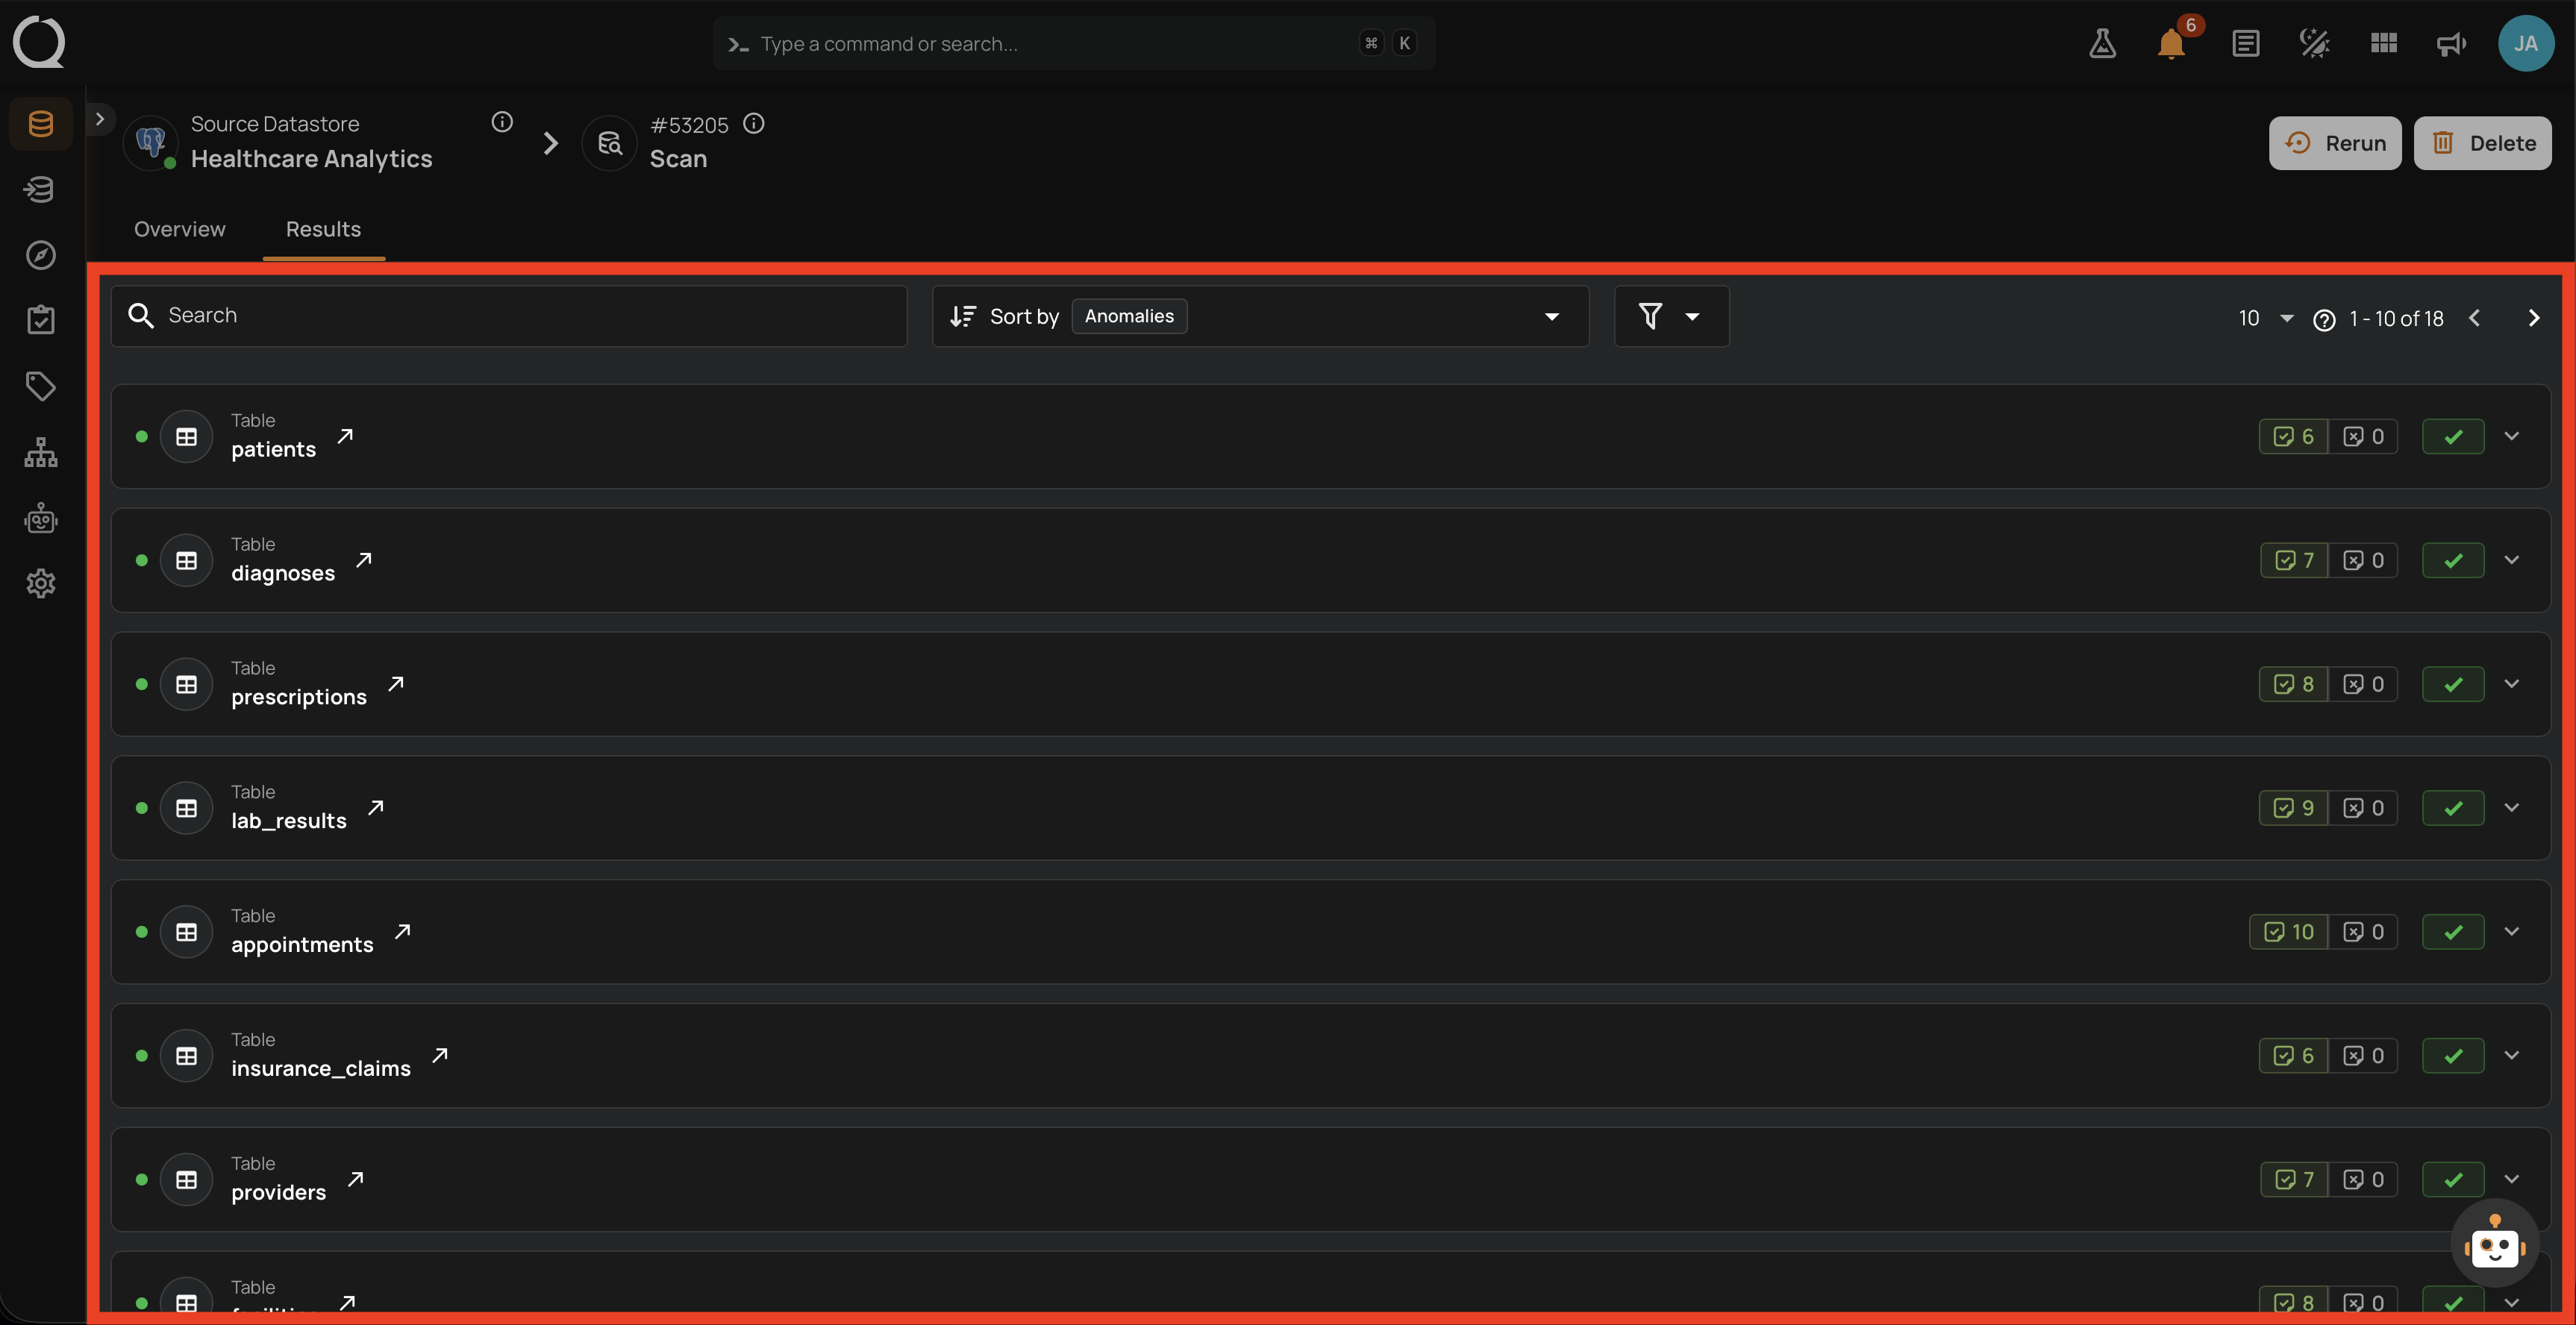
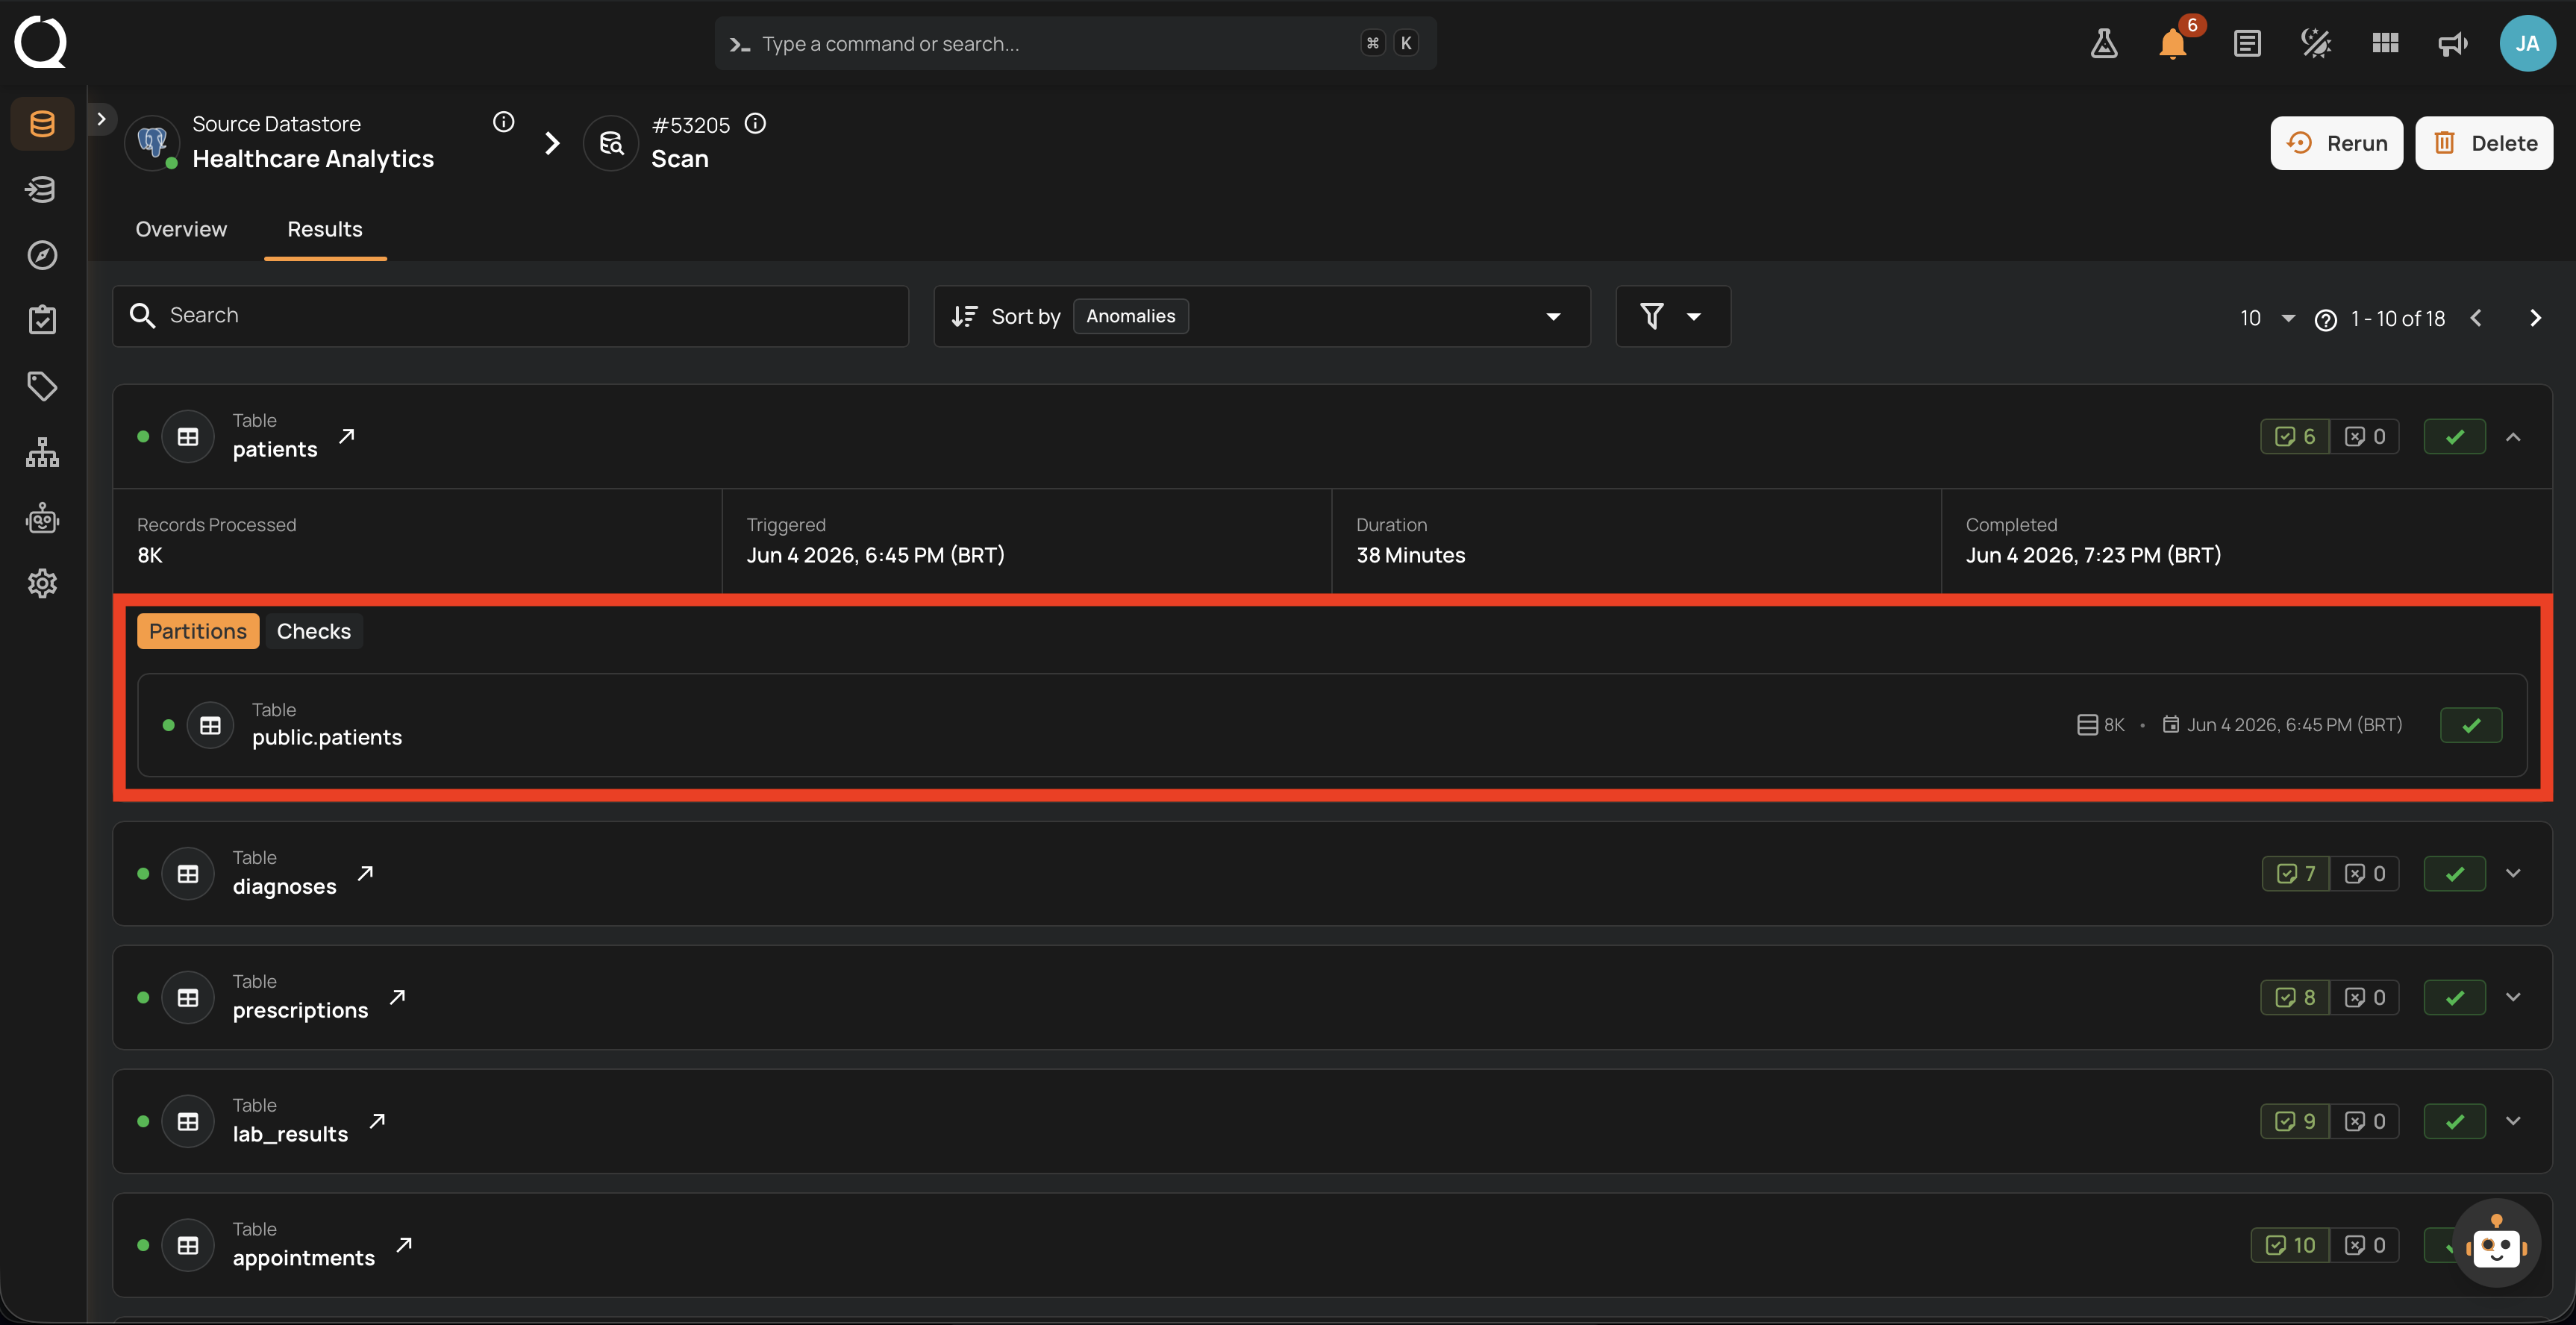
Container sub-tabs
Expanding a container row reveals two sub-tabs that drill into the per-container results. A Source Records sub-tab also appears when the scan captures source records for anomalies; this example produced zero anomalies, so the sub-tab is not shown here. For a worked example of Source Records with anomalies, see Success with Warning.
Partitions
Lists every partition read for this container, with size, read timestamp, completion time, and per-partition counters (records processed, anomalies emitted). Use this view to confirm coverage when a container is processed across many partitions. The partition list loads on demand when the sub-tab opens and is paginated, and a toolbar above the list adds a search box and status filters (All, Passed, Failed) so you can jump straight to the partitions that need attention. The toolbar is hidden for JDBC containers, which scan as a single partition.
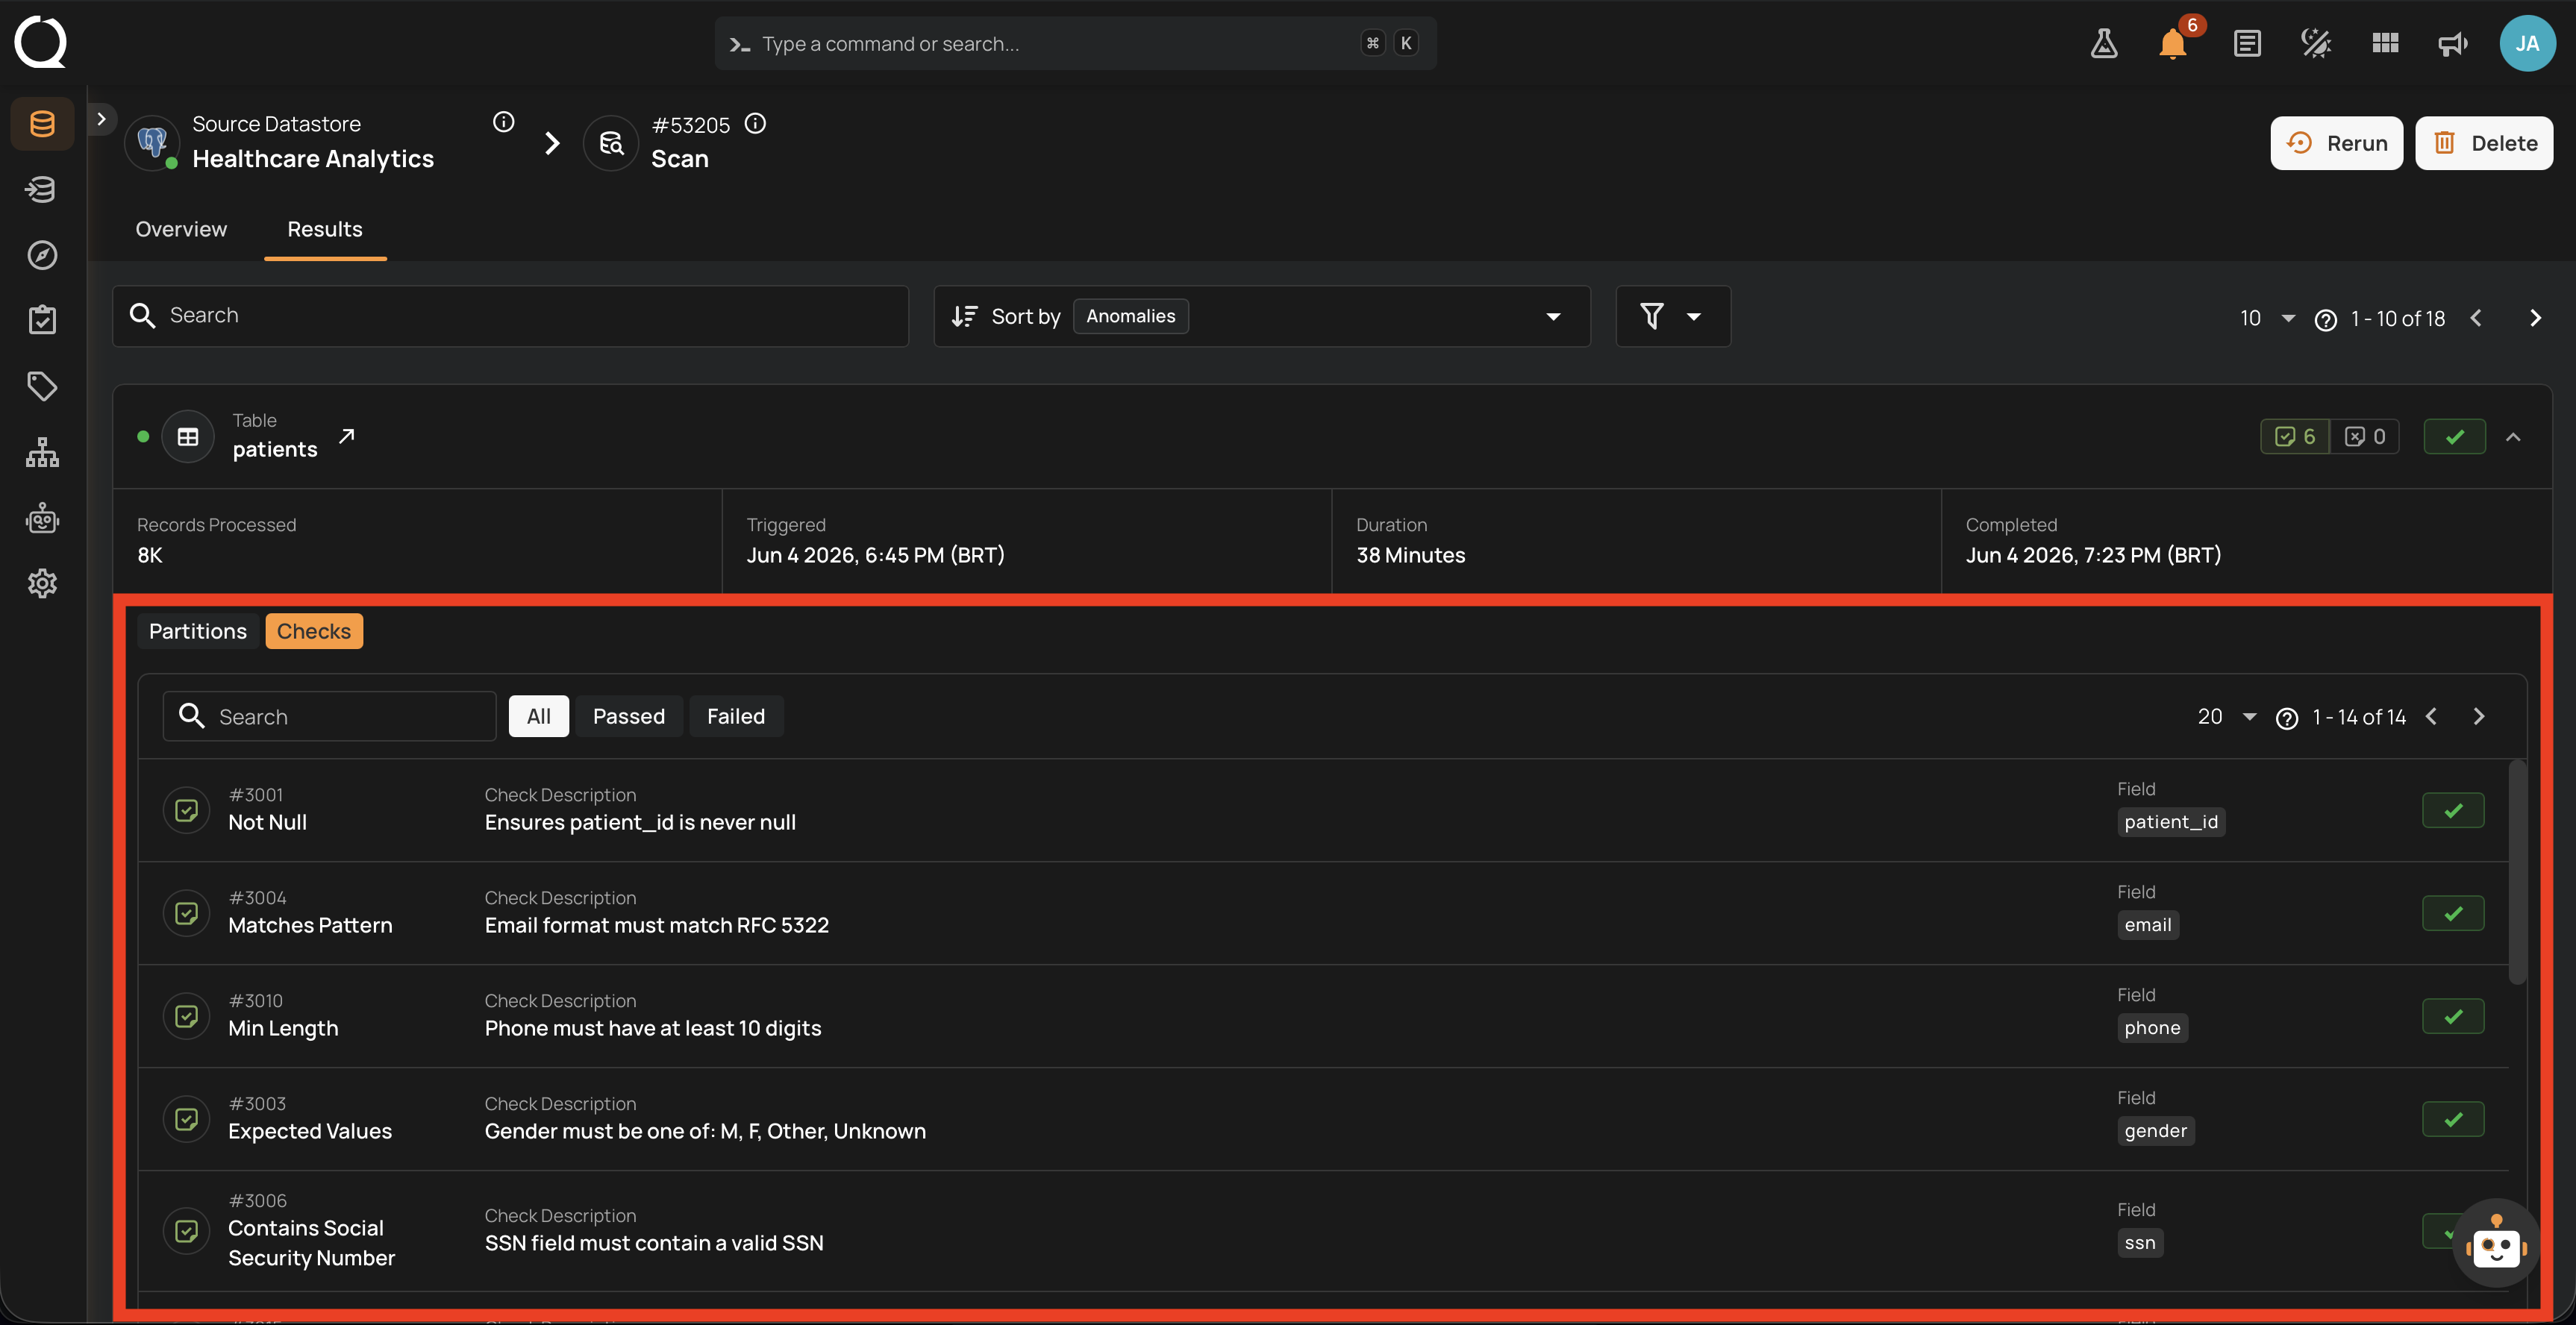
Checks
Lists every check that was asserted against this container, with check ID, name, description, target field, and pass/fail status. A toolbar above the list provides a search box and status filters (All, Passed, Failed) so you can focus on the checks that did not pass. This is the most actionable view: it tells you exactly which expectations broke on this container during this scan.
See also
-
Success with Warning
The Run finished cleanly but the worker recorded log entries during execution.
-
Failure
The Run stopped because of an unrecoverable error.
-
Aborted
A user or the system stopped the Run before completion.
-
Running
A worker is actively processing the Run; counters update live.
-
Queued
The Run is registered but no worker has picked it up yet.
-
Lifecycle
State diagram, transitions, and per-operation-type lifecycle.
-
Available Actions
Abort, Resume, Rerun, and Delete: when each one is shown.