Explore
Explore brings quality signals, operation history, profiles, observability measurements, checks, and anomalies together across the source datastores you can access. Use the Insights, Activity, Profiles, Observability, Checks, and Anomalies tabs to move from a broad view of data health to the records behind a finding. Global filters for source datastores and tags, which you can save and reapply as filter presets, apply to every tab and help data stewards focus on the data they are responsible for; the Insights tab adds a report date and time frame of its own. These views update as Qualytics records new operation results and measurements.
Navigation
Step 1: Log in to your Qualytics account and click the Explore button on the left side panel of the interface.
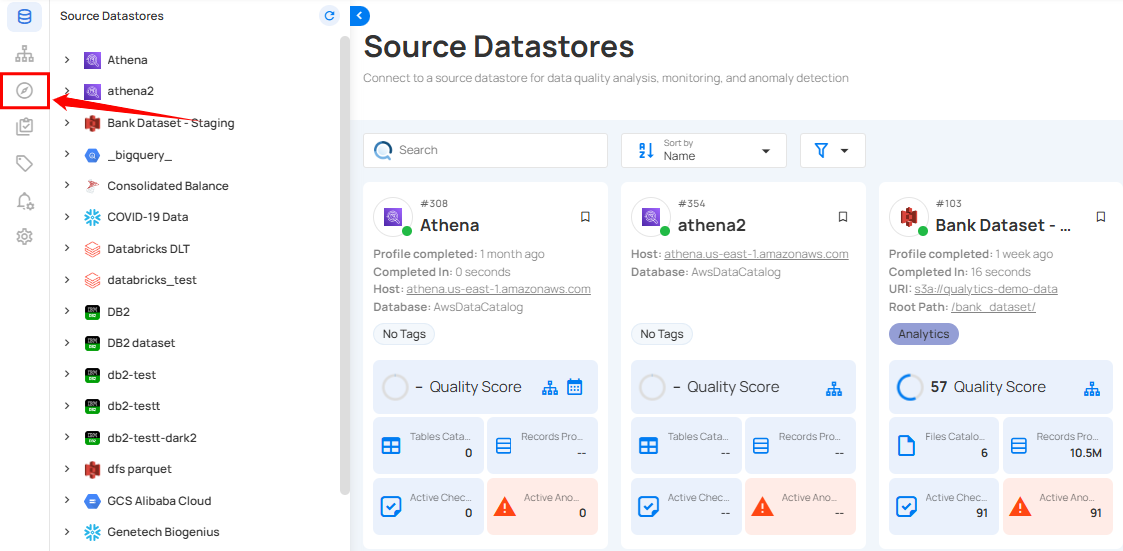
Step 2: After clicking Explore, you will see the following tabs: Insights, Activity, Profiles, Observability, Checks, and Anomalies.

Insights
The Insights tab summarizes recorded Quality Scores, active checks, Profile and Scan activity, and anomalies for the selected source datastores, report date, and time frame. Use it to identify changes that need a closer review before opening the related profiles, checks, or anomalies.
For more details on Insights, please refer to the Insights documentation.
Activity
The Activity tab shows operation runs and schedules across source datastores. Use it to review what ran, what is scheduled, and the recorded outcome of each operation.
For more details on Activity, please refer to the Activity documentation.
Profiles
The Profiles tab helps data stewards review tables, files, and fields discovered through Sync and measured through Profile operations. Filtering, sorting, tags, and profile details help you find the assets you are responsible for and understand their recorded structure and statistics.
For more details on Profiles, please refer to the Profiles documentation.
Observability
The Observability tab brings together recorded Volumetric, Freshness, and Metric measurements. Under Measures, Volumetric checks evaluate row counts and Freshness checks evaluate how recently data changed. Under Metrics, field-level checks evaluate values recorded by relevant Profile and Scan operations. Charts update when new measurements are recorded, helping data stewards identify unexpected changes and review related anomalies.
For more details on Observability, please refer to the Observability documentation.
Checks
The Checks tab lists the quality checks applied to tables, files, and fields across source datastores. Checks describe expected formats, values, relationships, and business rules. Filter and sort the list to review active, draft, or archived checks and confirm that the right expectations cover the data you are responsible for.
For more details on Checks, please refer to the Checks documentation.
Anomalies
The Anomalies tab lists potential data quality issues surfaced when data does not meet a check's criteria. Data stewards can filter and sort findings across source datastores, review active, acknowledged, and assigned anomalies, and follow resolved or otherwise archived findings.
For more details on Anomalies, please refer to the Anomalies documentation.