View Promotion Results
Every promote operation records detailed per-entity results. You can review these results to verify what happened during the promotion: which entities were created, updated, skipped, or failed, and why.
Where to Find Results
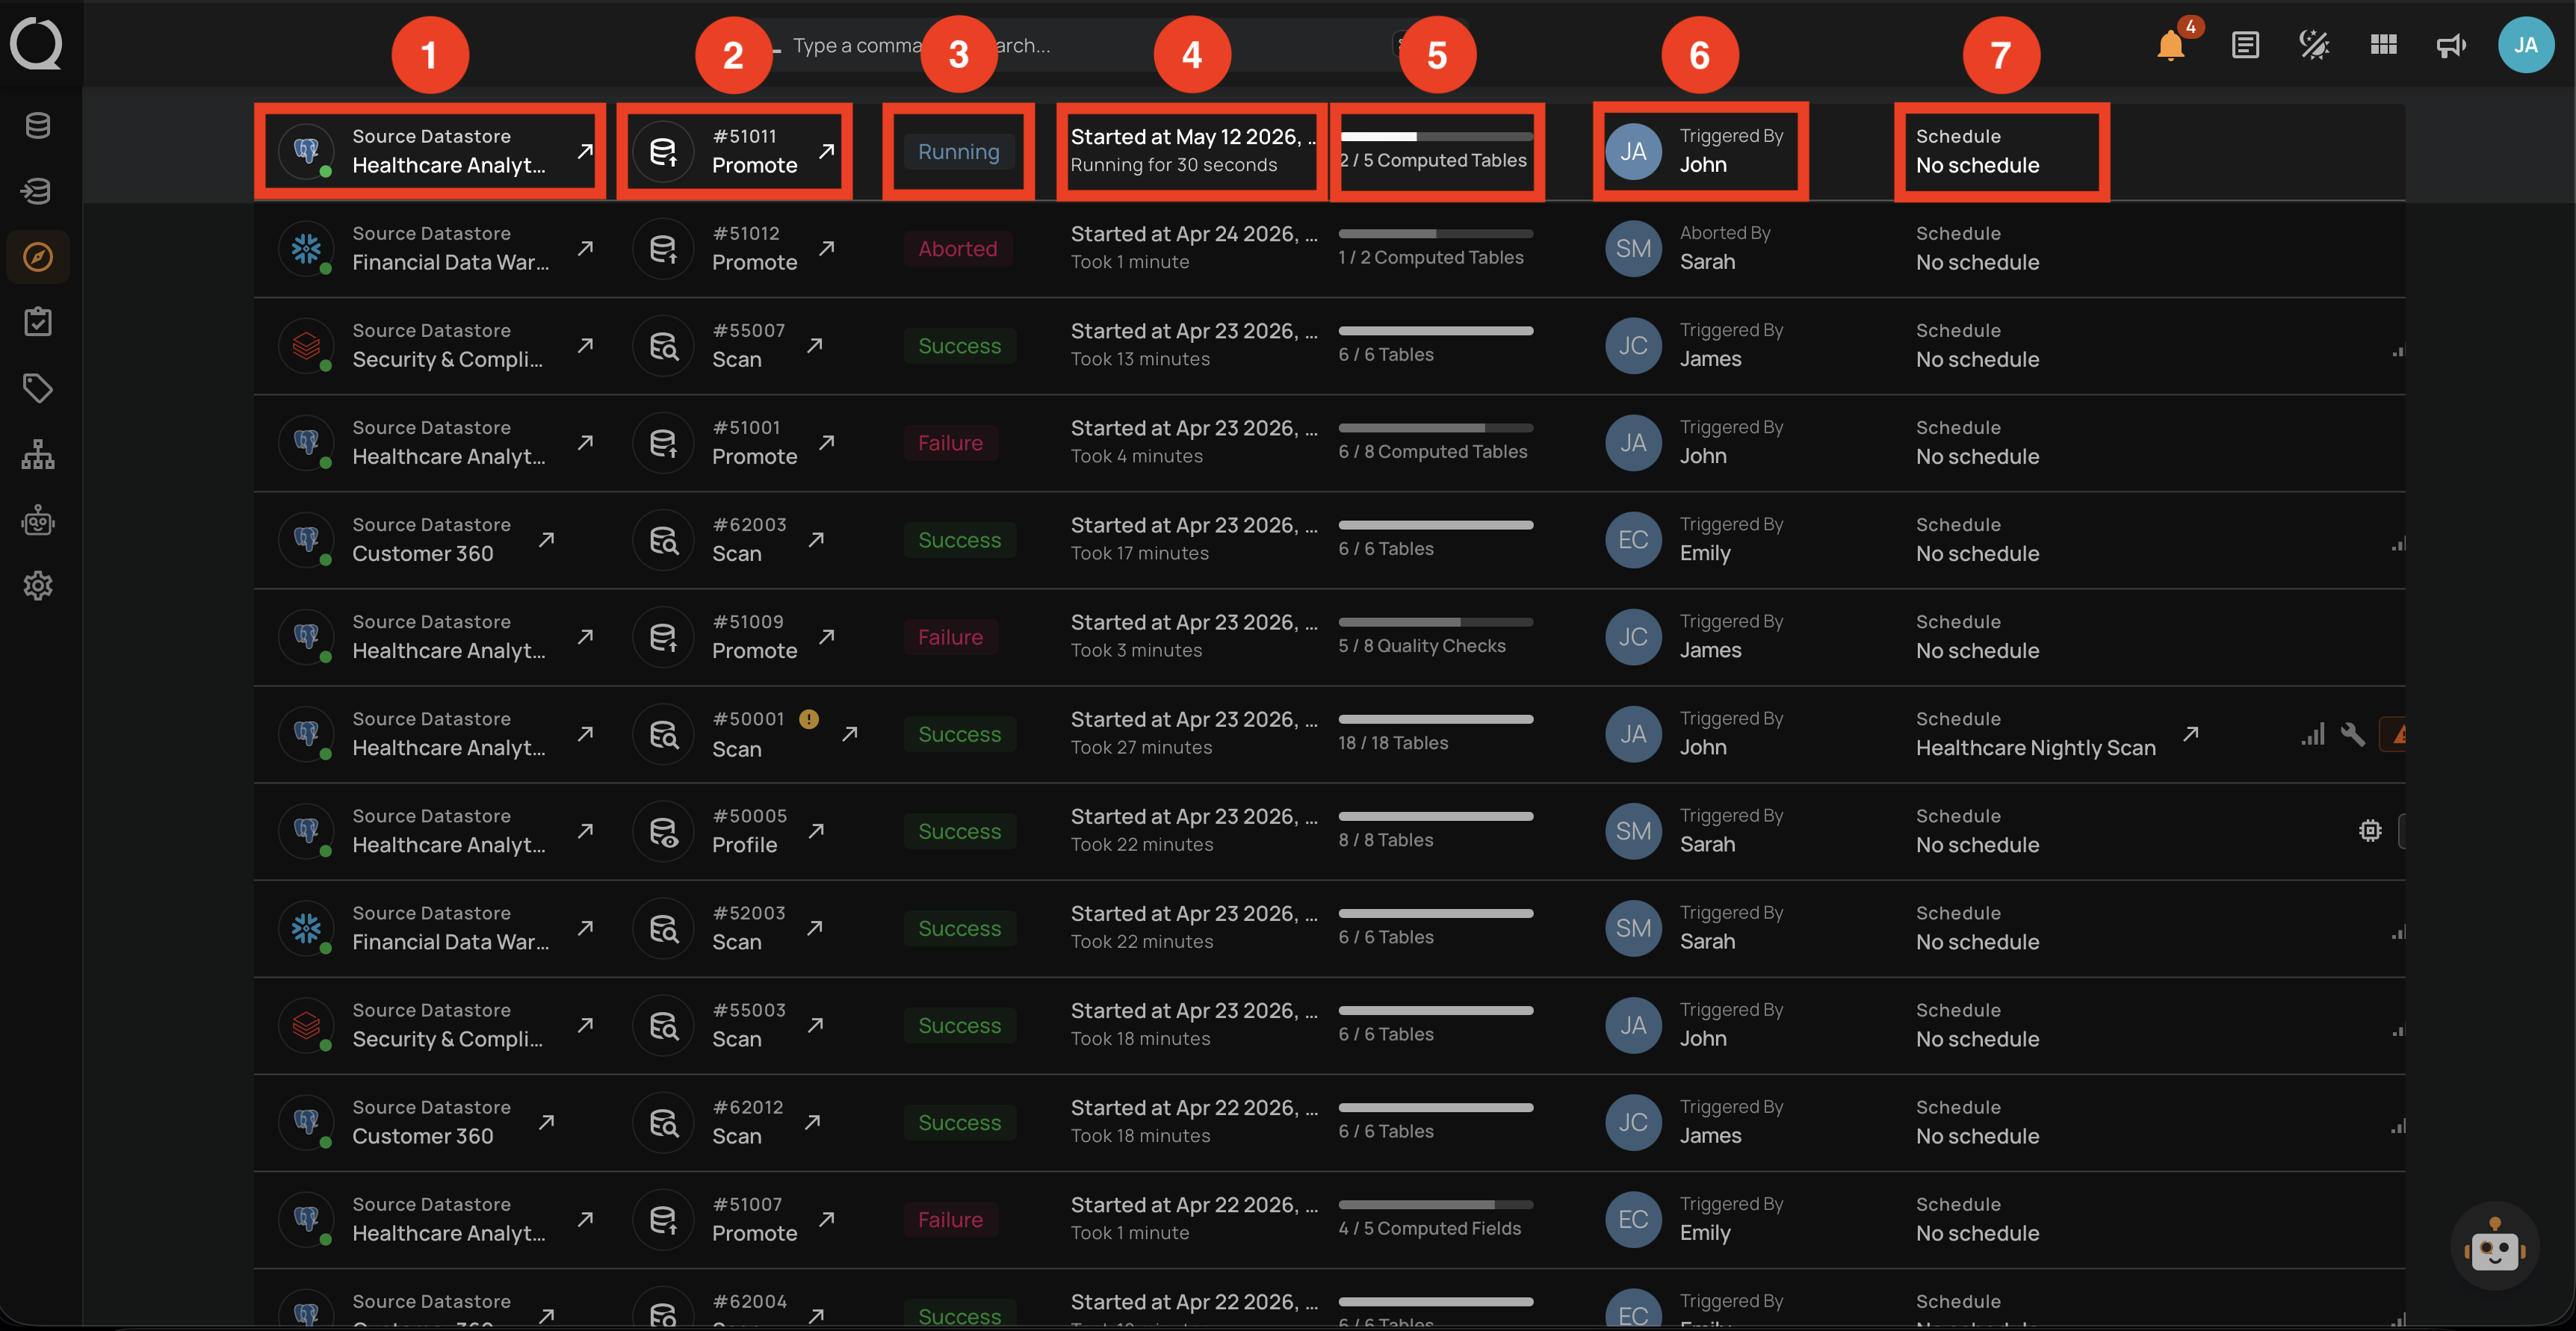
Promote operations appear on the Activity page alongside other operations. You can identify them by the promote type label and the promote-type indicator (quality check, computed field, computed table, or computed file).
| REF. | FIELD | DESCRIPTION |
|---|---|---|
| 1 | Source Datastore | The datastore the promotion was triggered from. |
| 2 | Operation ID and type | The unique operation ID prefixed with #, alongside the operation type (Promote). |
| 3 | Status badge | Current state: Running, Success, Failure, or Aborted. |
| 4 | Started At / Duration | When the operation started and either its total duration (if complete) or how long it has been running. |
| 5 | Counter | For running and completed operations, how many entities have been processed out of the total (e.g. 2 / 5 Computed Tables). The entity label changes with the promote type. |
| 6 | Triggered By | The user who launched the operation. |
| 7 | Schedule | The schedule that fired the operation, or No schedule when it was launched manually. |
Click the operation row on the Activity page to open the results. The detail page is split into two tabs:
- Overview shows operation metadata, summary metrics, and the event timeline at a glance.
- Results shows the per-entity list with status badges, action links, and expandable logs.
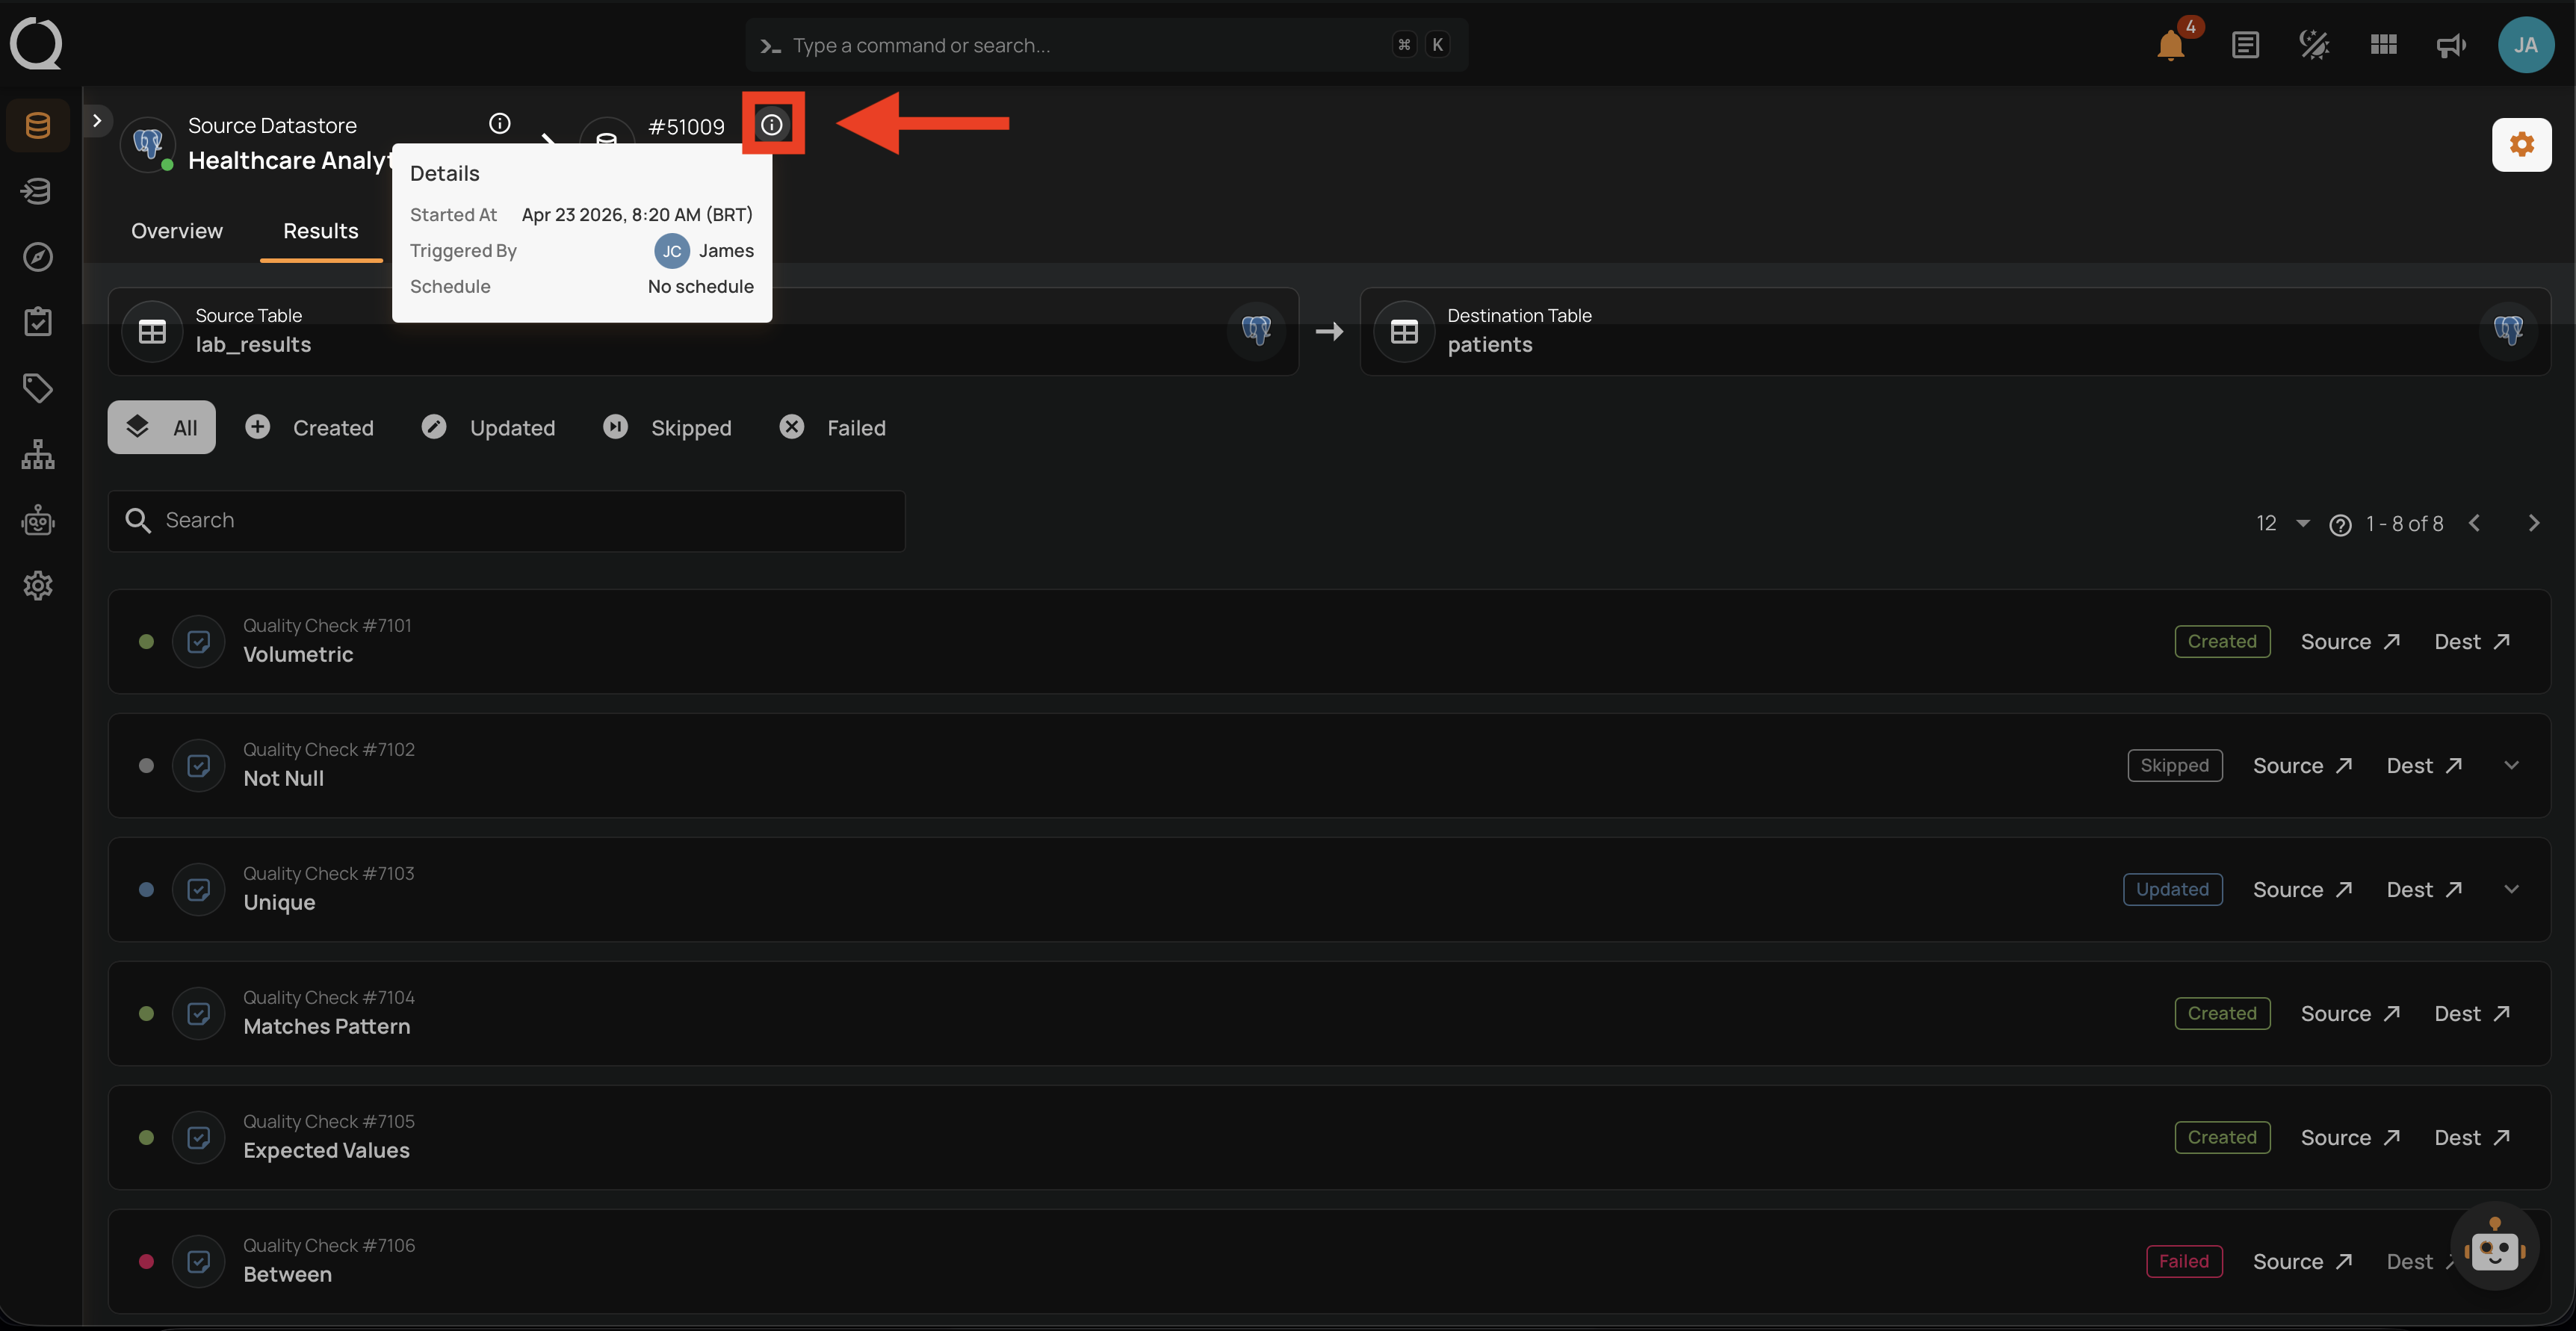
Both tabs share the same header at the top of the page. Hover the info icon next to the operation ID to see the Details popover with Started At, Triggered By, and Schedule.
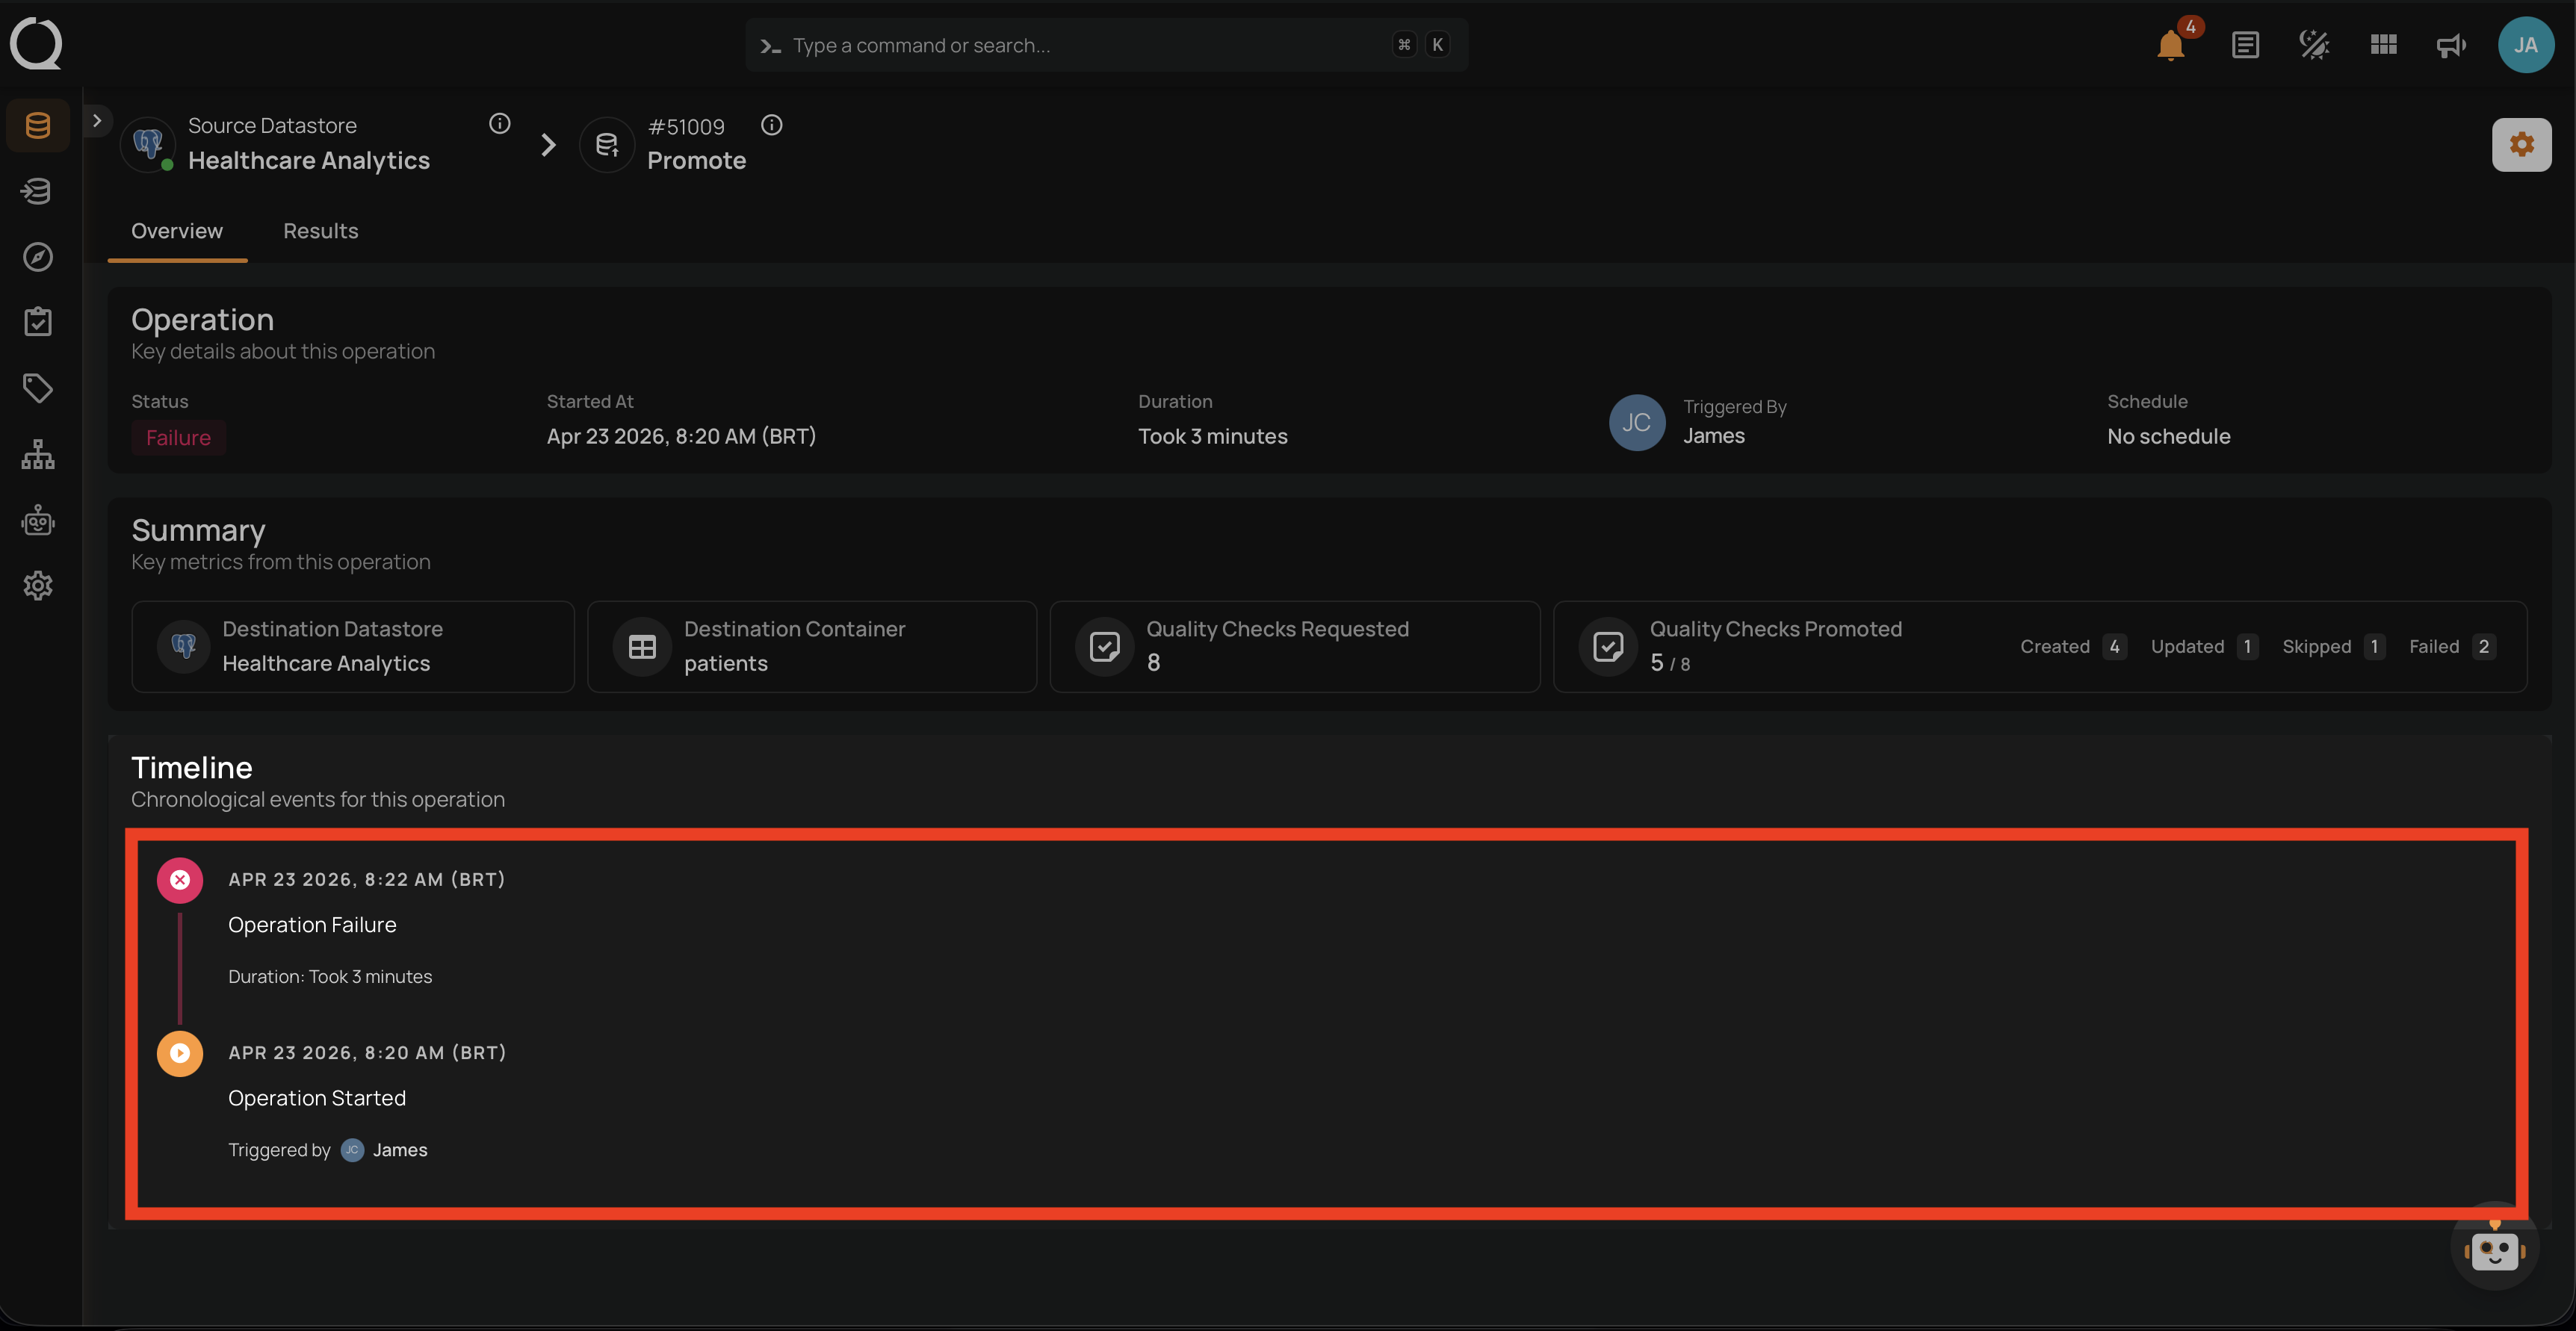
Overview Tab
The Overview tab summarizes the operation in three panels: Operation, Summary, and Timeline.
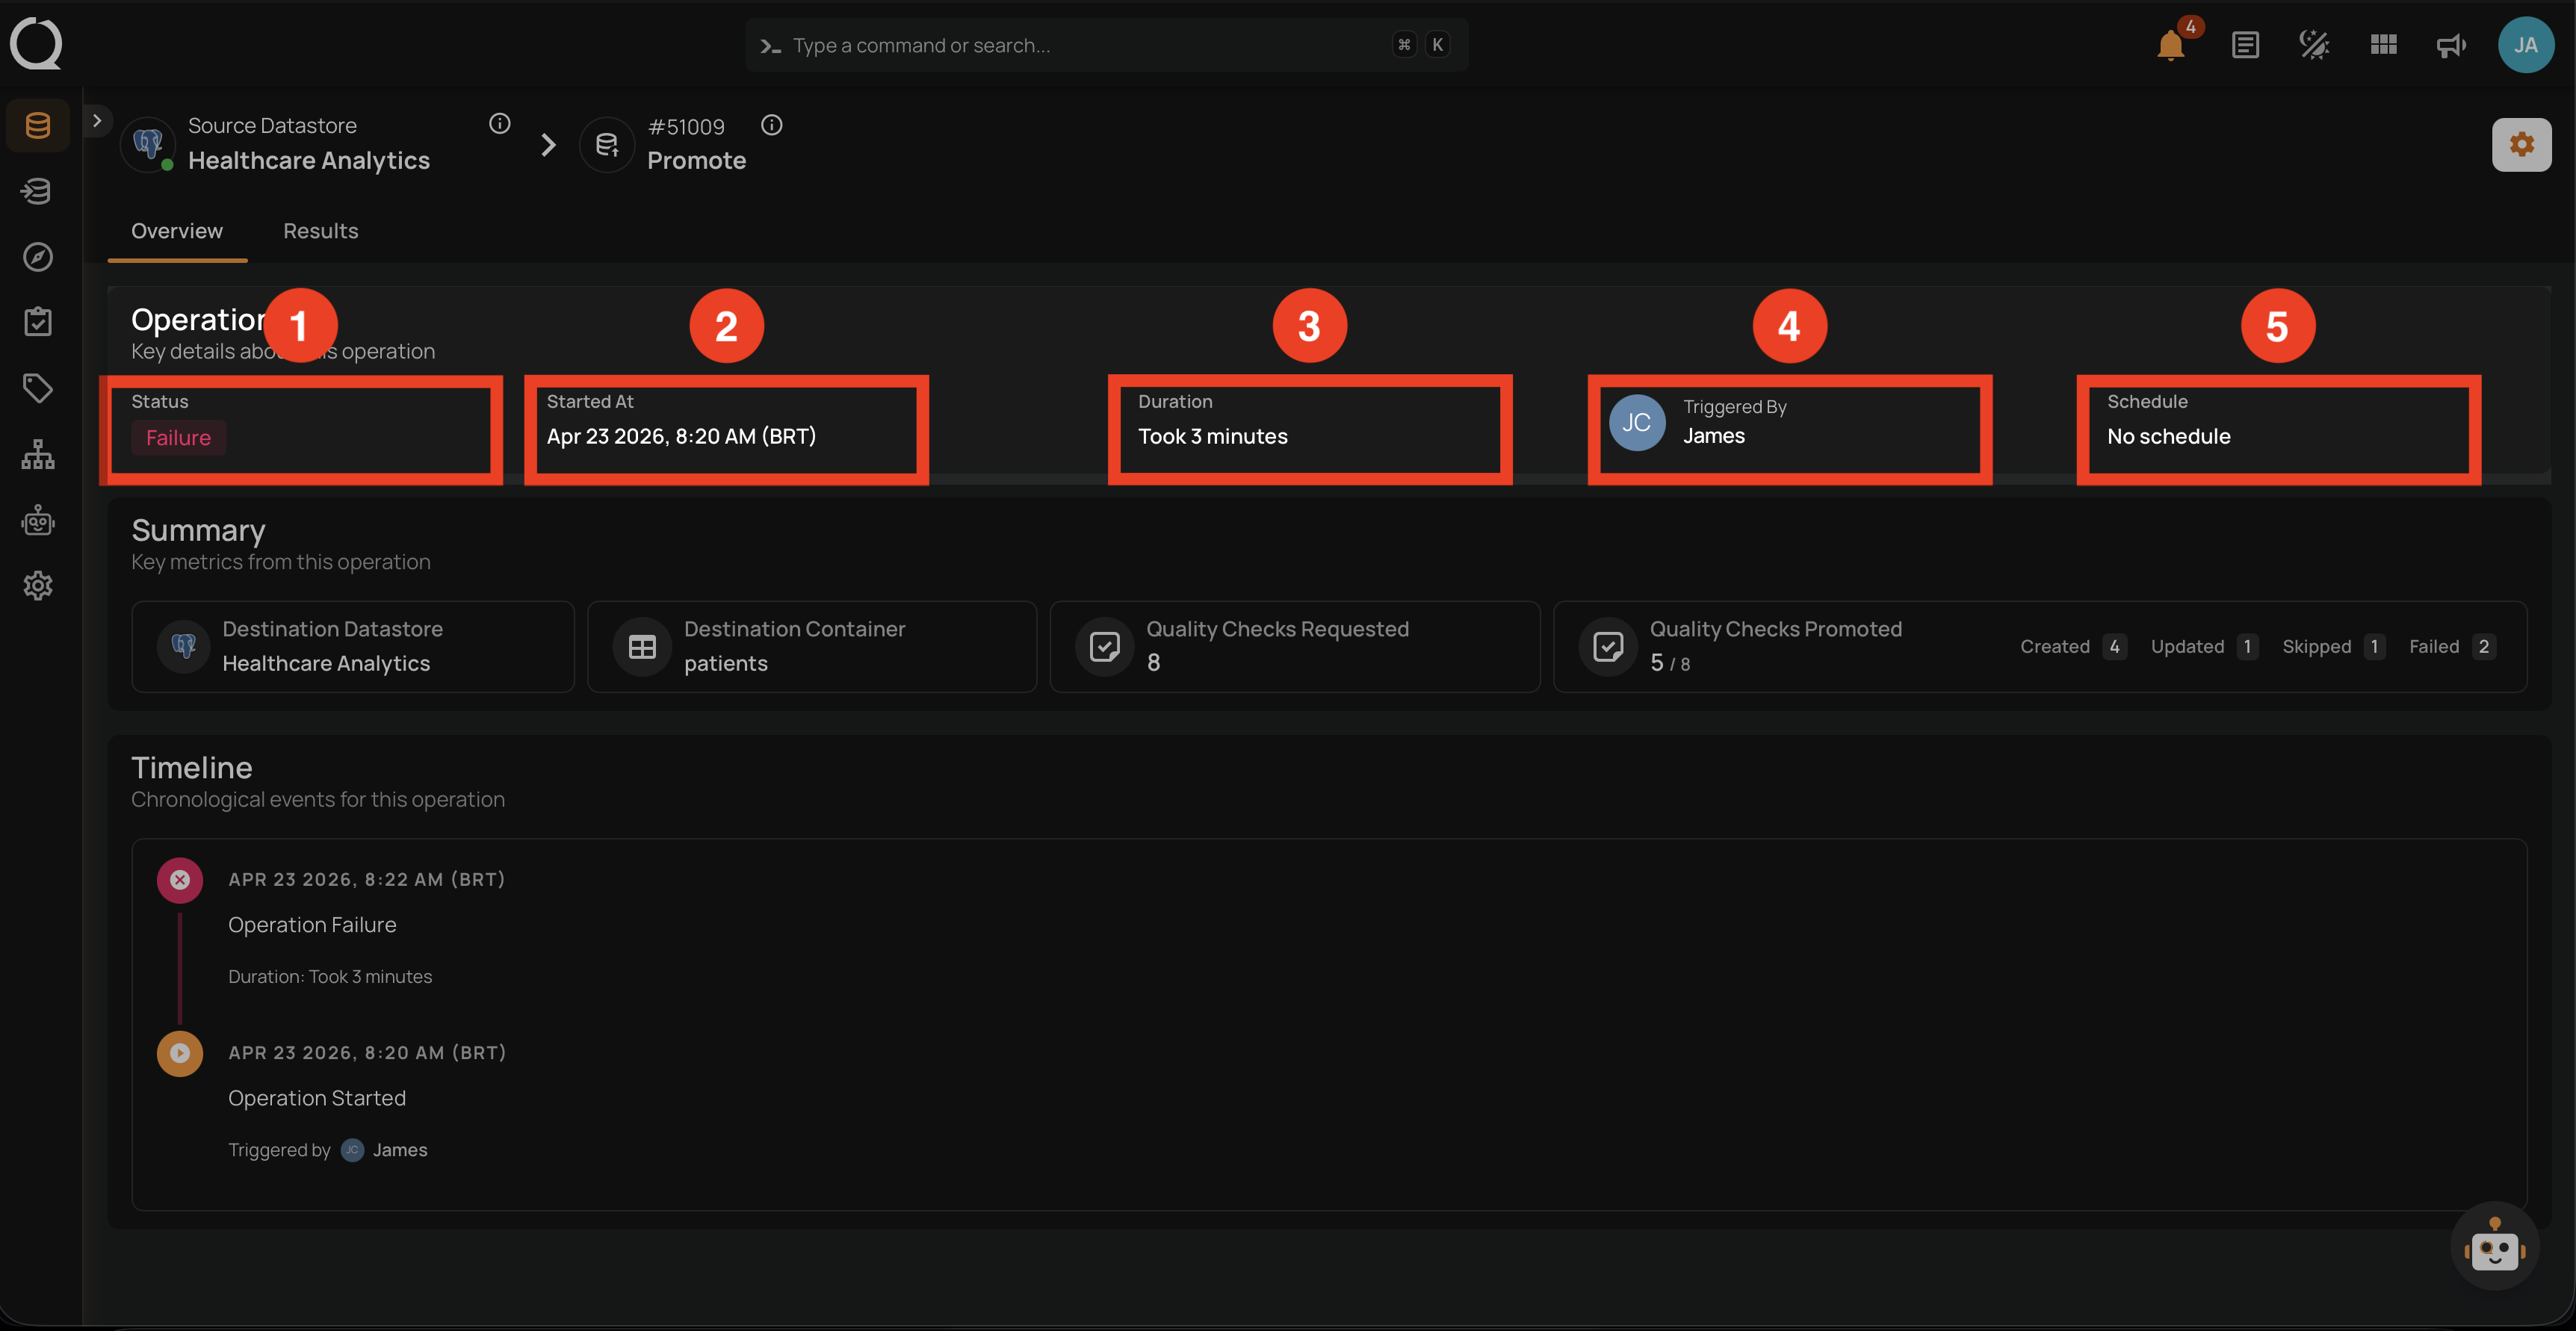
Operation Panel
Shows the high-level metadata of the run.
| REF. | FIELD | DESCRIPTION |
|---|---|---|
| 1 | Status | Overall result of the operation: Success, Failure, In Progress, or Aborted. |
| 2 | Started At | Timestamp when the operation began (shown in the viewer's timezone). |
| 3 | Duration | How long the operation took to complete. |
| 4 | Triggered By | The user who initiated the promotion. |
| 5 | Schedule | The schedule that triggered the operation, or No schedule when it was launched manually. |
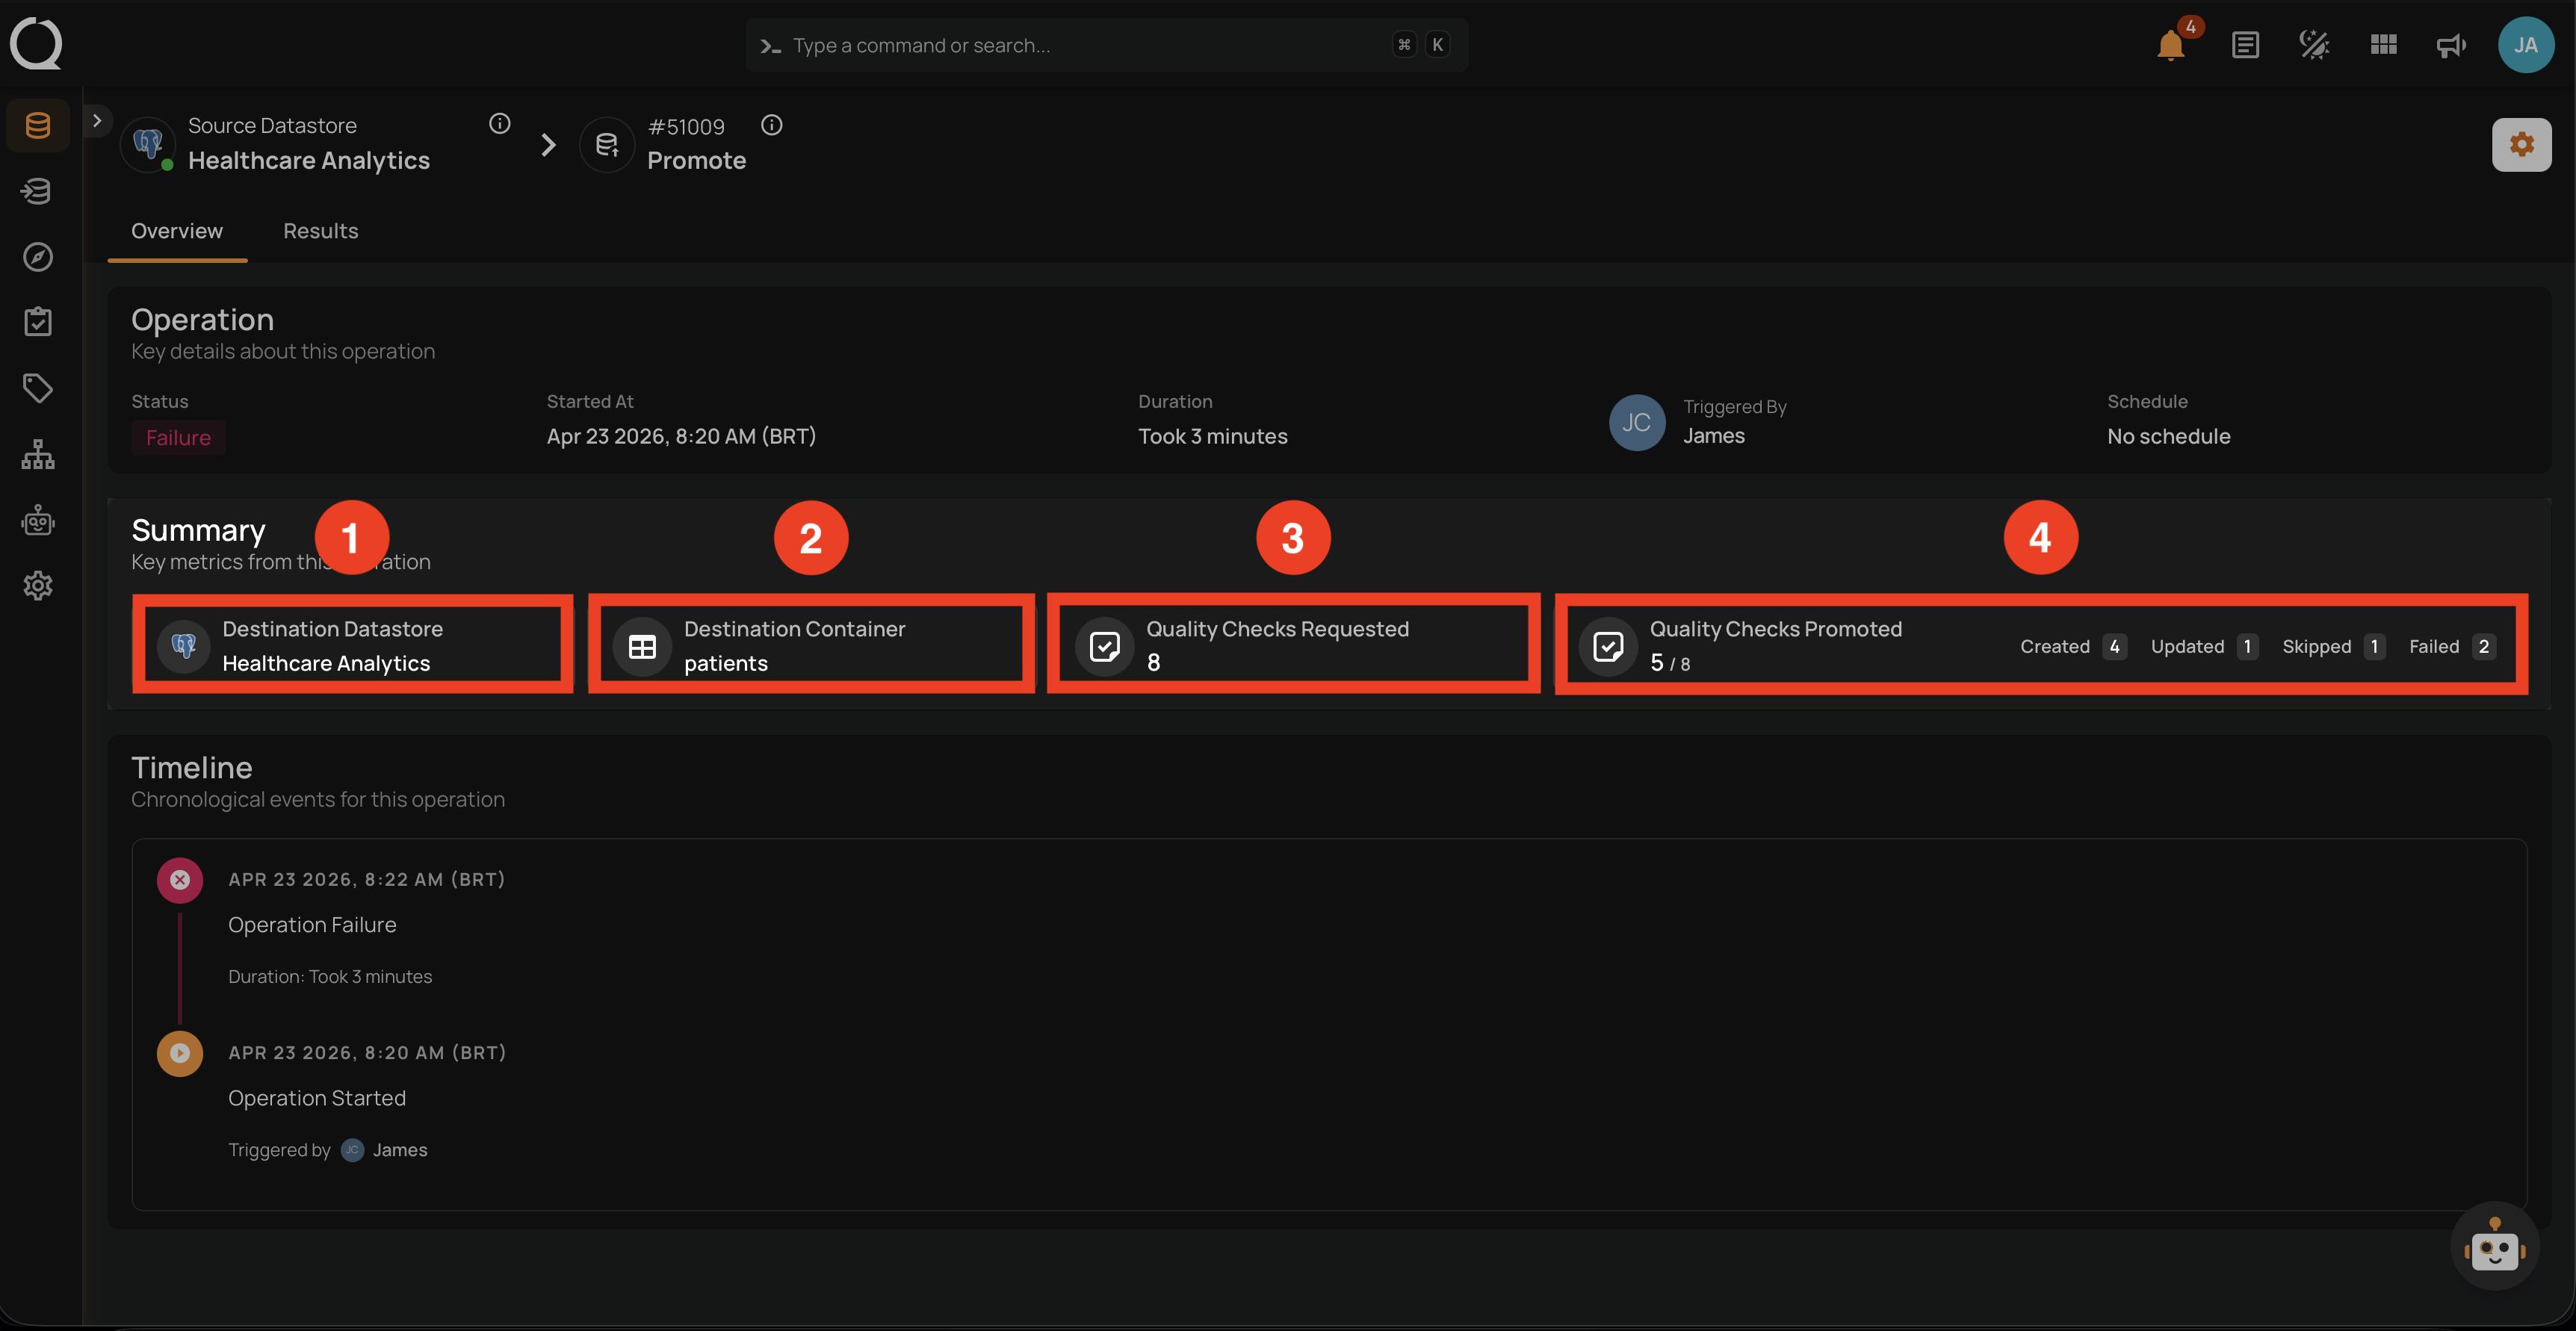
Summary Panel
Shows the destination scope and the per-entity counts.
| REF. | FIELD | DESCRIPTION |
|---|---|---|
| 1 | Destination Datastore | The datastore that received the promoted entities. |
| 2 | Destination Container | The container that received the entities (for quality checks and computed fields). For computed tables and files, this slot reflects the destination scope at the datastore level. |
| 3 | Quality Checks Requested | Total entities included in the operation. The label changes with the promote type (Computed Fields Requested, Computed Tables Requested, Computed Files Requested). |
| 4 | Quality Checks Promoted | Number of entities that landed at the destination, with a breakdown by result: Created, Updated, Skipped, and Failed. The label changes with the promote type. |
Timeline Panel
Lists the events of the operation in chronological order: when it started, when it succeeded or failed, and any intermediate checkpoints. Use this to understand sequencing and to correlate with logs in other tooling.
Results Tab
The Results tab shows the per-entity outcome of the promotion. Use it to verify what happened to each individual quality check, computed field, computed table, or computed file.
Source and Destination
Below the operation header, a bar shows the source and destination tables involved in the promotion, each with its datastore logo. This is where you confirm at a glance which container or datastore the entities were promoted from and where they landed.
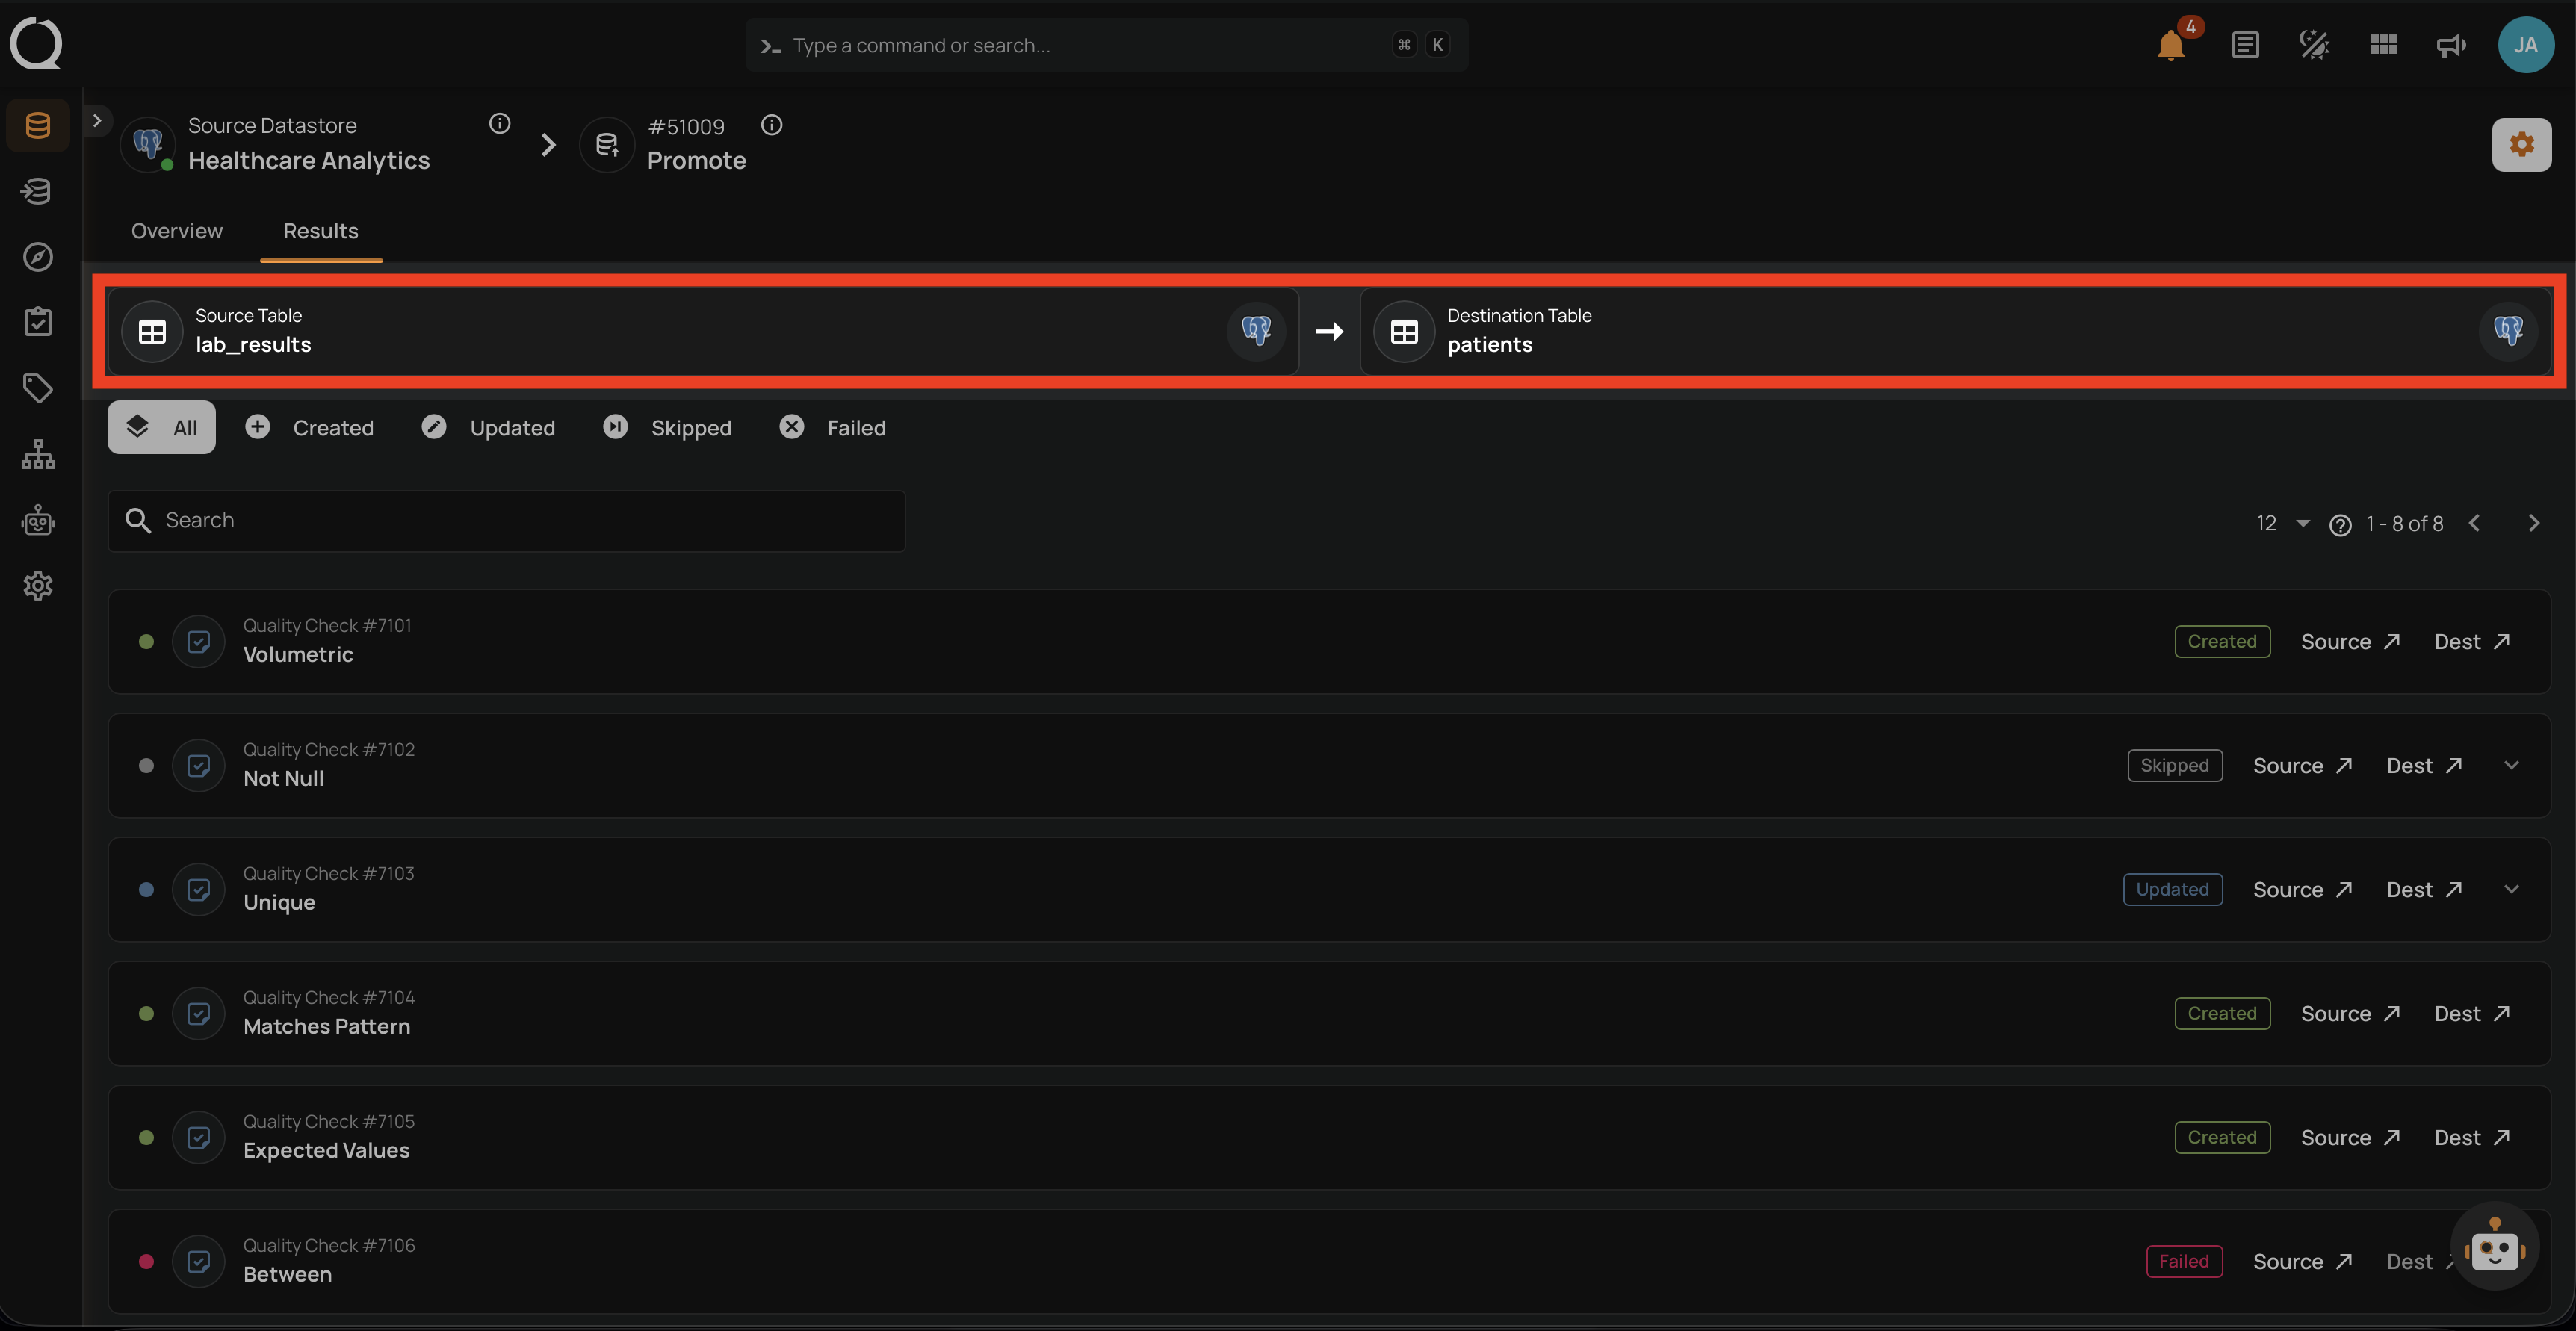
What appears in this bar depends on the promote type:
- For quality checks and computed fields: the source container and the destination container.
- For computed tables and computed files: the source datastore and the destination datastore.
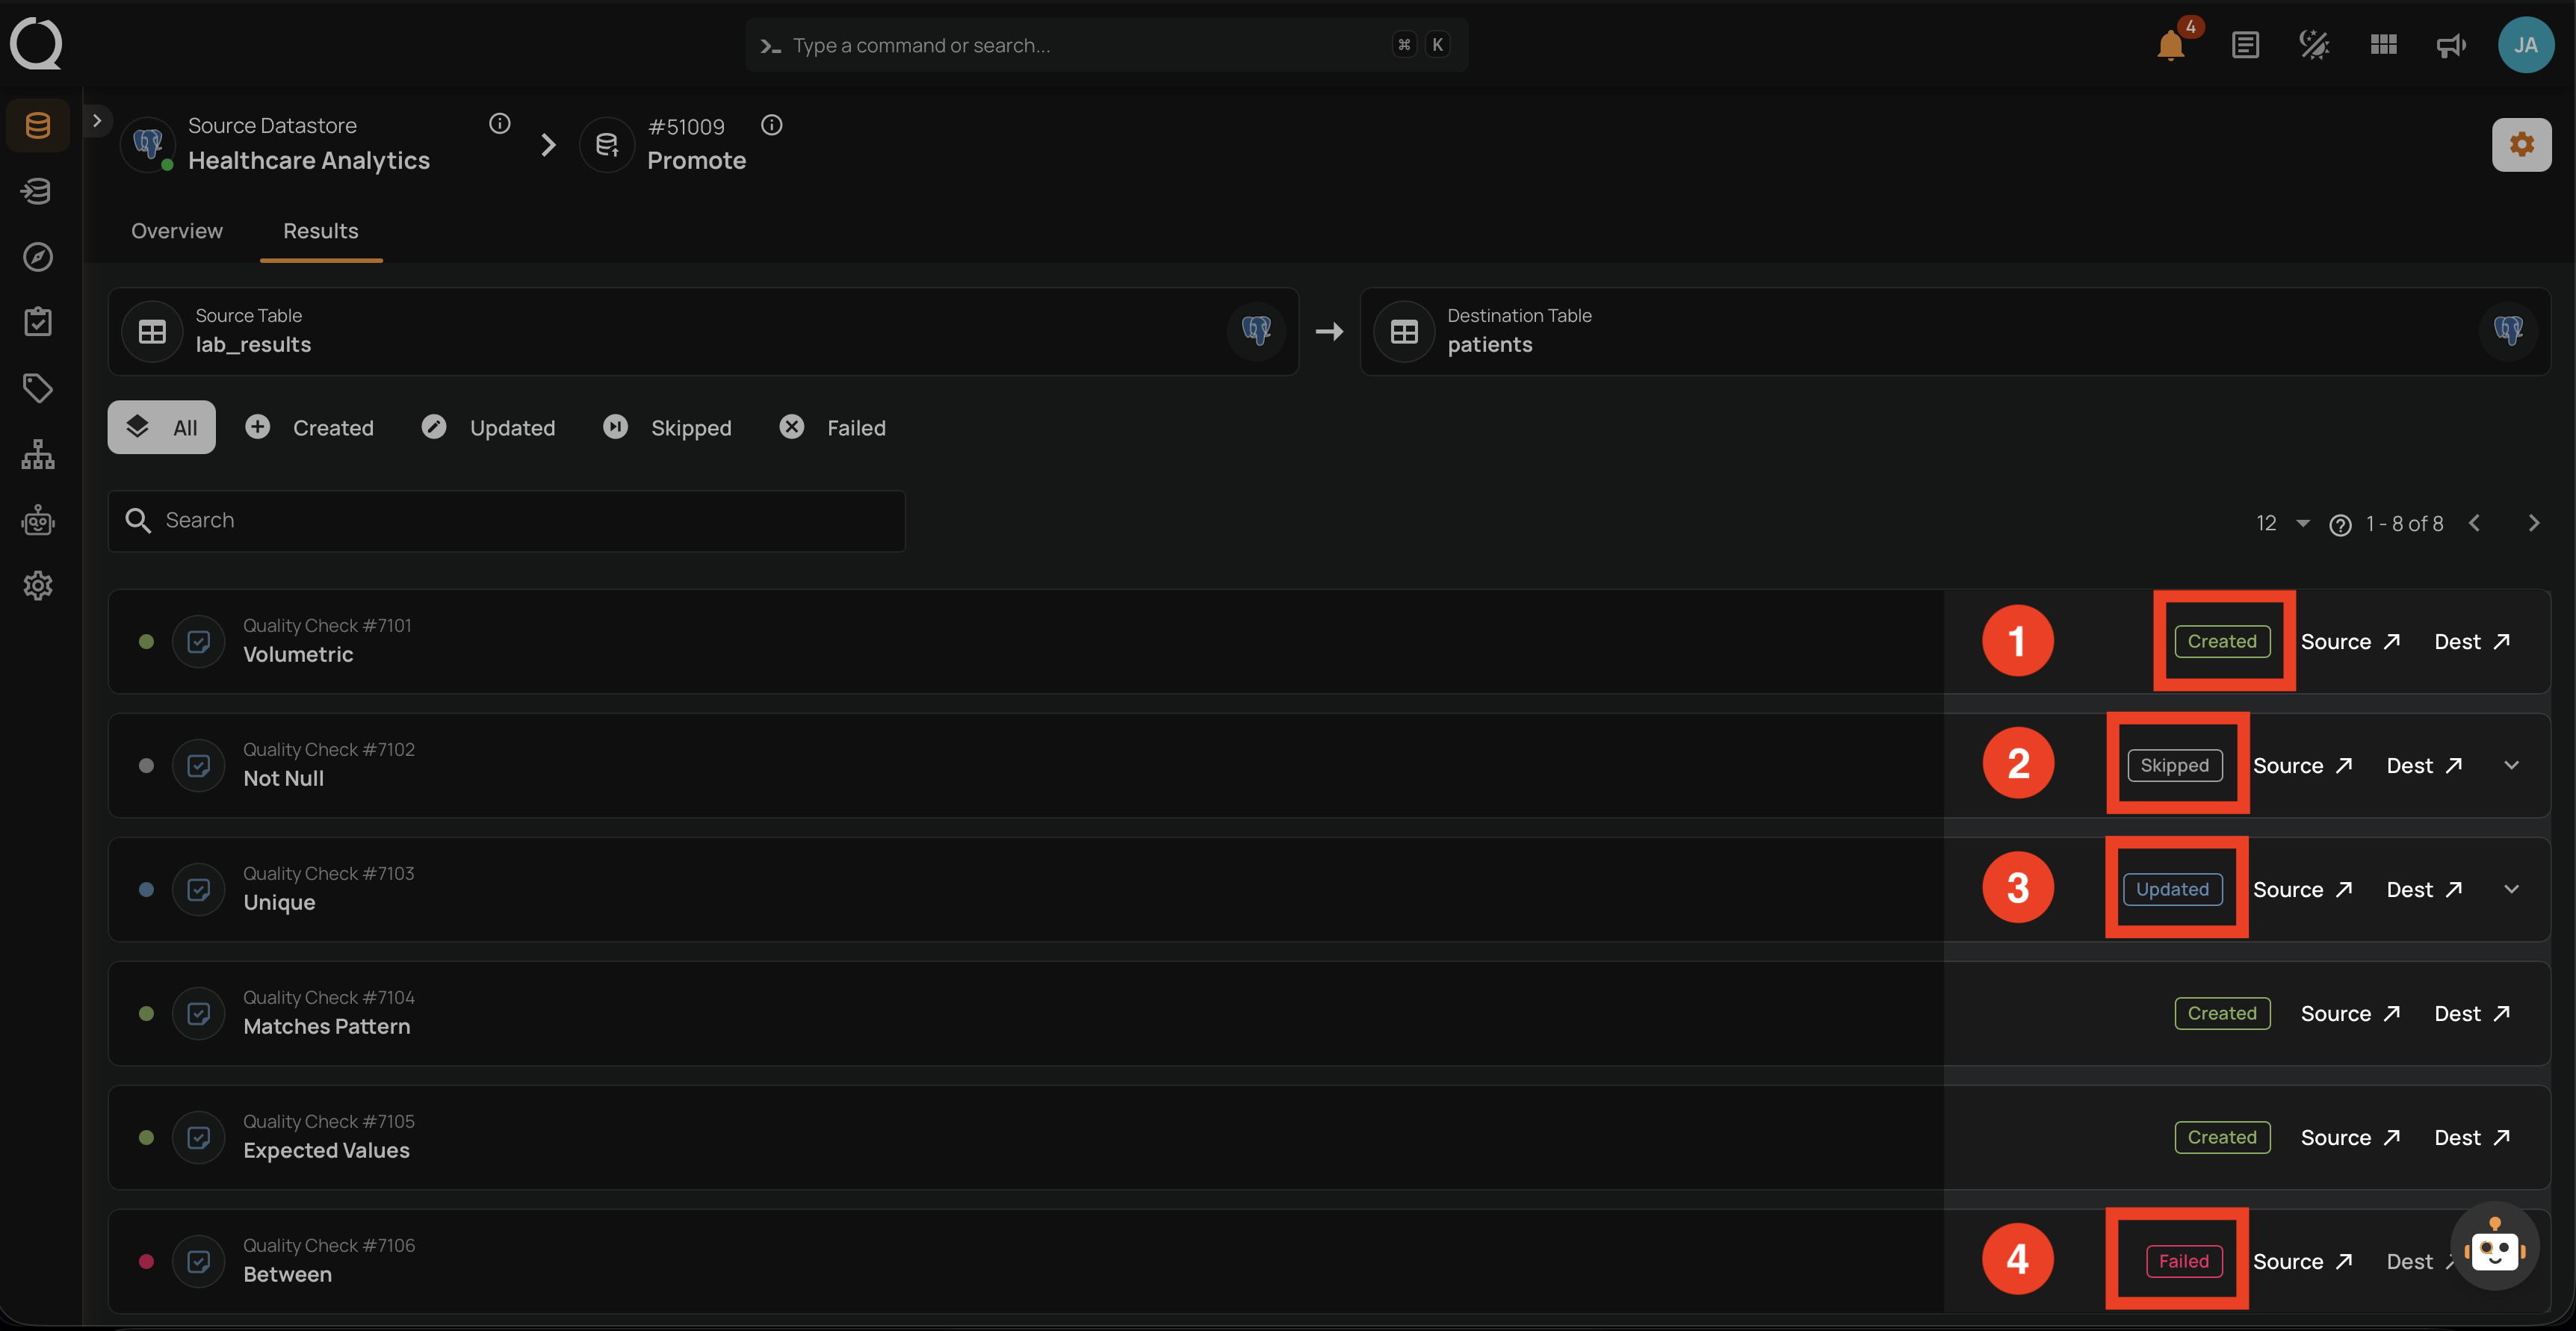
Status Indicators
Each row in the entity list displays a status badge that matches the operation breakdown.
| REF. | BADGE | DESCRIPTION |
|---|---|---|
| 1 | Created | A new entity was created at the destination. |
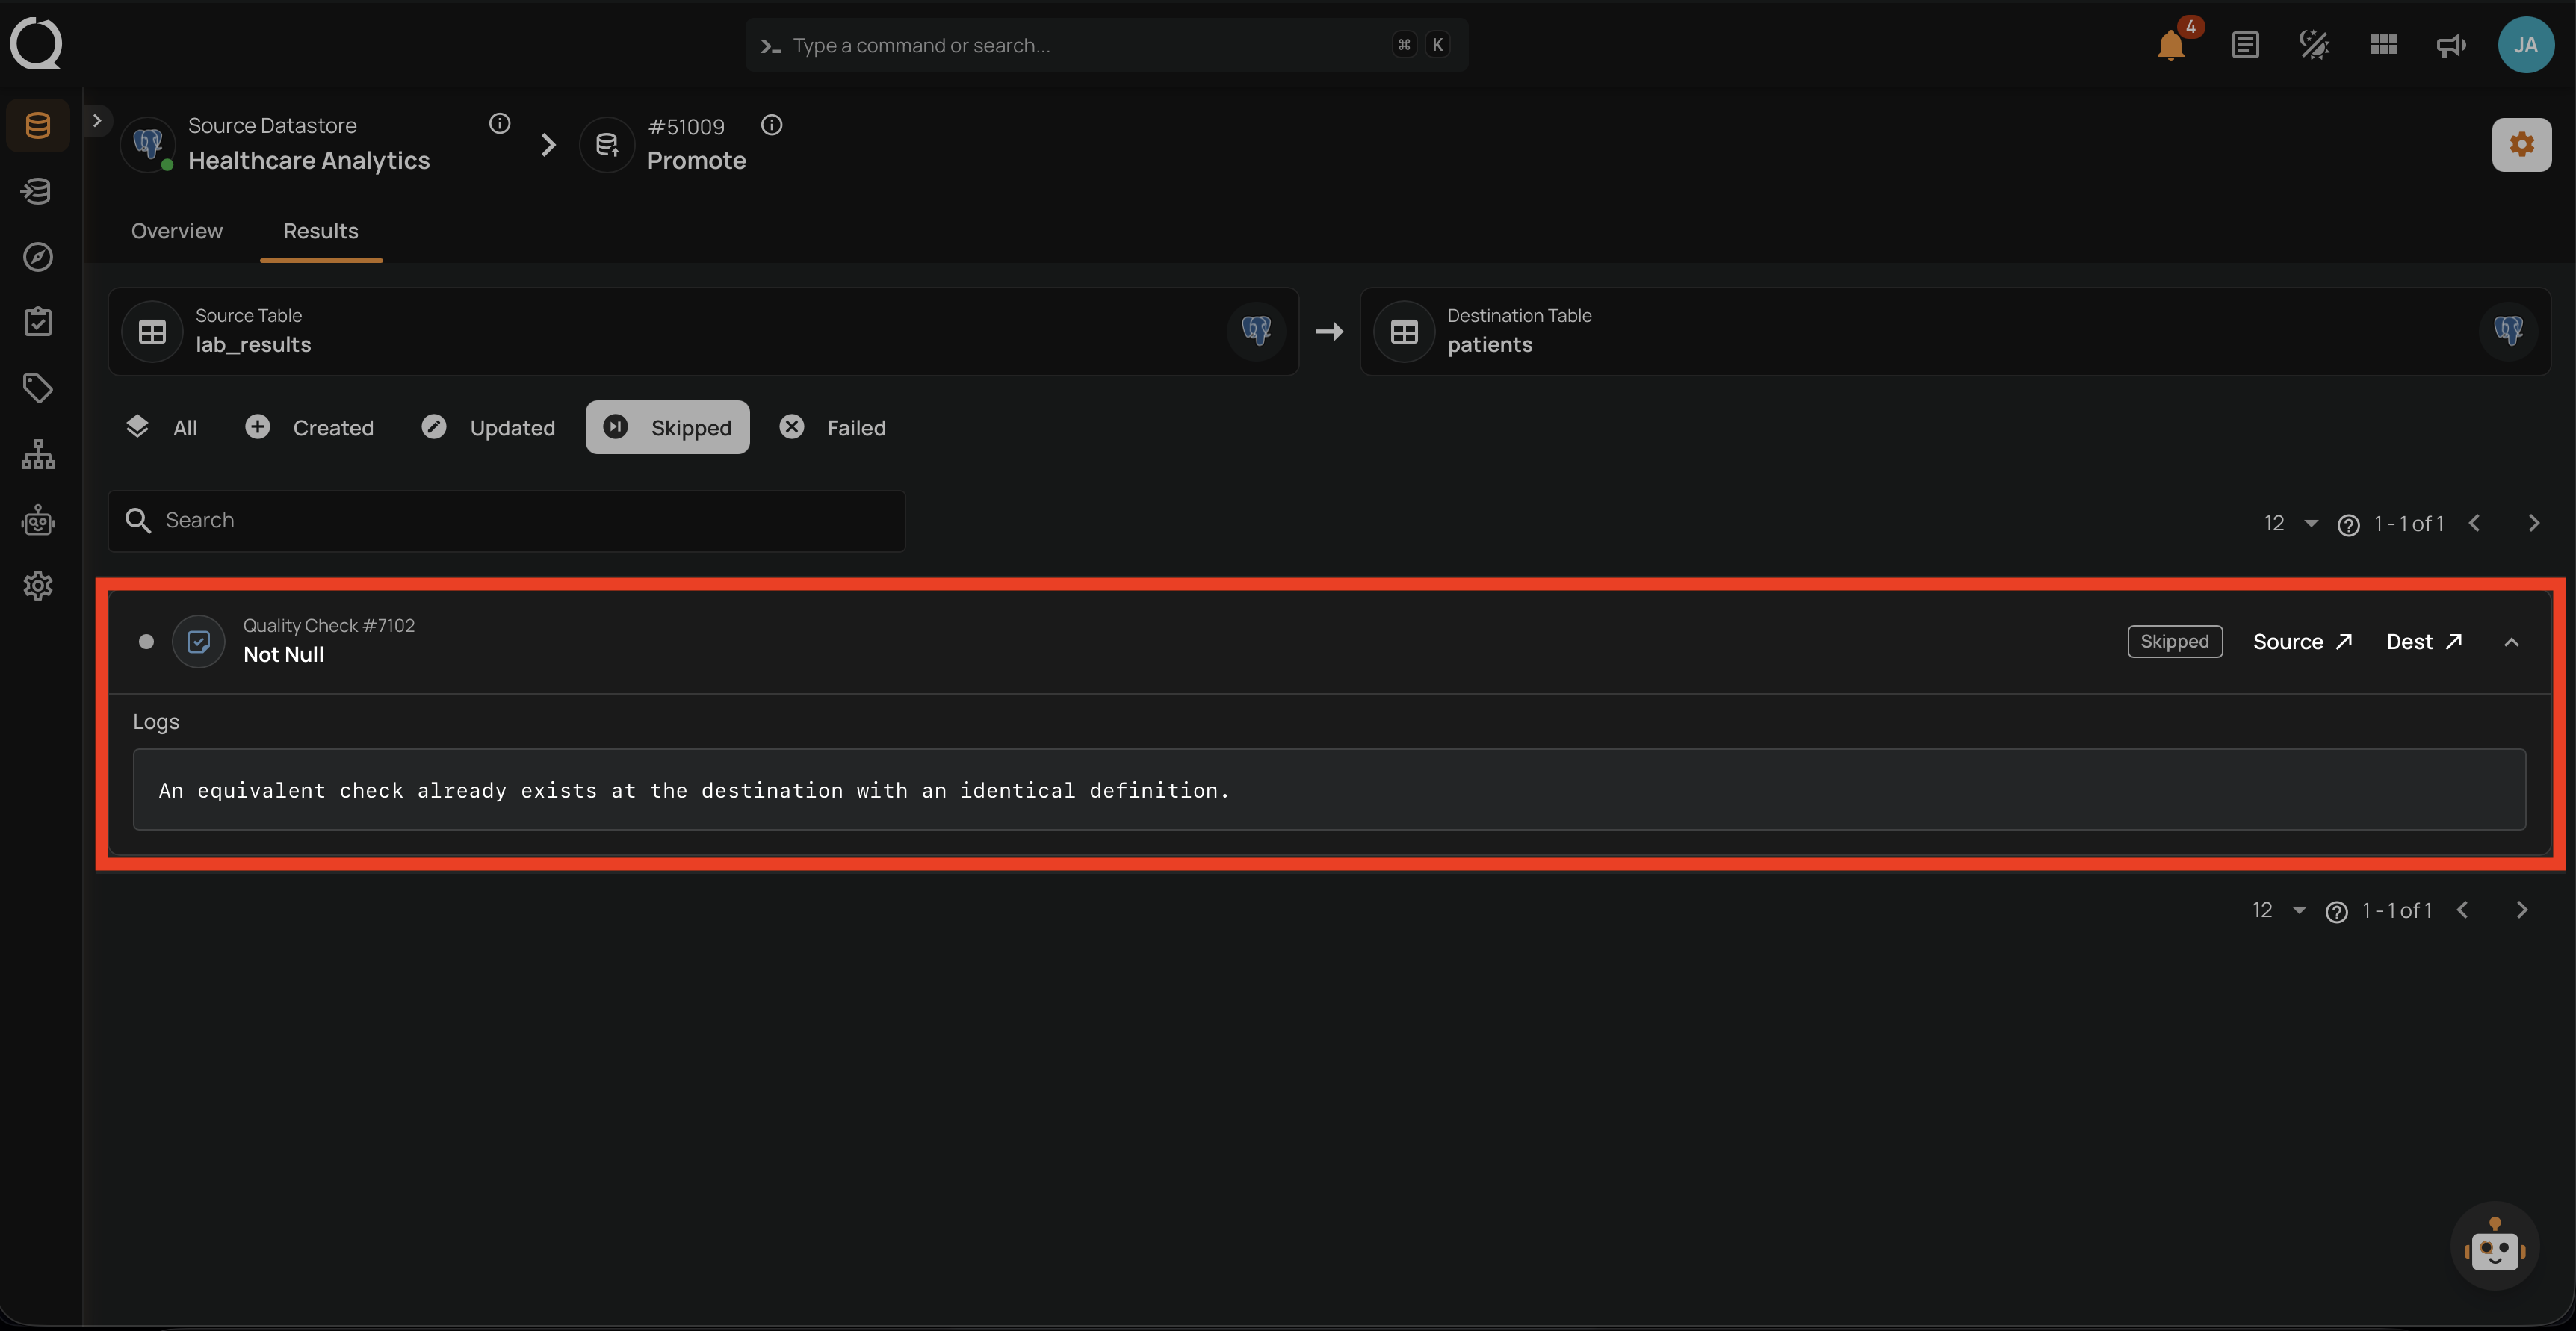
| 2 | Skipped | An equivalent entity already exists at the destination with an identical definition. |
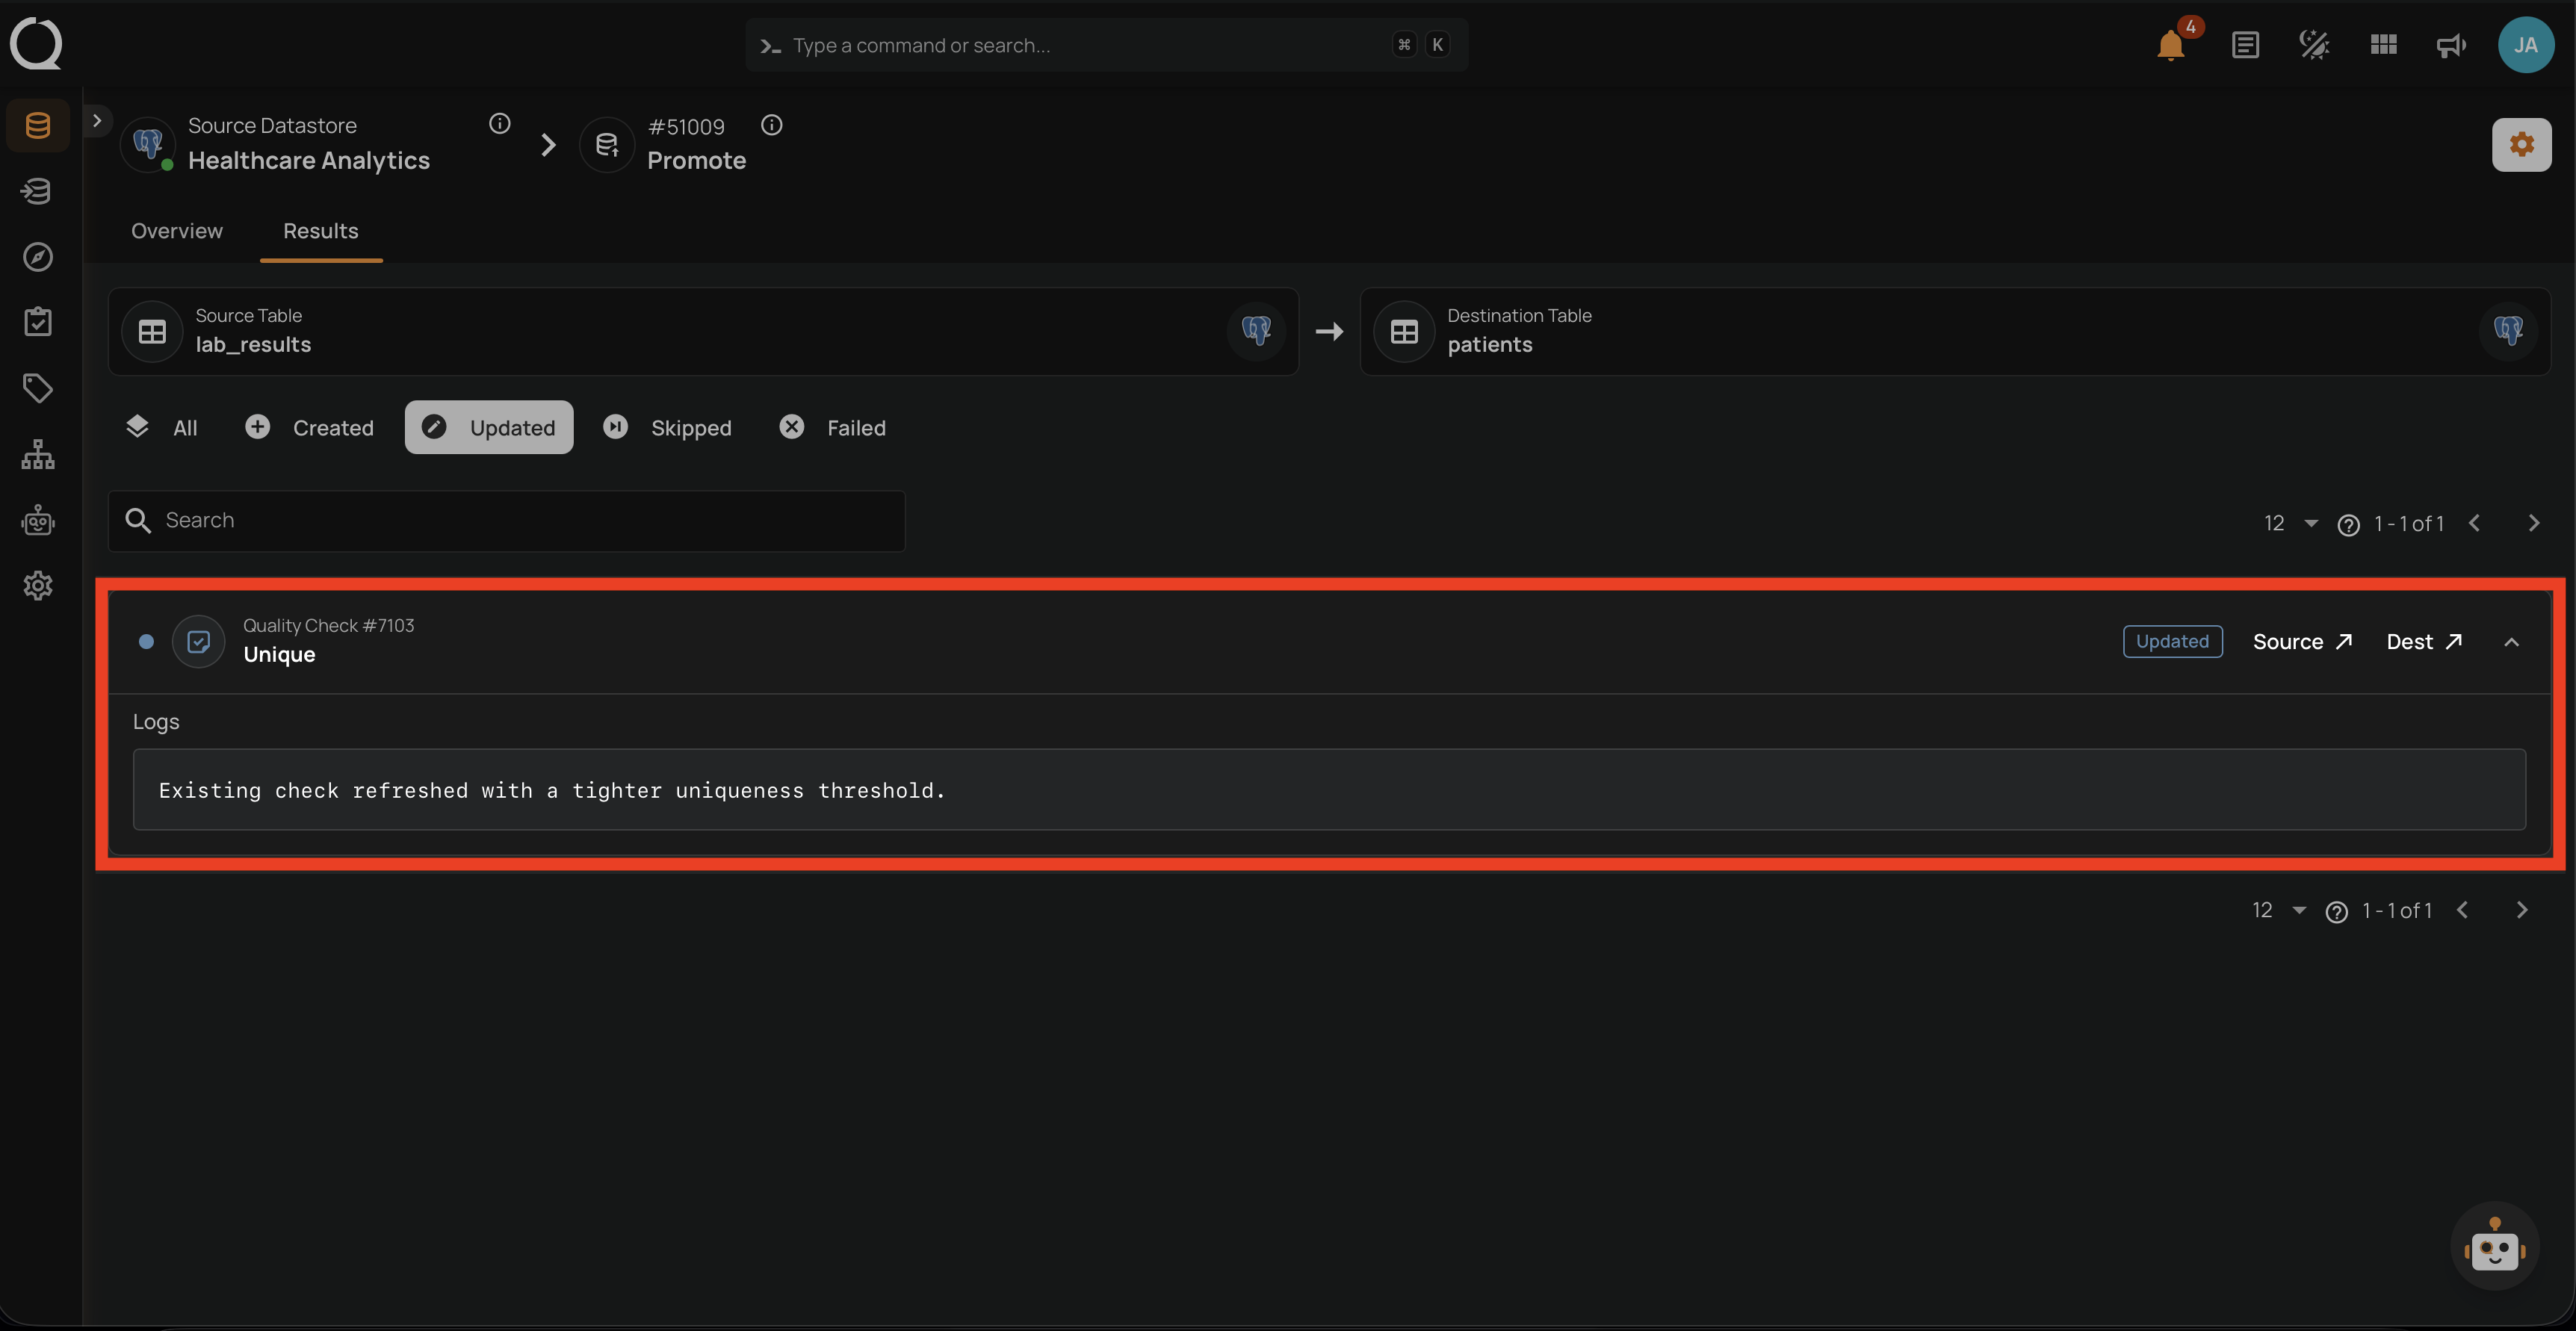
| 3 | Updated | The matching destination entity was updated with the new source definition. |
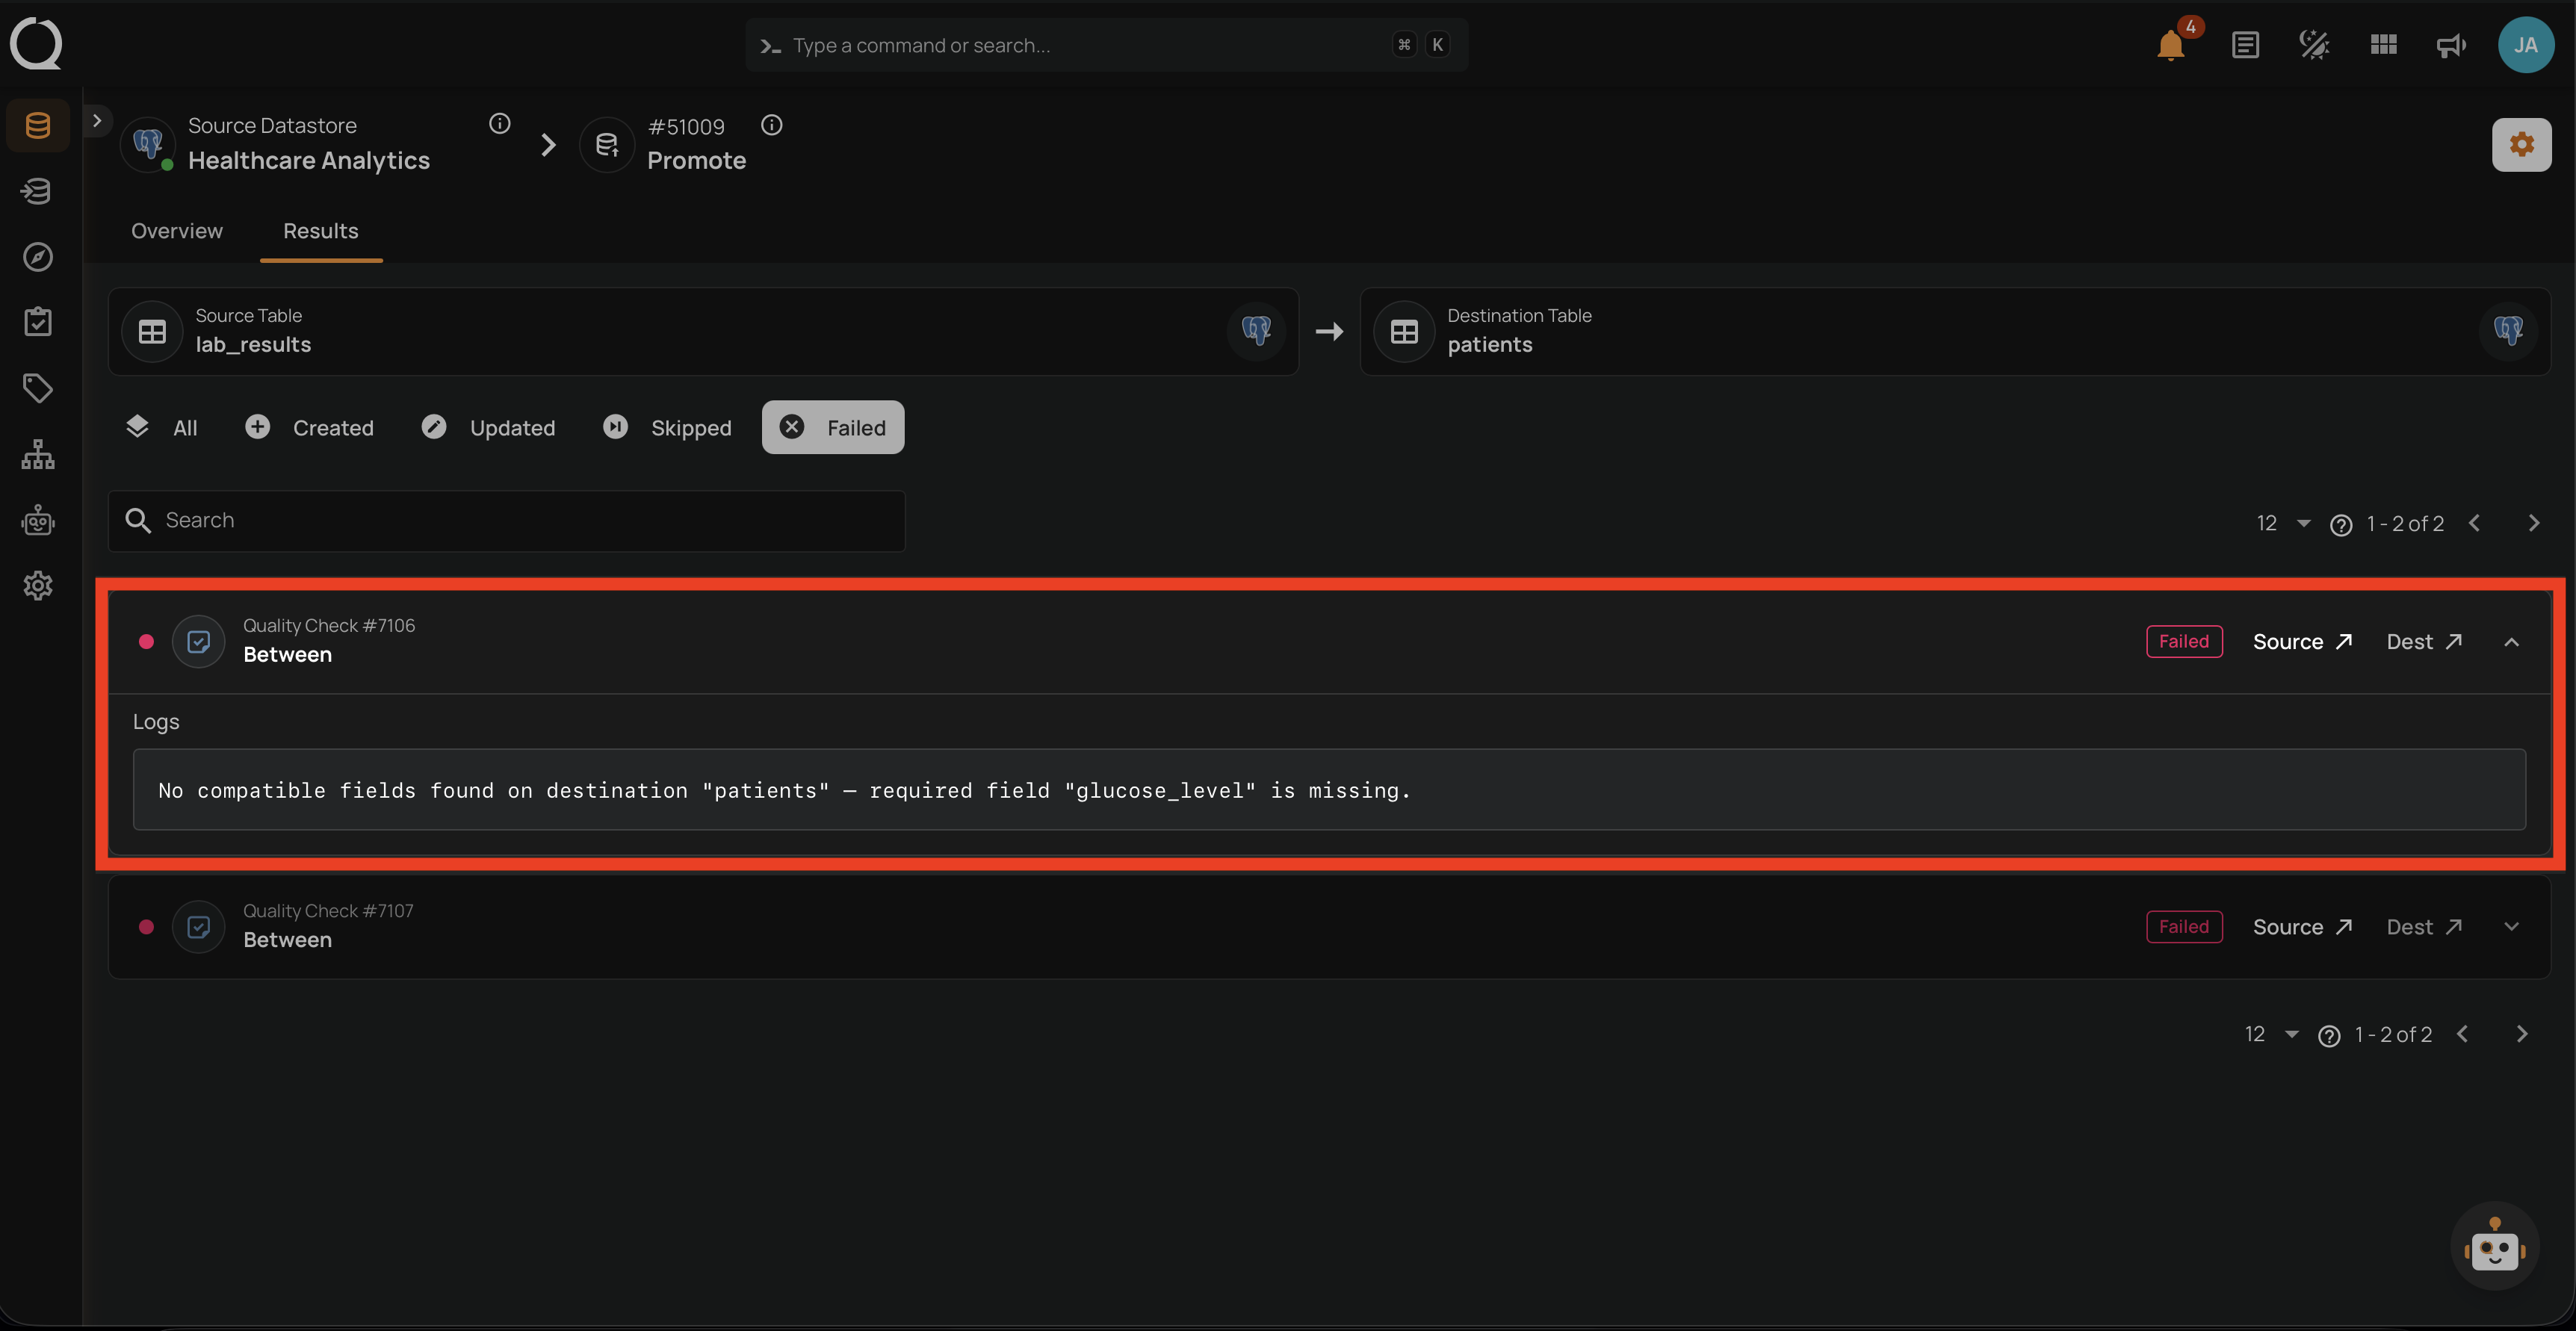
| 4 | Failed | The entity could not be promoted. Expand the row to see the error log. |
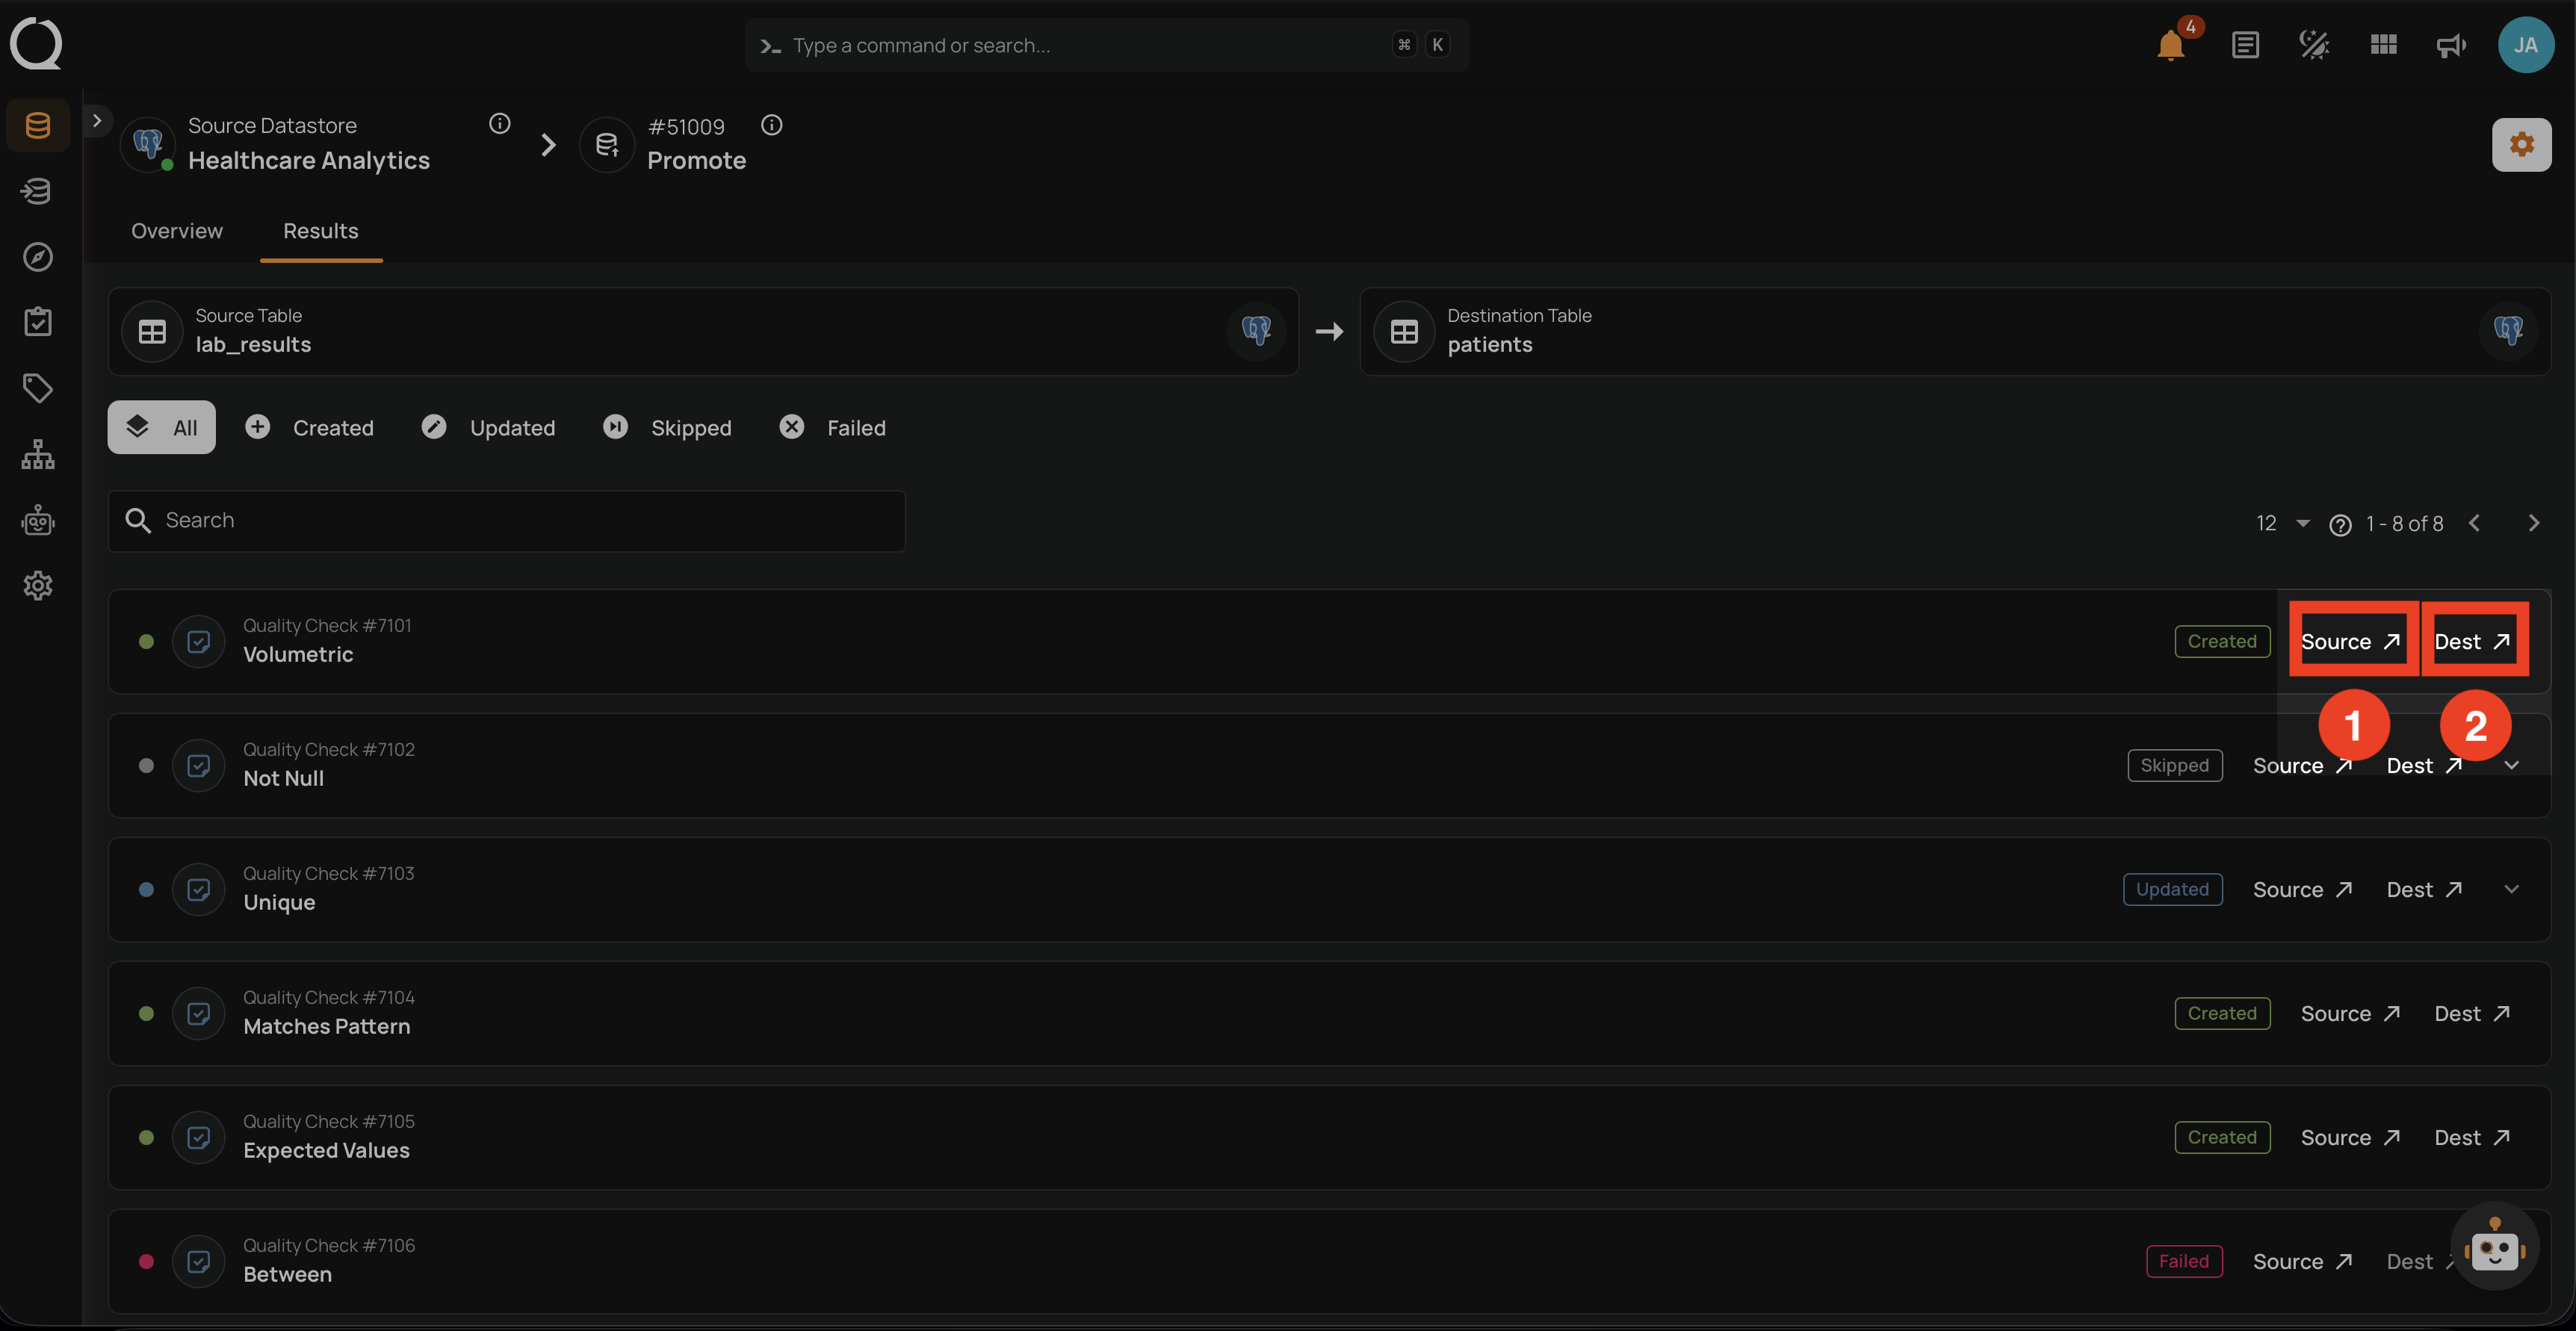
Entity Actions
Each row exposes navigation links to the underlying source and destination entities.
| REF. | ACTION | DESCRIPTION |
|---|---|---|
| 1 | Source ↗ | Opens the source entity detail page in a new tab. Not shown for rows where the source has been deleted since the promotion (see Deleted Source Entities). |
| 2 | Dest ↗ | Opens the destination entity detail page in a new tab. Disabled when the entity was skipped without a destination link. |
Result Logs
Each row can be expanded to view the per-entity log. The log includes the message returned by the platform, which helps you understand skipped, updated, and failed outcomes.
For updated entities, the log explains what changed at the destination.
For skipped entities, the log explains that an equivalent destination entity already exists.
For failed entities, the log includes the error message returned by the platform.
Common error messages include:
| Error | Cause |
|---|---|
| No compatible fields found | The destination container does not have fields matching the check's field references |
| Name collision with existing field | A non-computed field with the same name already exists at the destination |
| Source fields not found or excluded | Required source fields for a computed field are missing or excluded at the destination |
| Validation failed | An active check could not be validated against the destination container |
Filtering Results
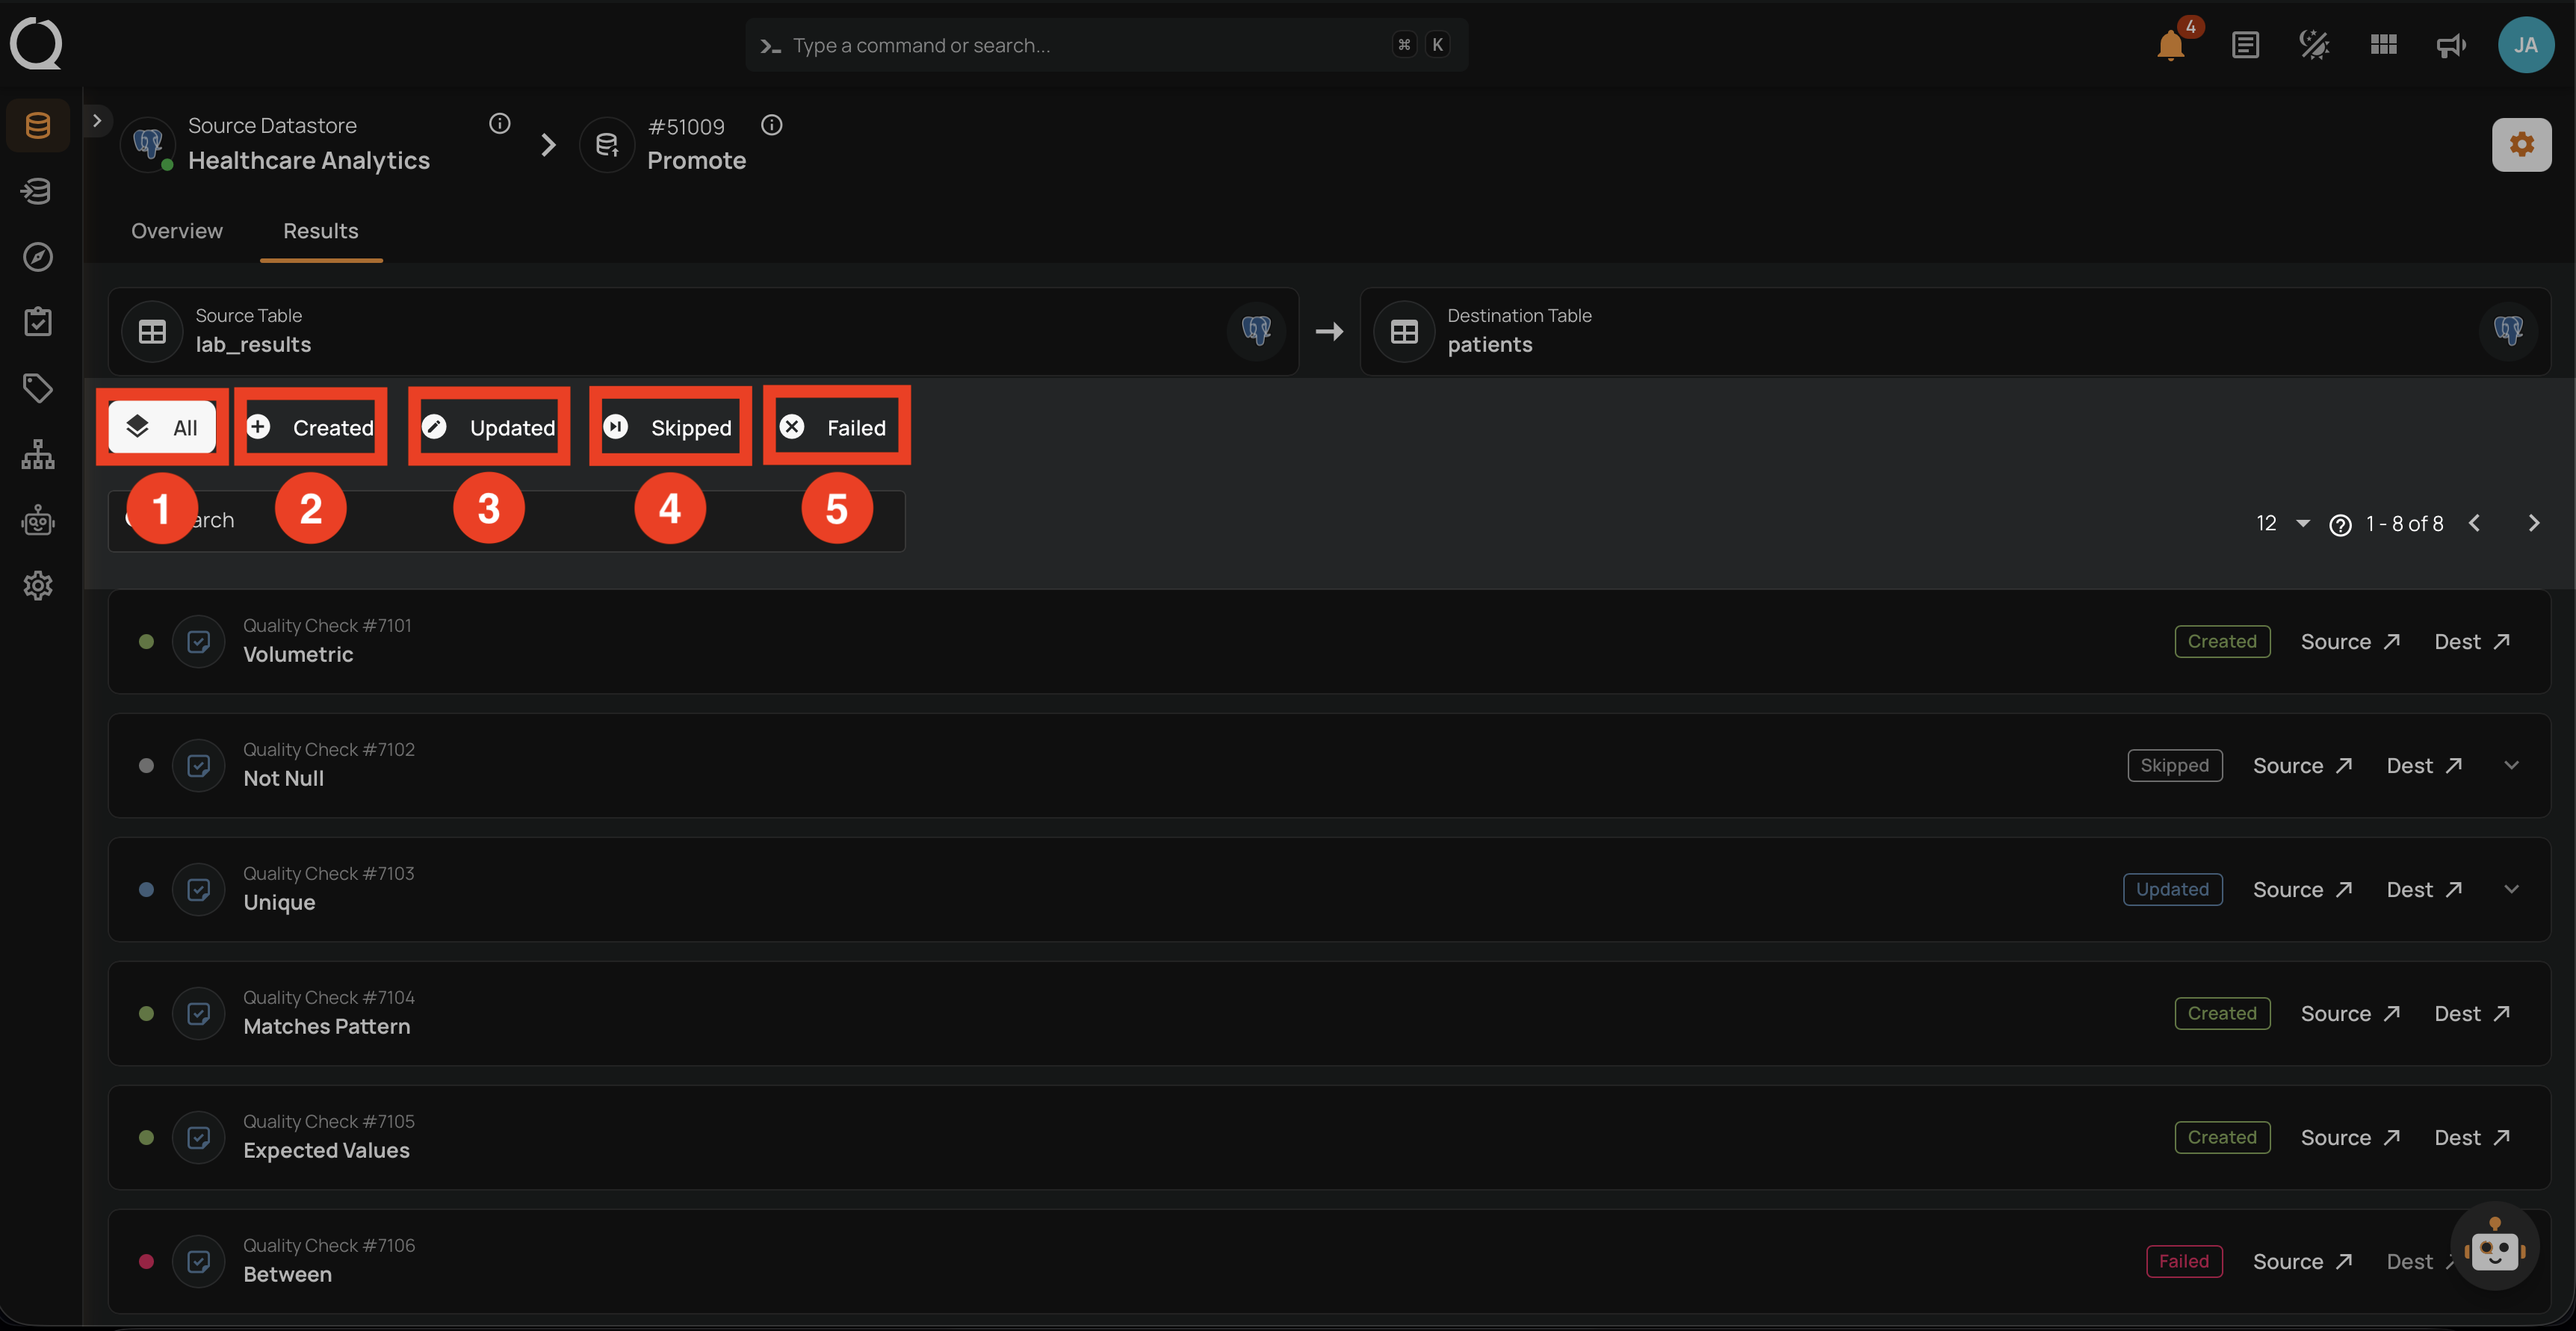
Use the filter tabs above the entity list to narrow results by status, or the search field to find a specific entity.
| REF. | TAB | DESCRIPTION |
|---|---|---|
| 1 | All | Shows every entity in the operation. |
| 2 | Created | Shows only entities created at the destination. |
| 3 | Updated | Shows only entities updated at the destination. |
| 4 | Skipped | Shows only entities skipped because the destination definition was identical. |
| 5 | Failed | Shows only entities that failed. Use this to triage errors quickly. |
Search
Use the search field to filter results by entity name or description. The search updates the list in real time with a short delay.
Pagination
Results are paginated. Use the page size selector to control how many results are shown per page, and the navigation controls to move between pages.
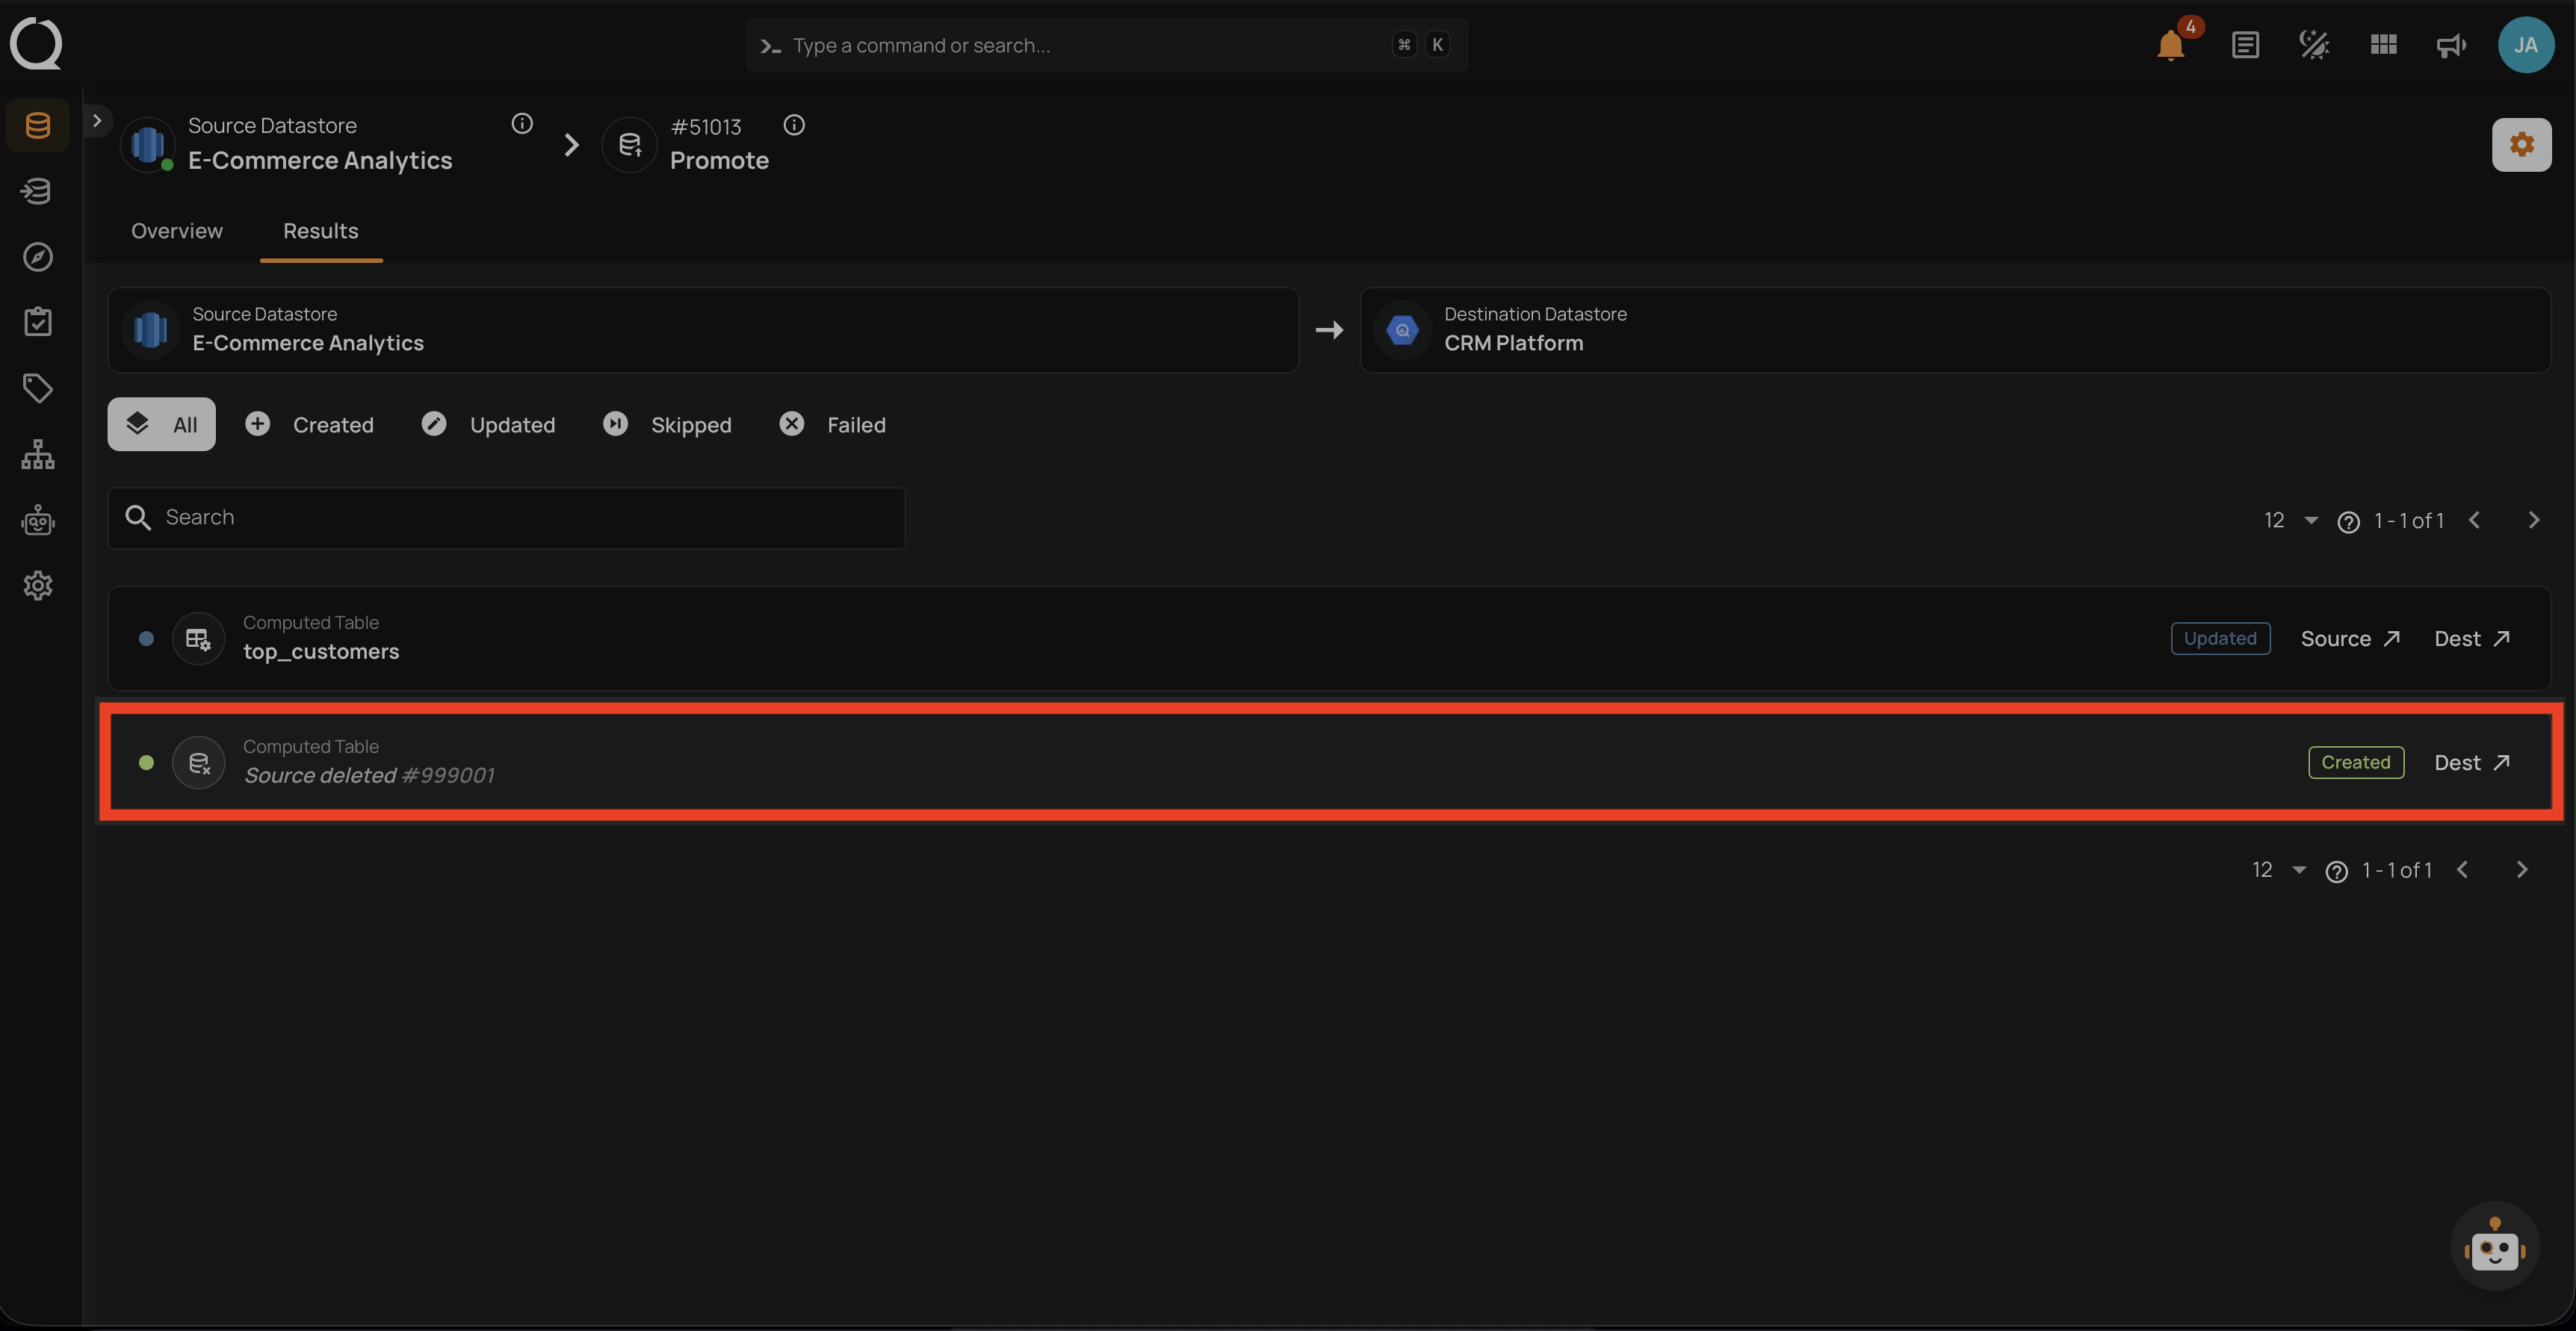
Deleted Source Entities
If a source entity has been deleted since the promotion, the results list shows a Source deleted indicator with the entity's original ID (e.g. Source deleted #999001) in italics in place of the entity name. Only the Dest ↗ button is shown on these rows, because the source entity no longer exists to link to.
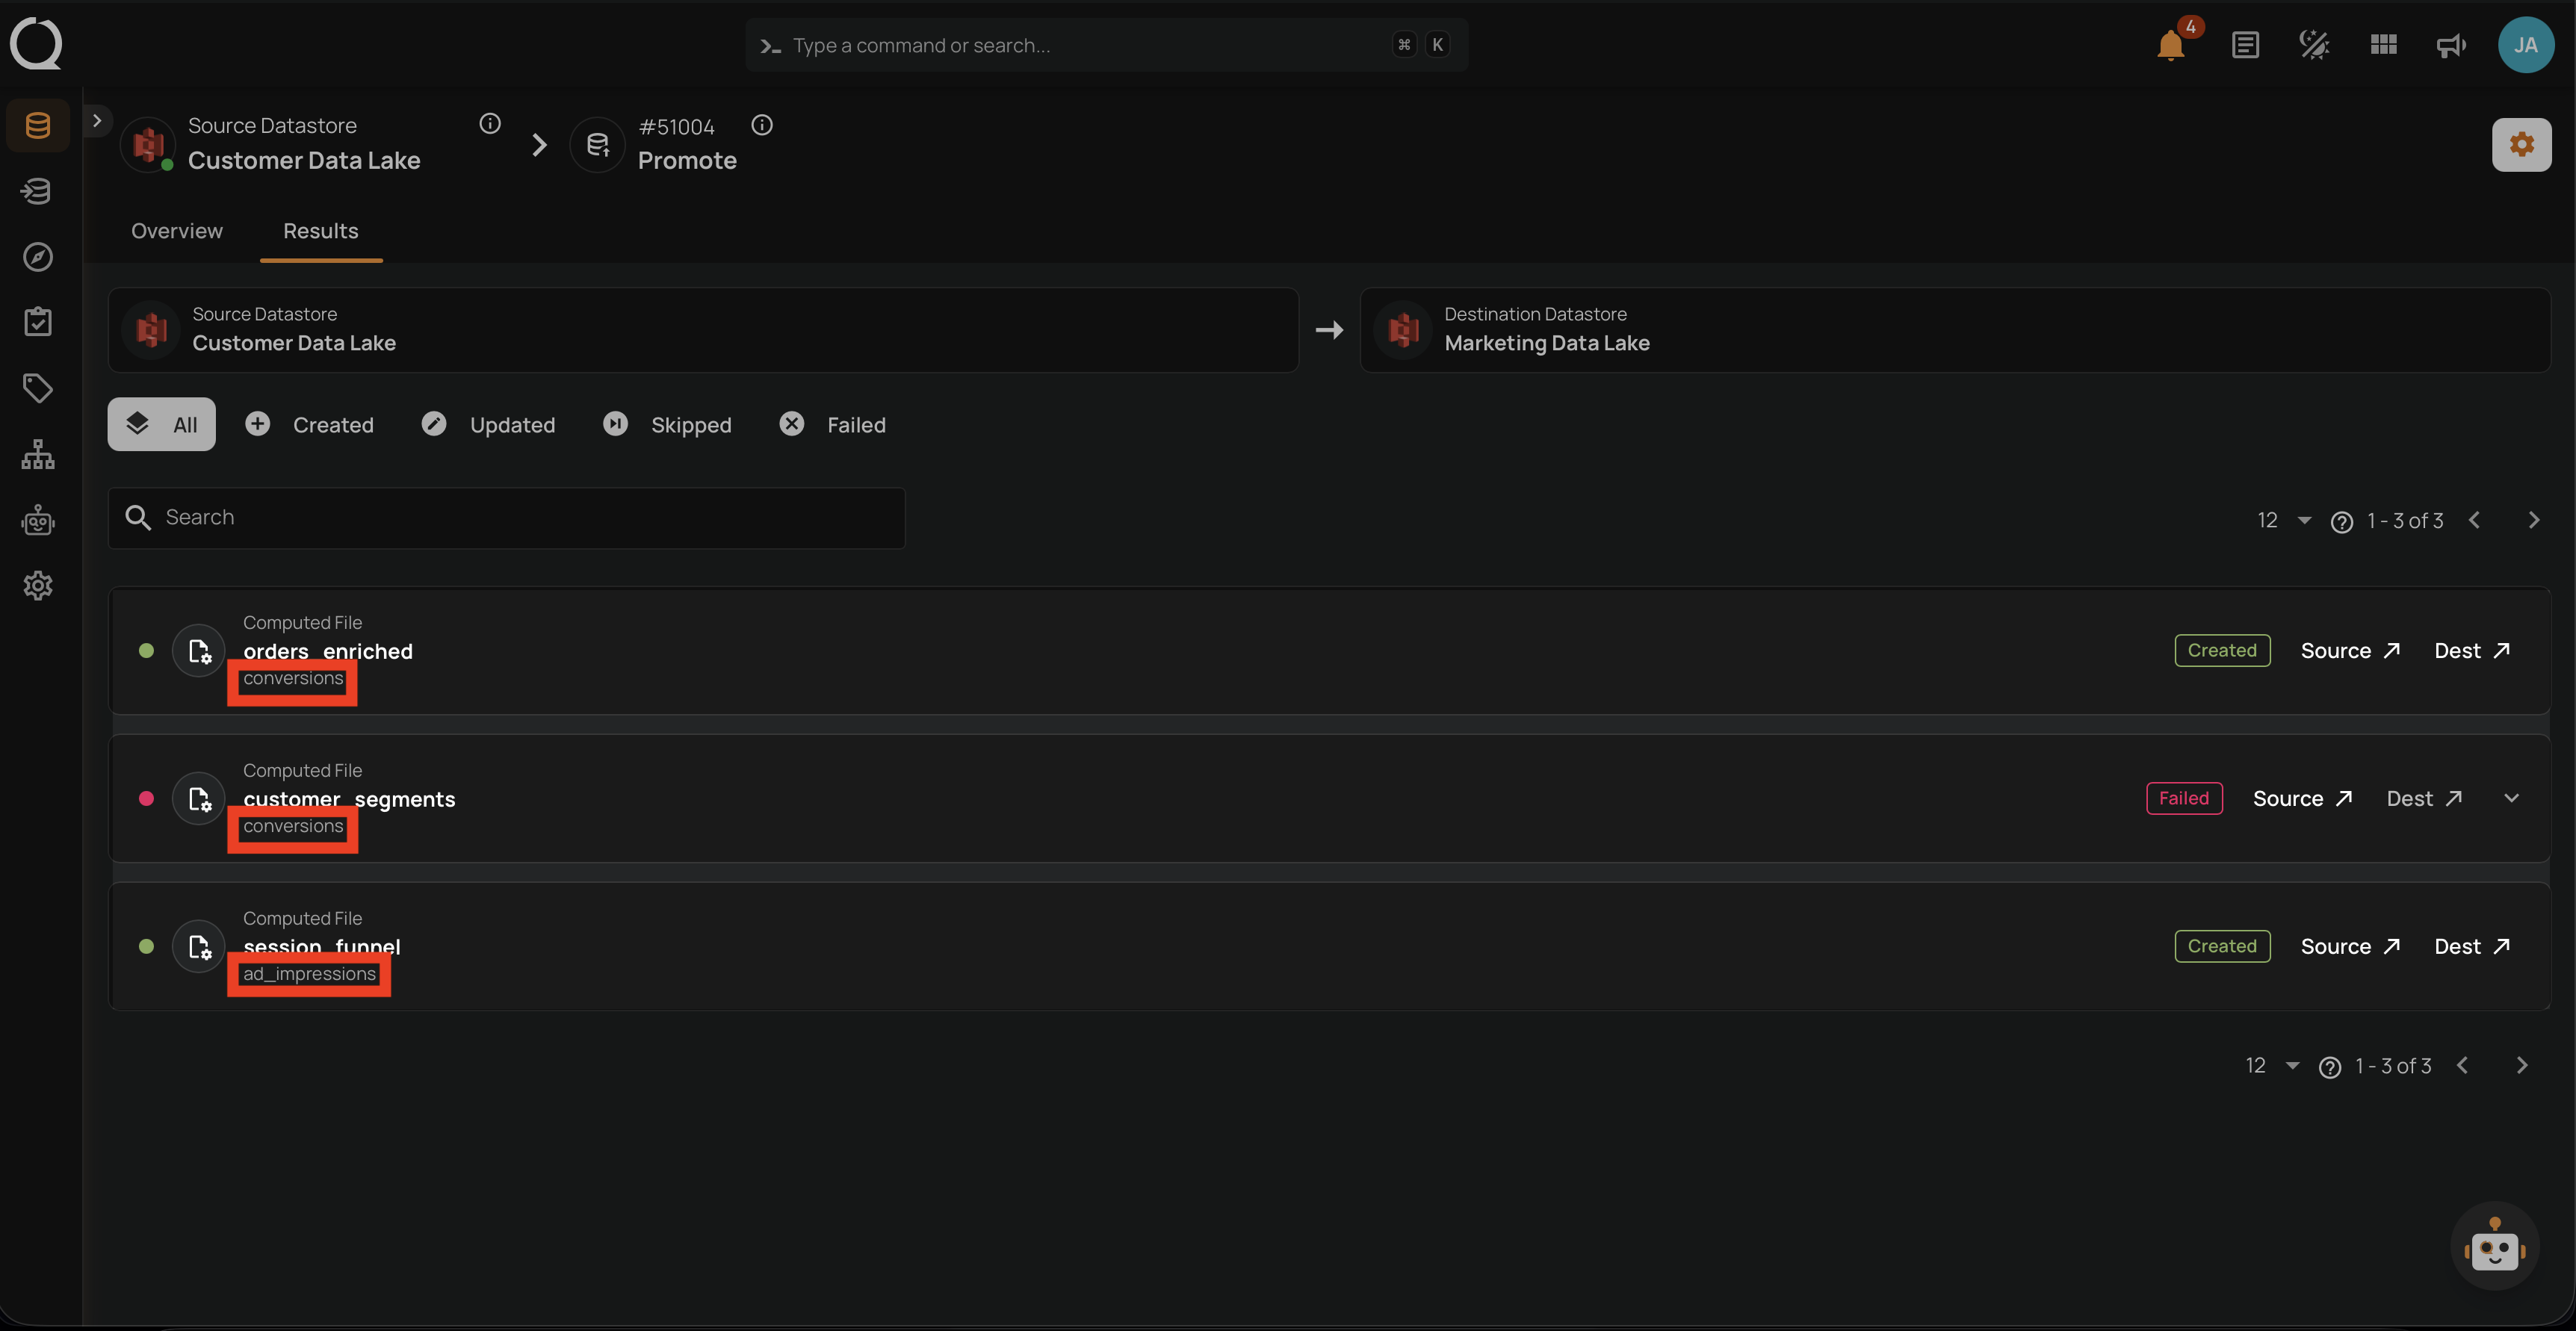
Computed File Mapping Details
For computed file promotions, each result row additionally shows the destination file pattern name below the source computed file name. This helps you verify that the mapping was applied correctly.
Monitoring In-Progress Operations
While a promote operation is running, you can track its progress in two places.
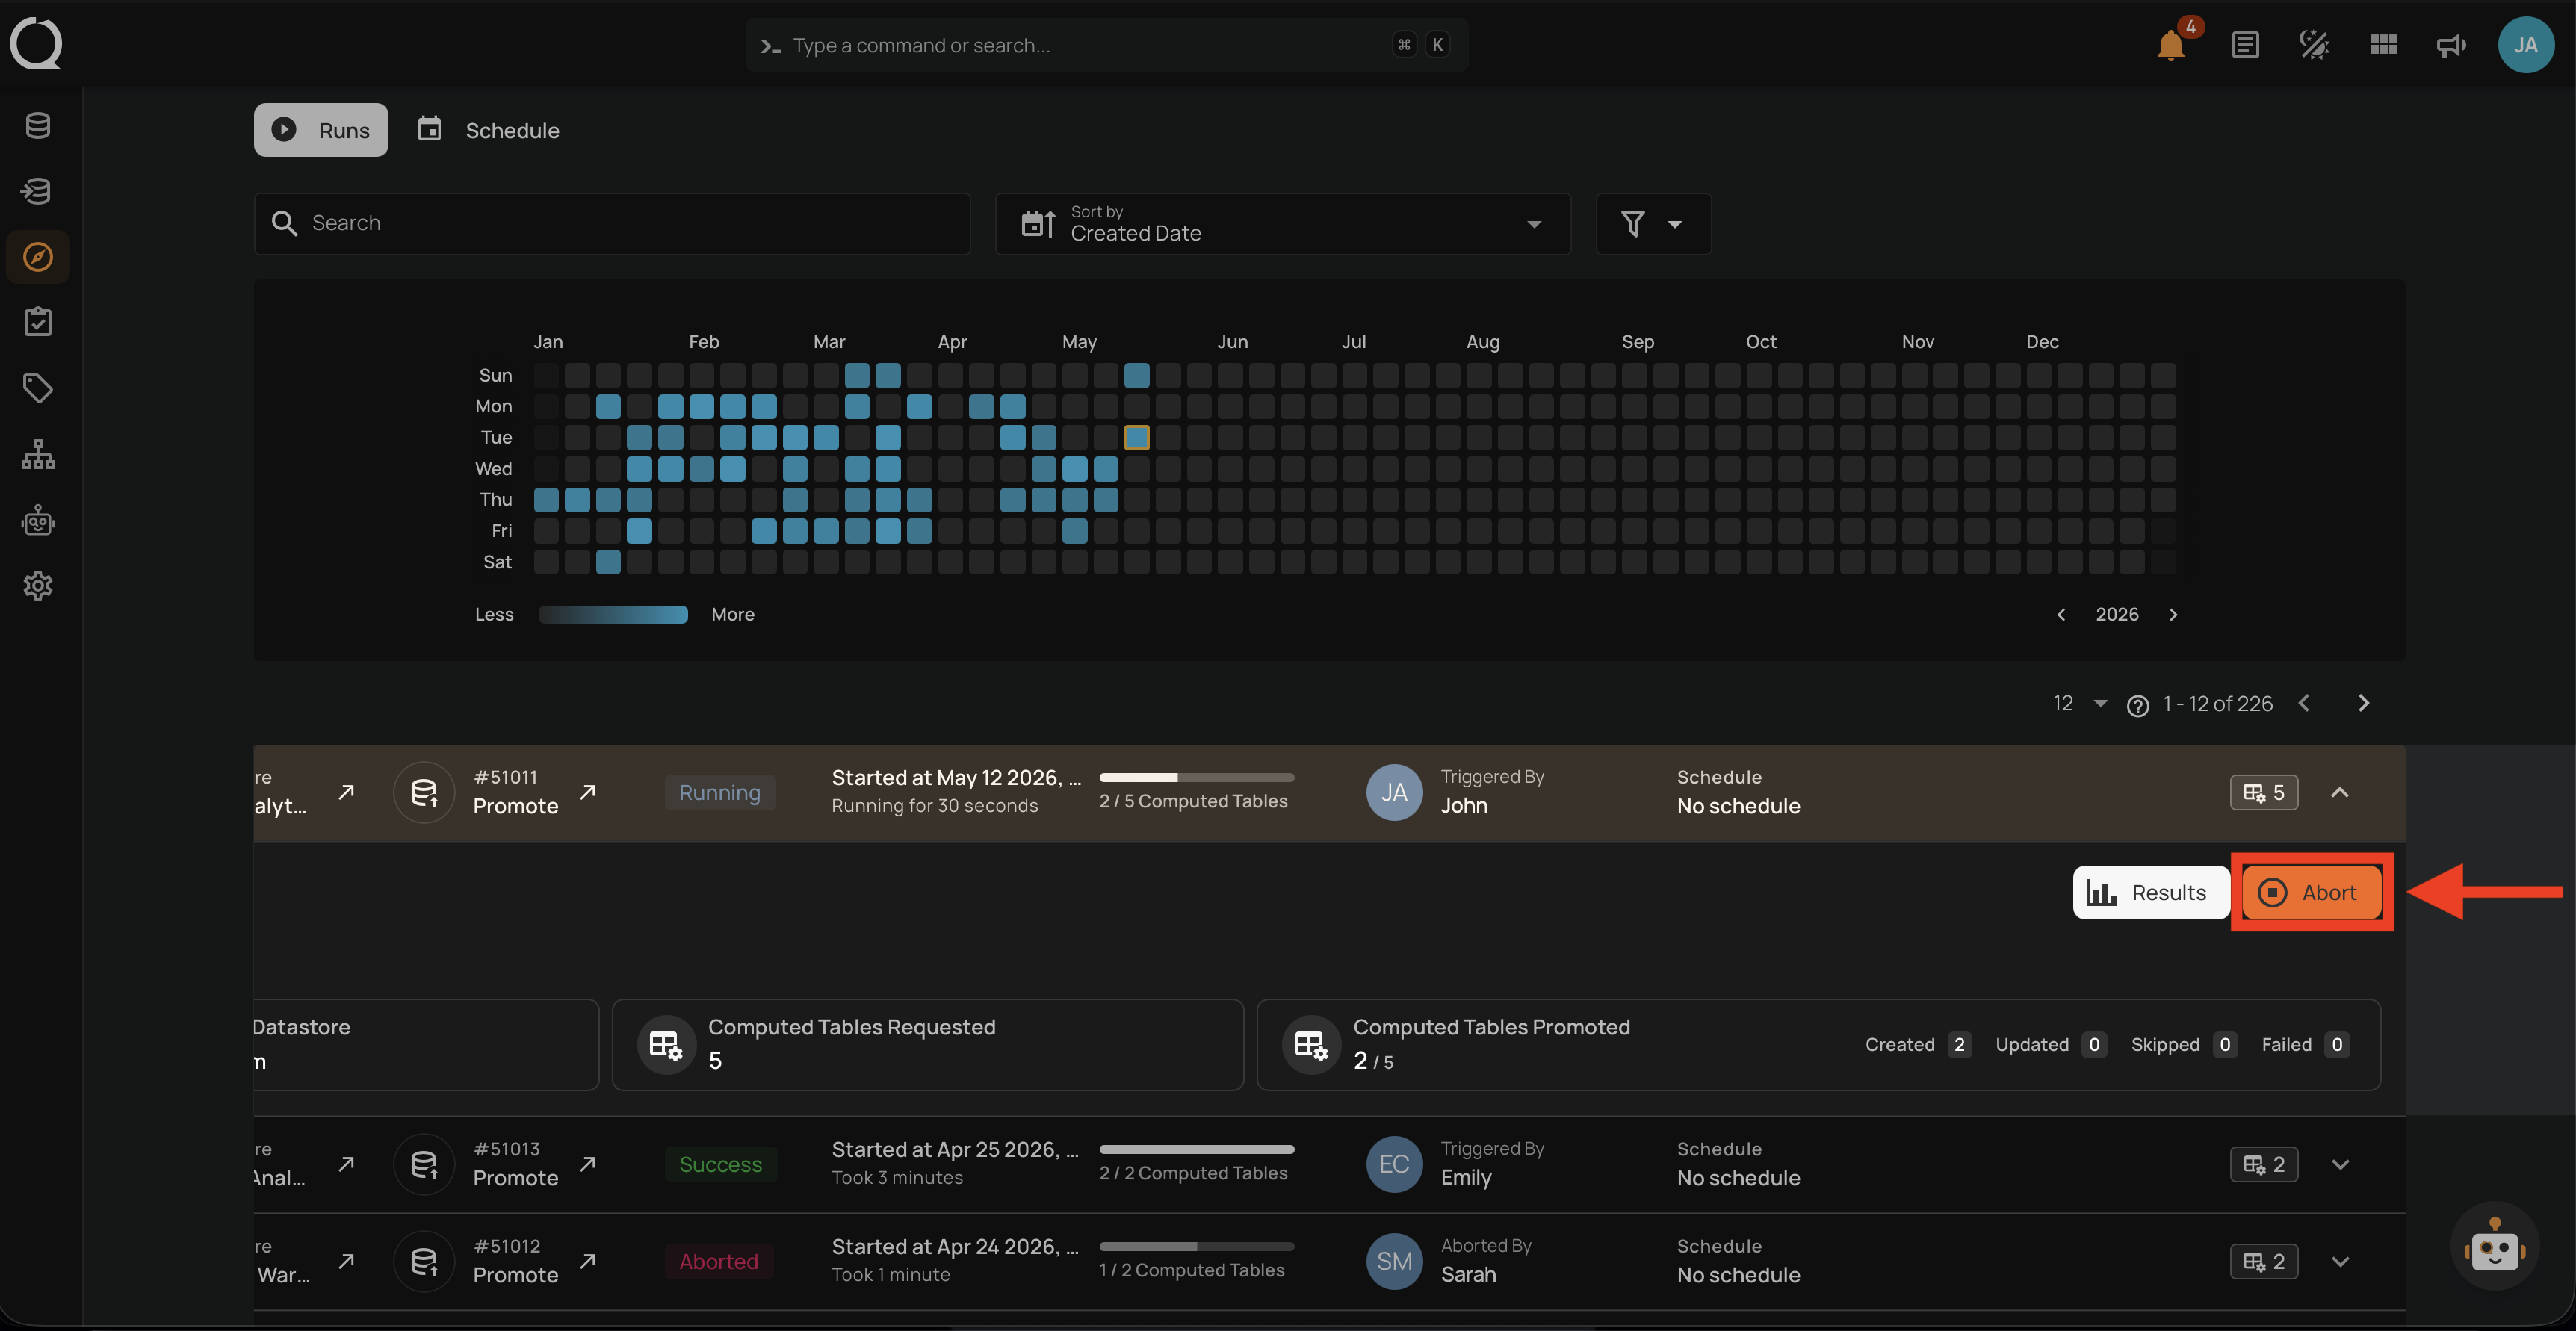
On the Activity page
The operation row shows a Running badge alongside a counter of how many entities have been processed (for example, 2 / 5 Computed Tables). Expand the row to reveal the Abort button, which stops the operation cleanly between entities. Already-processed entities keep their result, and the operation is marked as Aborted. On aborted rows, the user column label switches from Triggered By to Aborted By, identifying who stopped the operation.
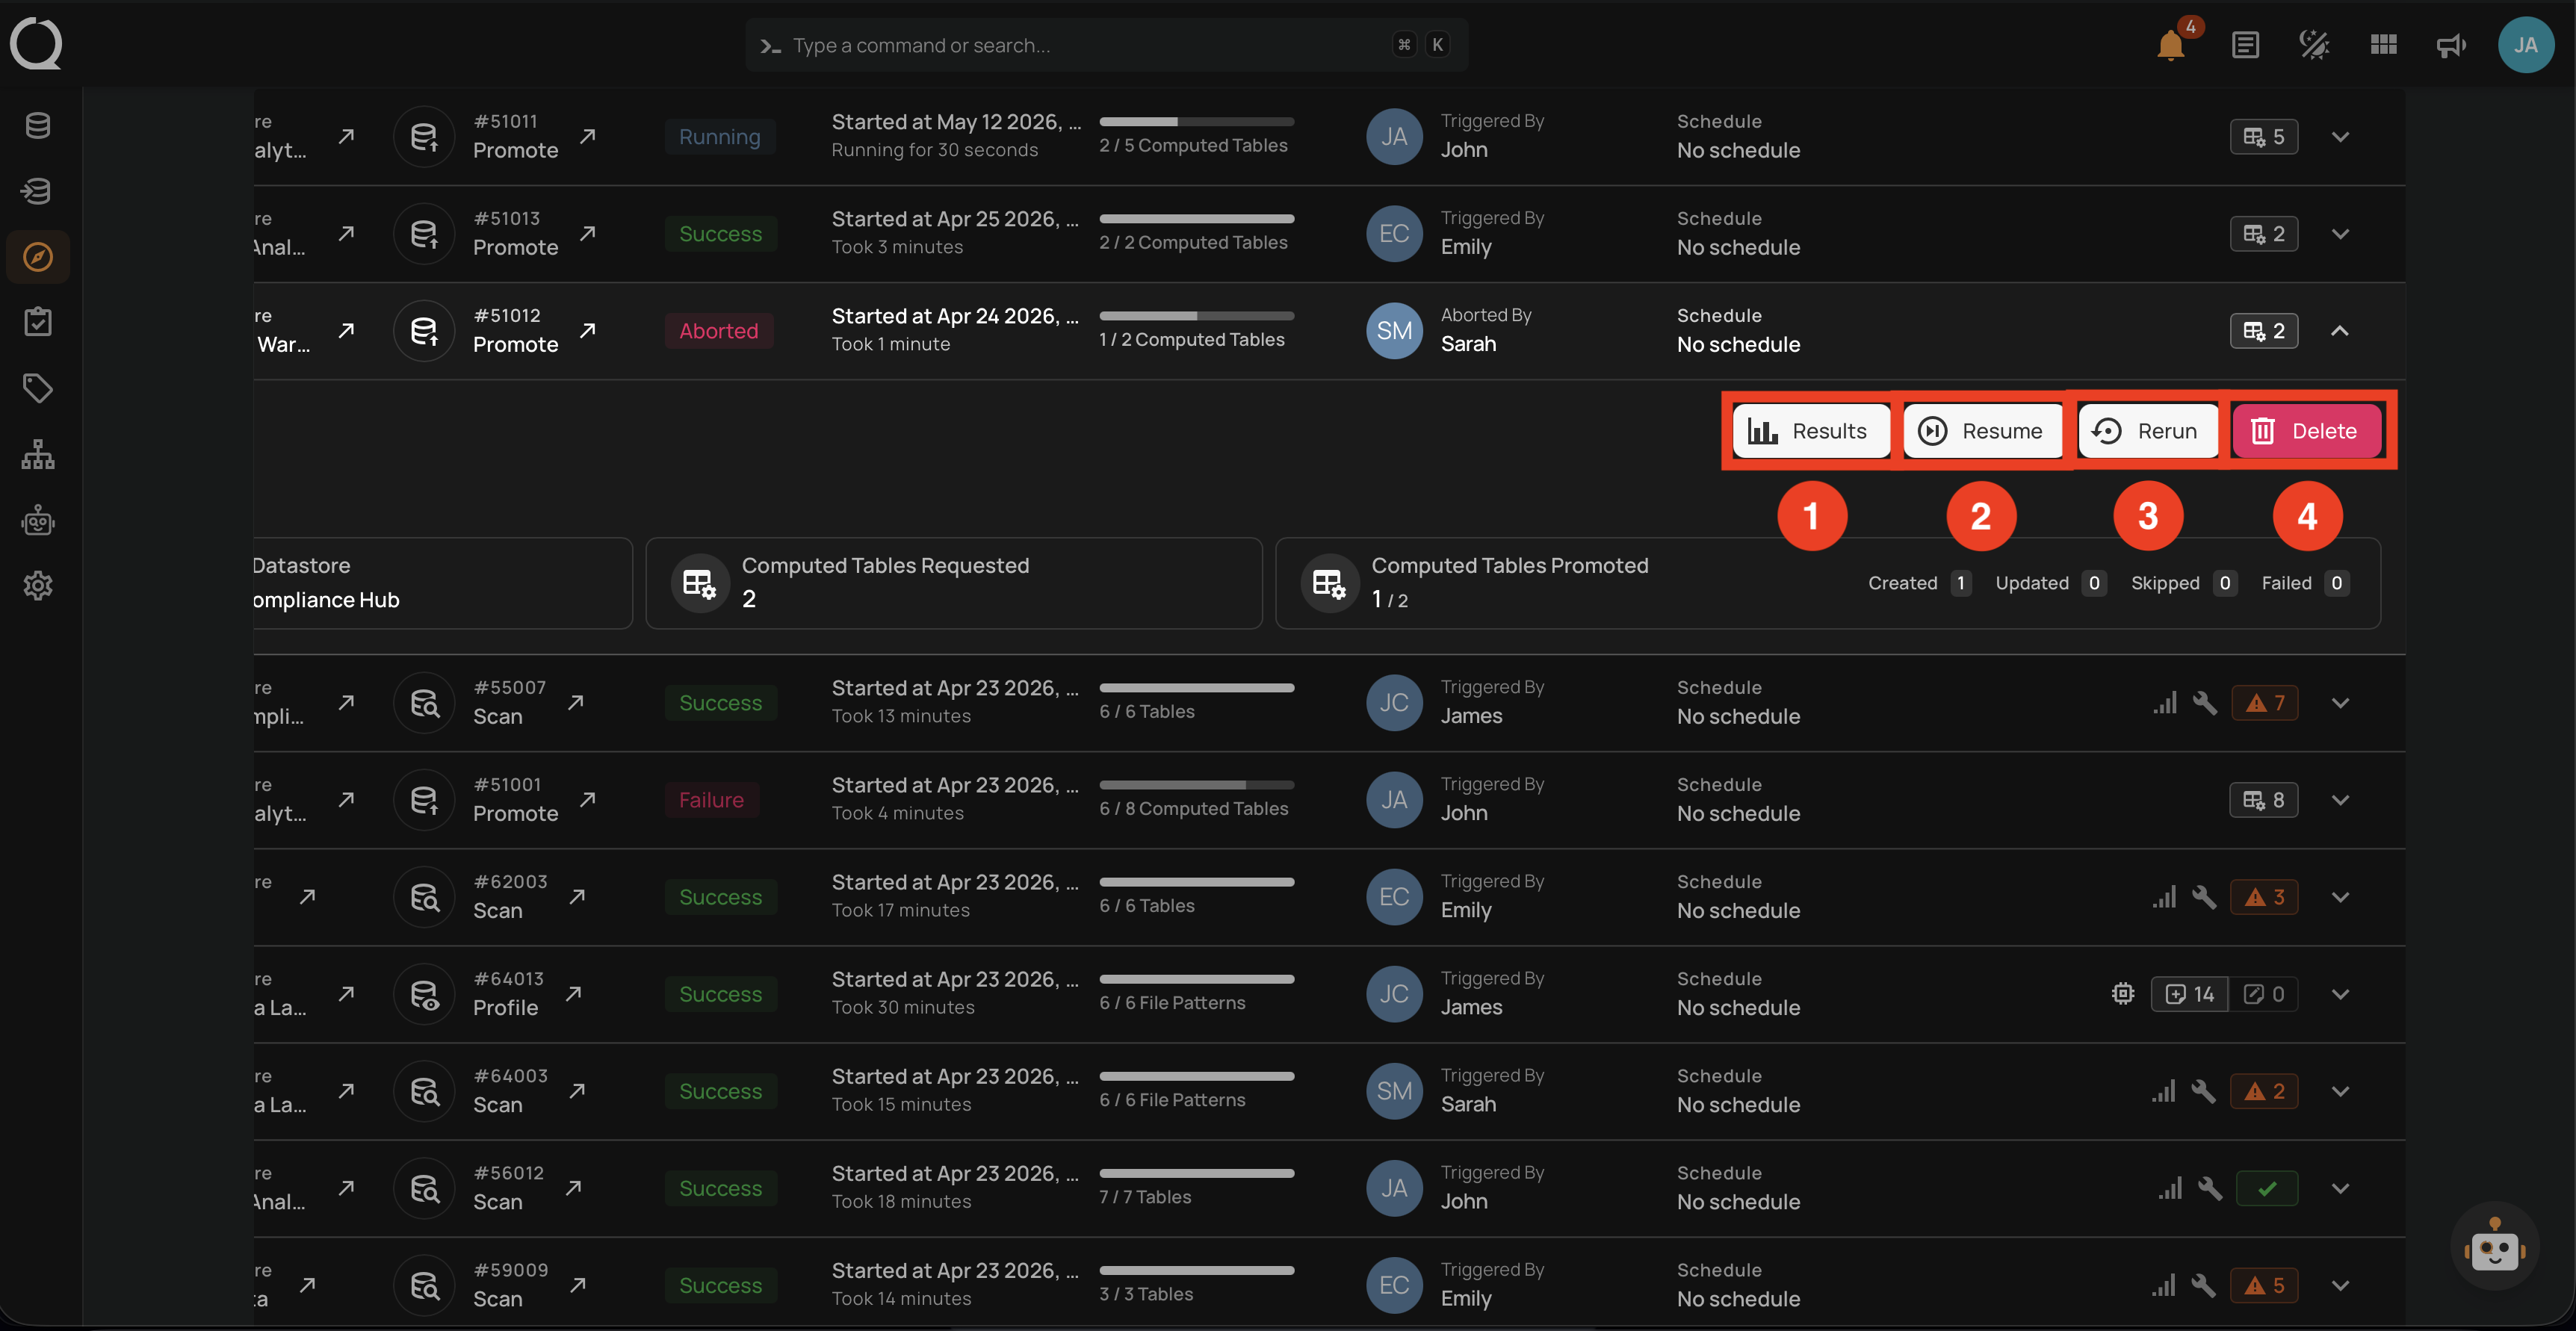
After abort
When you expand an aborted operation row, four follow-up actions are exposed.
| REF. | BUTTON | DESCRIPTION |
|---|---|---|
| 1 | Results | Open the results page to inspect entities processed before the abort. |
| 2 | Resume | Re-enqueue the operation. The platform skips entities already processed and continues from where it stopped, so already-promoted entities are not promoted again. |
| 3 | Rerun | Start a fresh operation with the same parameters. Unlike Resume, the new run processes every entity from scratch. |
| 4 | Delete | Remove the operation from the Activity page. Only visible to users with the Delete permission on Operations. |
On the operation detail page
Both tabs reflect the running state in real time:
- The Overview tab's Summary panel shows a live counter (e.g.
Computed Tables Promoted: 2 / 5) with breakdown chips for Created, Updated, Skipped, and Failed counts. The Timeline panel adds an Operation In Progress entry with a spinning icon while the worker is active. - The Results tab populates entities incrementally, so each row appears with its final status badge as soon as the platform finishes processing it.
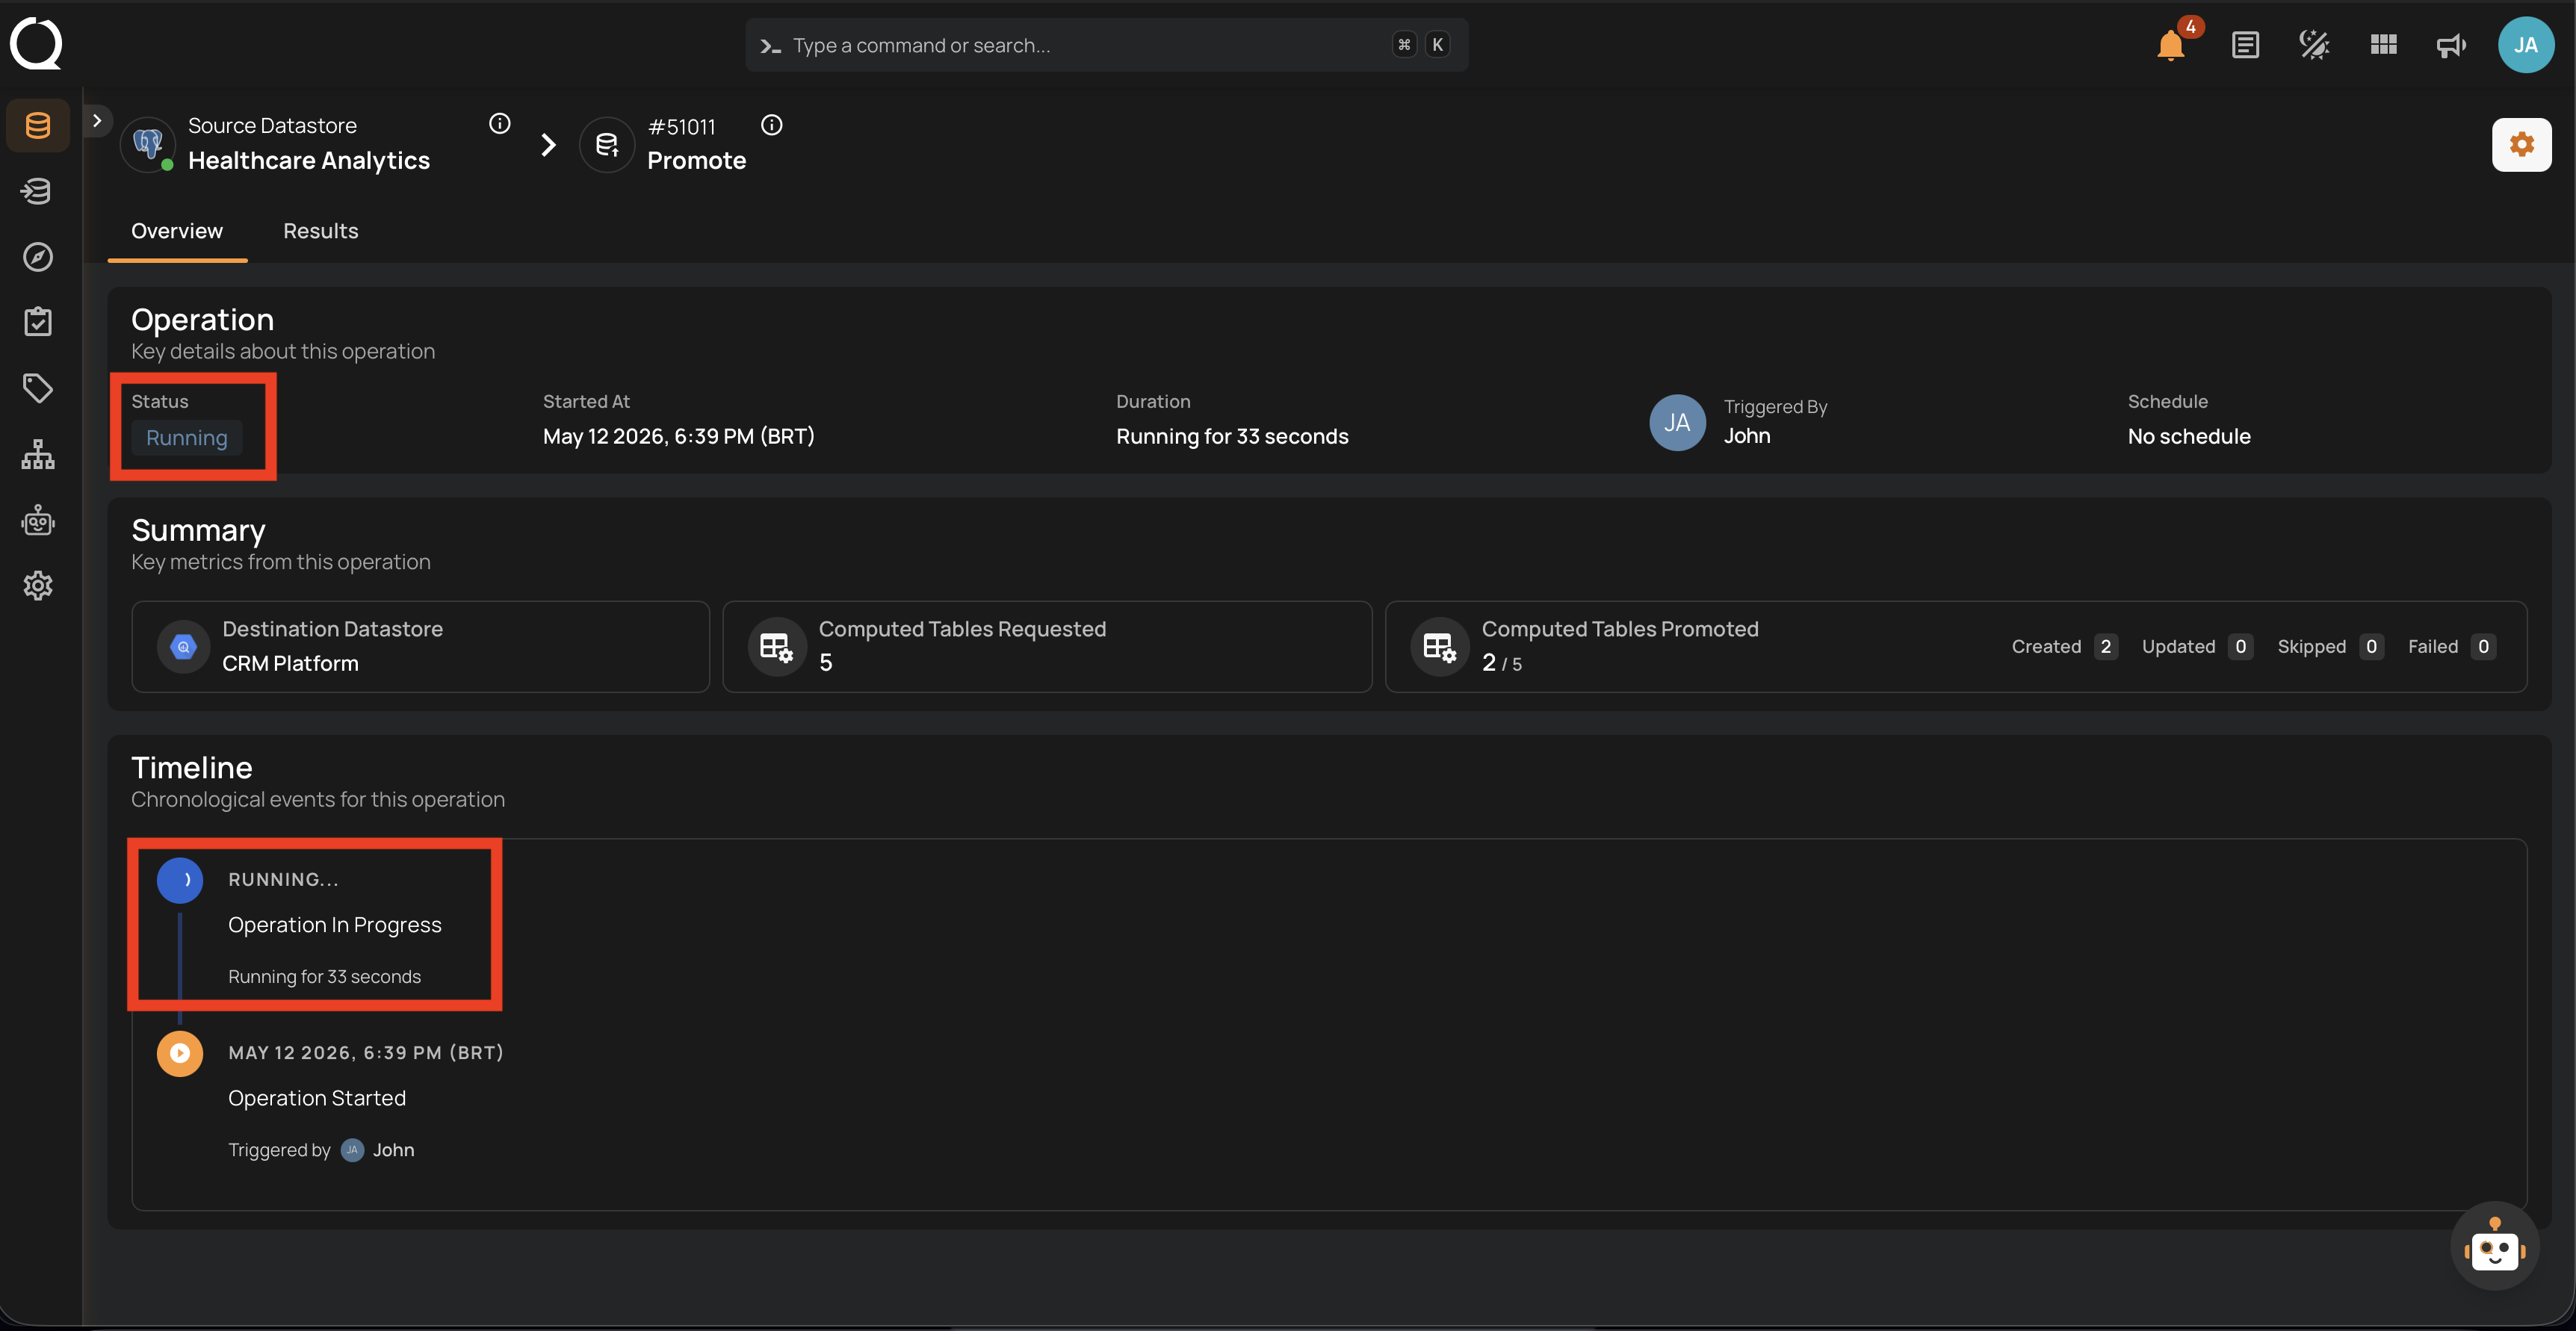
| REF. | INDICATOR | DESCRIPTION |
|---|---|---|
| 1 | Status: Running | The Operation panel reflects the active state in its Status field. |
| 2 | Operation In Progress | The Timeline panel adds an entry with a spinning icon while the worker is still processing entities. |
The page automatically reflects the final state when the operation completes.