Quick Start Guide
Welcome to Qualytics! This guide takes you from initial access to your first quality signals. You will connect data where it already lives, use Sync to map it, run Profile to understand its behavior and create most AI Managed checks, and run Scan to surface anomalies for review.
Deployment Access
Your Qualytics administrator provides the URL and sign-in method for your managed or self-hosted deployment. The interactive API documentation is available from the deployment at /api/docs.
Before You Begin
Confirm that you have:
- Access to your Qualytics deployment.
- Connection details and credentials for the first source datastore.
- Any network access required by the selected connector.
- A business process or critical dataset to prioritize.
Your platform role controls deployment-wide capabilities. Your team permission on a datastore controls what you can do with that data. See Onboarding for the full first-run workflow.
Signing In
The sign-in methods available to you depend on how your deployment is configured.
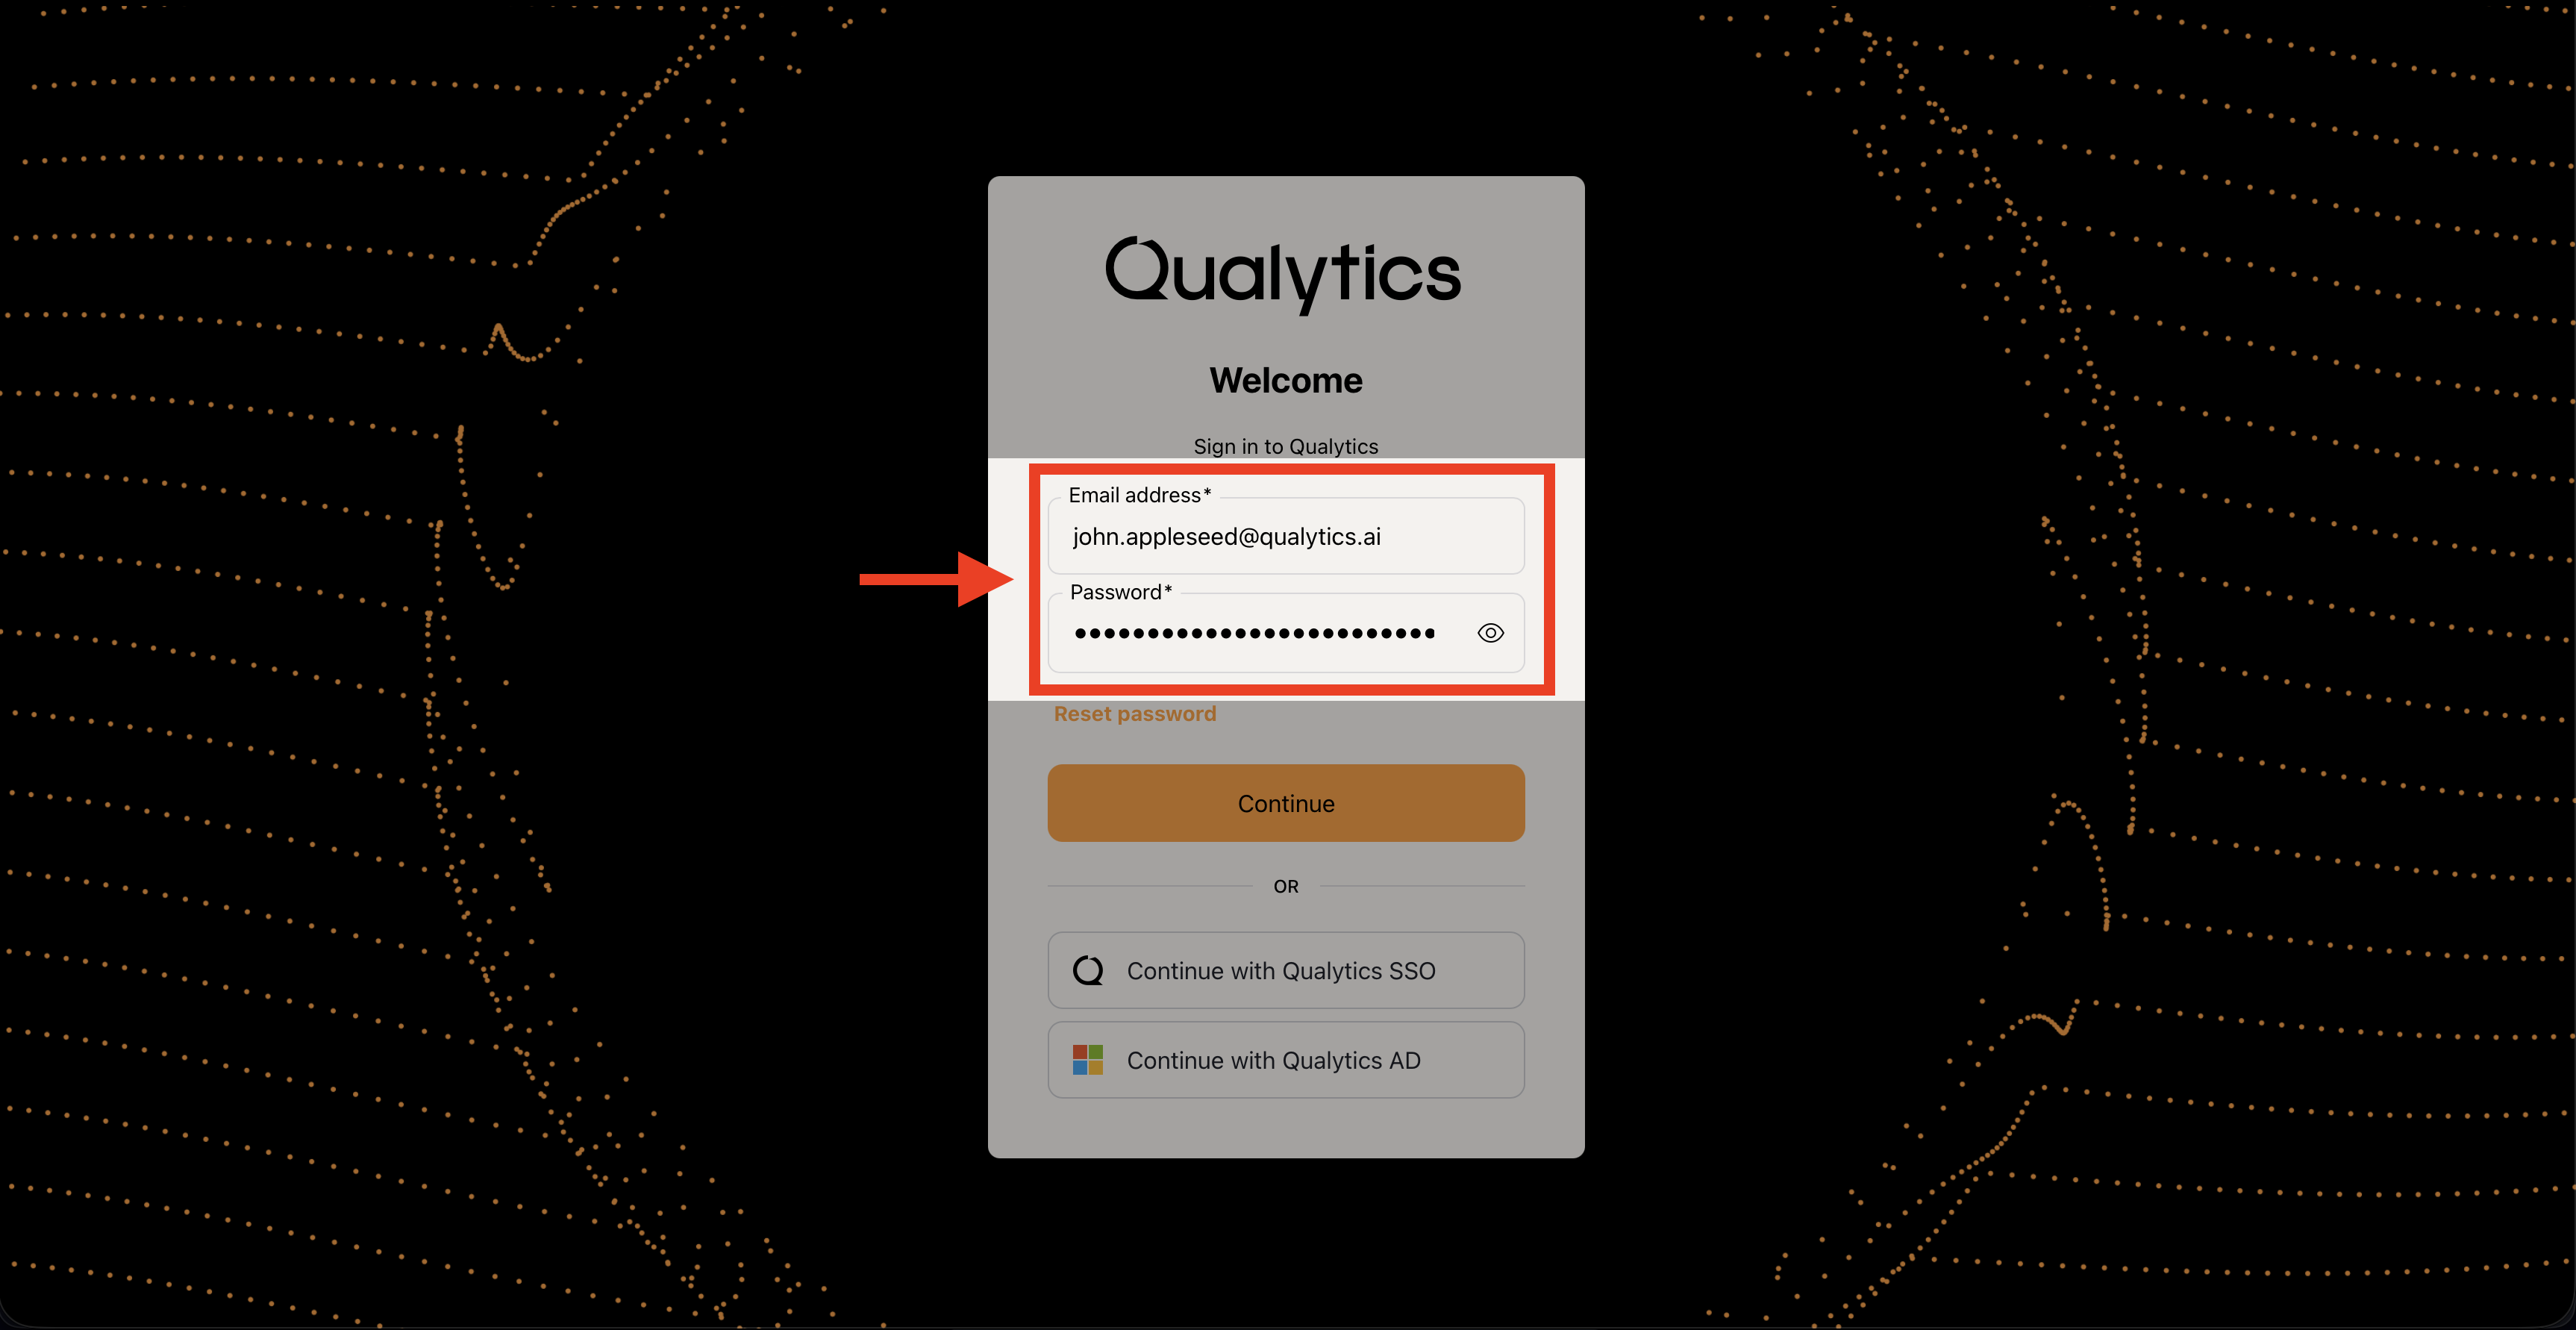
Method 1: Email and Password
Use your email and password when email and password sign-in is enabled. If you are new to the platform, your administrator sends you an email invitation with a link to set your password.
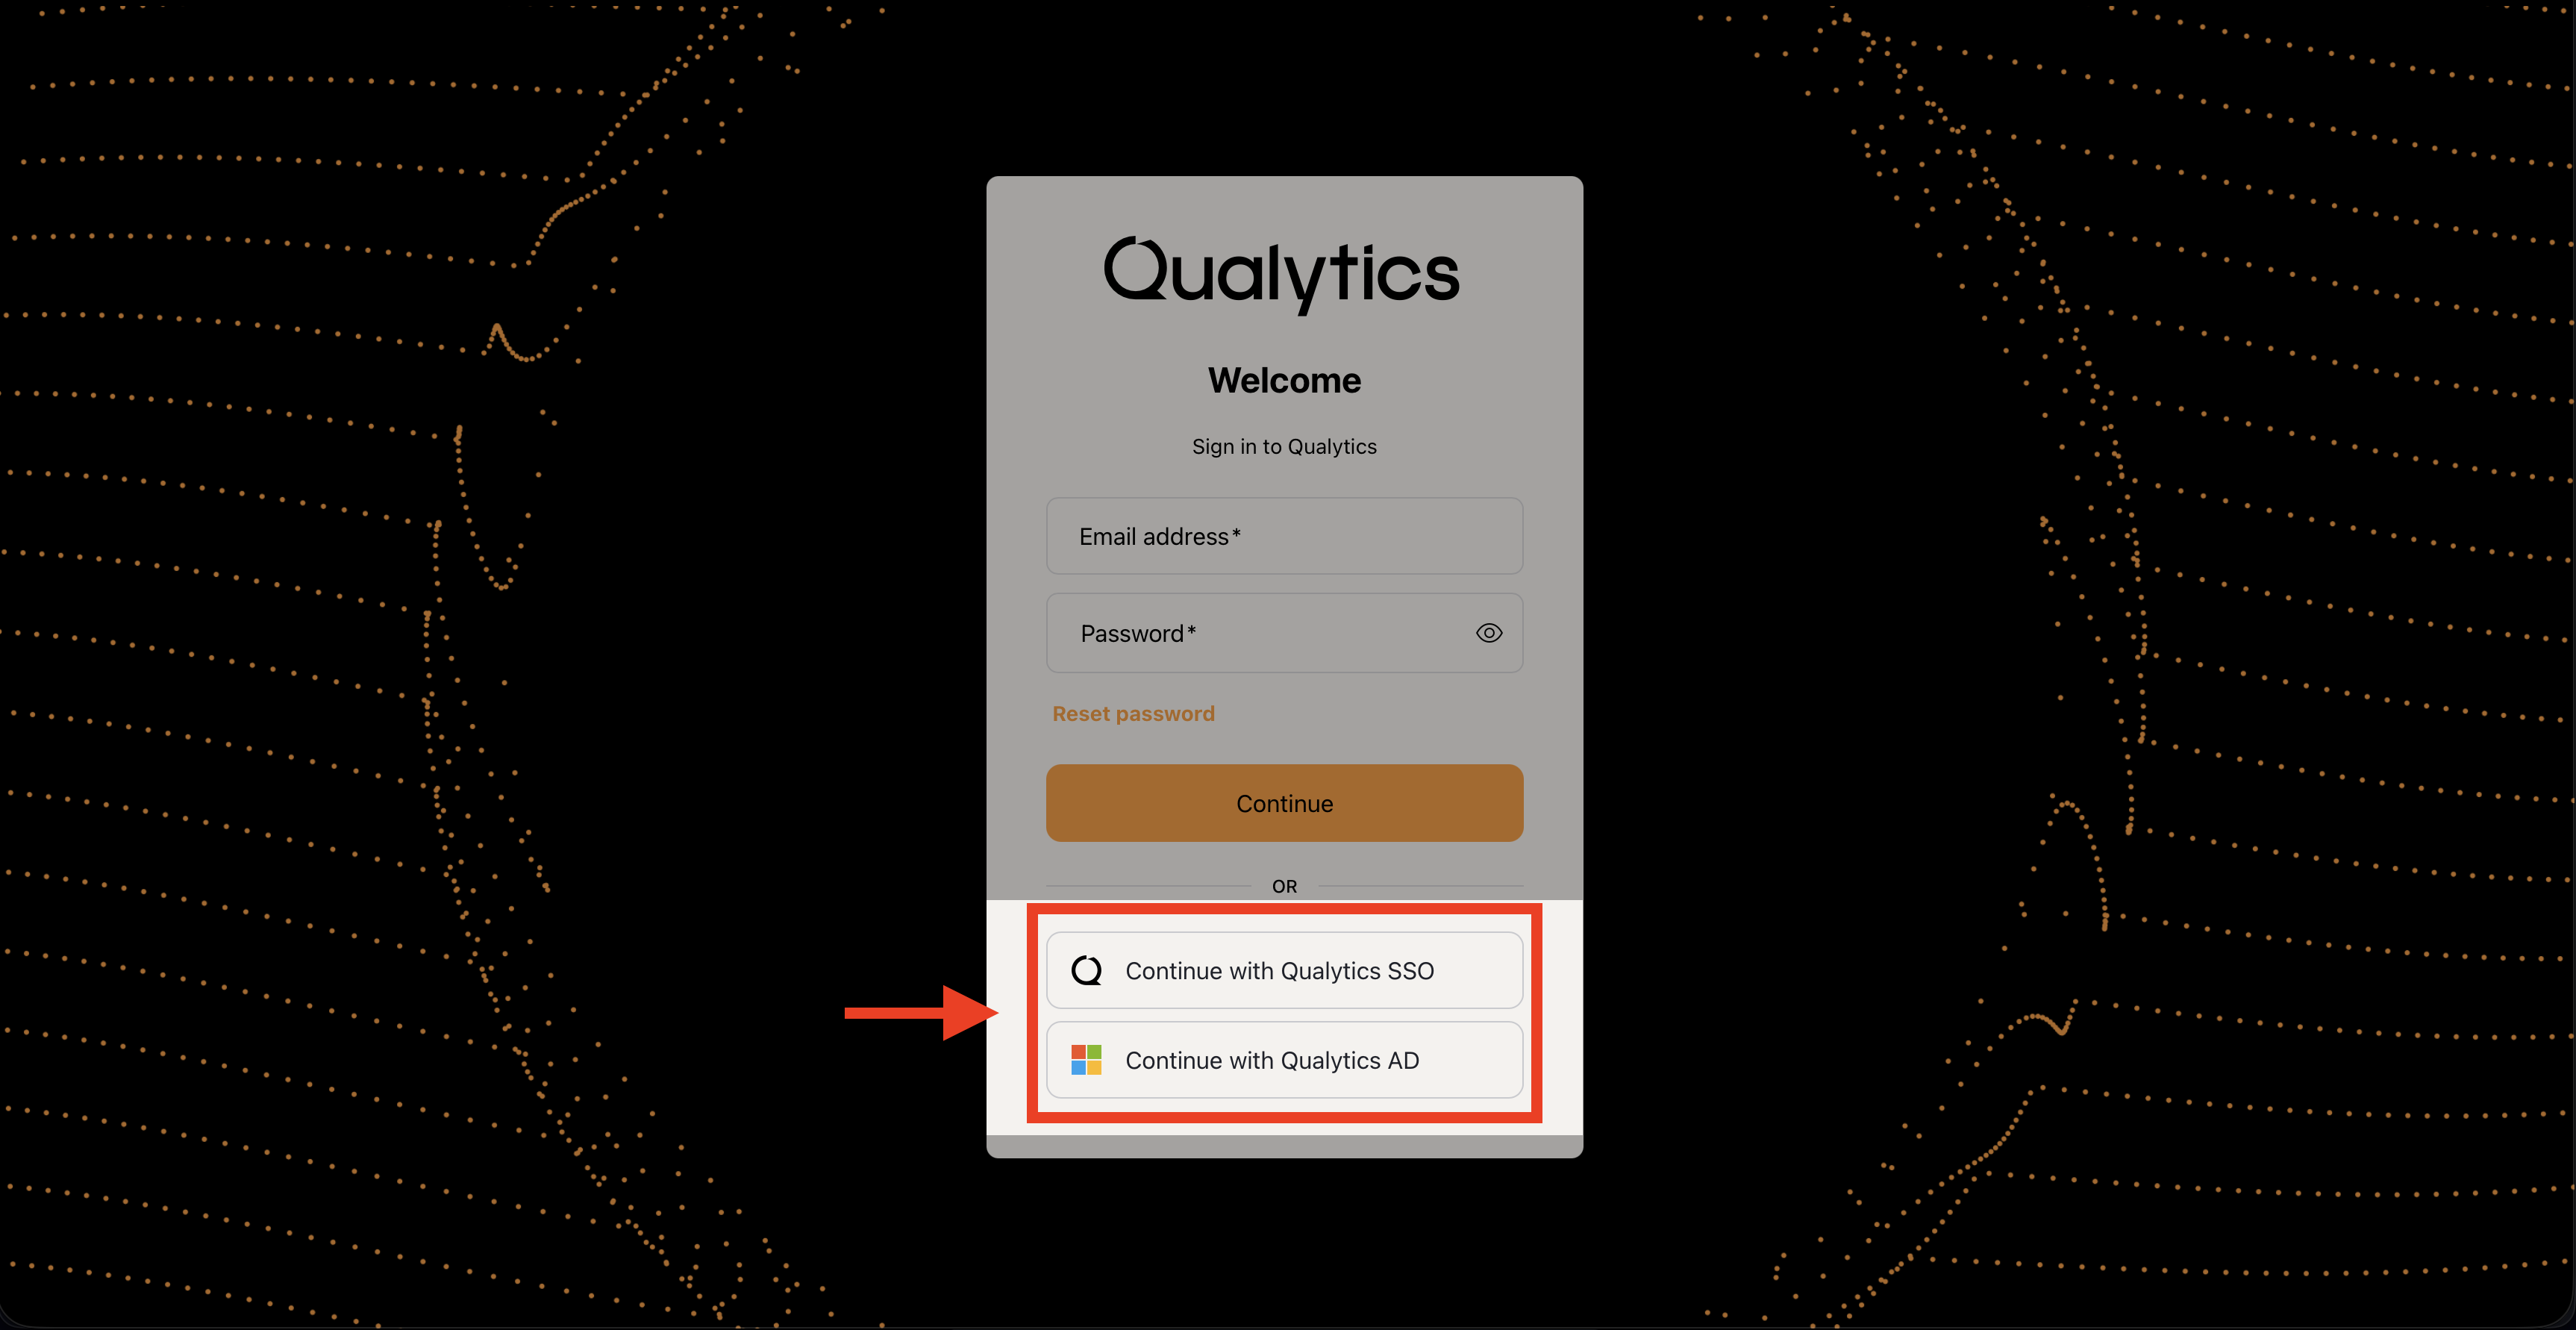
Method 2: Enterprise SSO
When enterprise SSO is configured, sign in through your organization's identity provider.
Getting Started Checklist
To produce your first quality signals:
- Connect your first source datastore.
- Confirm that Sync discovered the expected tables, files, and fields.
- Run Profile with the appropriate AI Effort and Oversight settings.
- Review the resulting AI Managed checks and add Authored checks for business expectations.
- Run Scan and investigate the resulting quality scores and anomalies.
- Configure Flows or integrations for the responses your team needs.
The sections below introduce each part of the workflow.
Understanding Datastores
In Qualytics, a source datastore represents data accessed through a configured connection. Supported connectors fall into two broad groups:
Database and Warehouse Datastores
Traditional relational databases (RDBMS), data warehouses, and analytical databases. These connect to Qualytics in one of two ways:
- JDBC datastores: connected through a standard JDBC driver (for example, PostgreSQL, Snowflake, or SQL Server).
- Native datastores: connected through the platform's own integration instead of a JDBC driver (for example, AWS Glue Native, Hive Native, and Unity Catalog Native).
File-Based Datastores
Files stored on cloud object storage, connected to Qualytics as DFS datastores (distributed file system):
- Cloud storage such as Amazon S3, Azure Blob Storage, and Google Cloud Storage.
- Raw files such as CSV, XLSX, JSON, Avro, and Parquet. See Supported File Formats for the full list.
Connecting Your First Datastore
Adding a Source Datastore
- On the welcome page, select Connect your data. From the datastore list, click Add and choose Source .
- Select a connector from the searchable grid, or switch to Existing Connection to reuse a saved connection. The User Guide panel beside the form shows the setup guide for the selected connector.
- Enter the connection and datastore settings.
- Choose whether to Initiate Sync, then select Test connection.
- Select Finish, or select Next to link an optional enrichment destination.
Warning
Features that write results back require an enrichment destination. Review the connector documentation before deciding whether to skip this step.
Enrichment Datastore
An enrichment datastore is where Qualytics writes those results, and it appears in the same tree as every other datastore. When linked to a source, it becomes that source's enrichment destination: Scan writes results and source-record examples there, while Export and Materialize write metadata and data snapshots. After each write, Qualytics adds the written outputs to the datastore as containers and, by default, profiles them so they are ready to use.
You can pick an existing datastore as the destination, or create one in the same step, reusing a saved connection or from scratch. See Link Enrichment on Datastore Creation for the walkthrough.
Core Operations
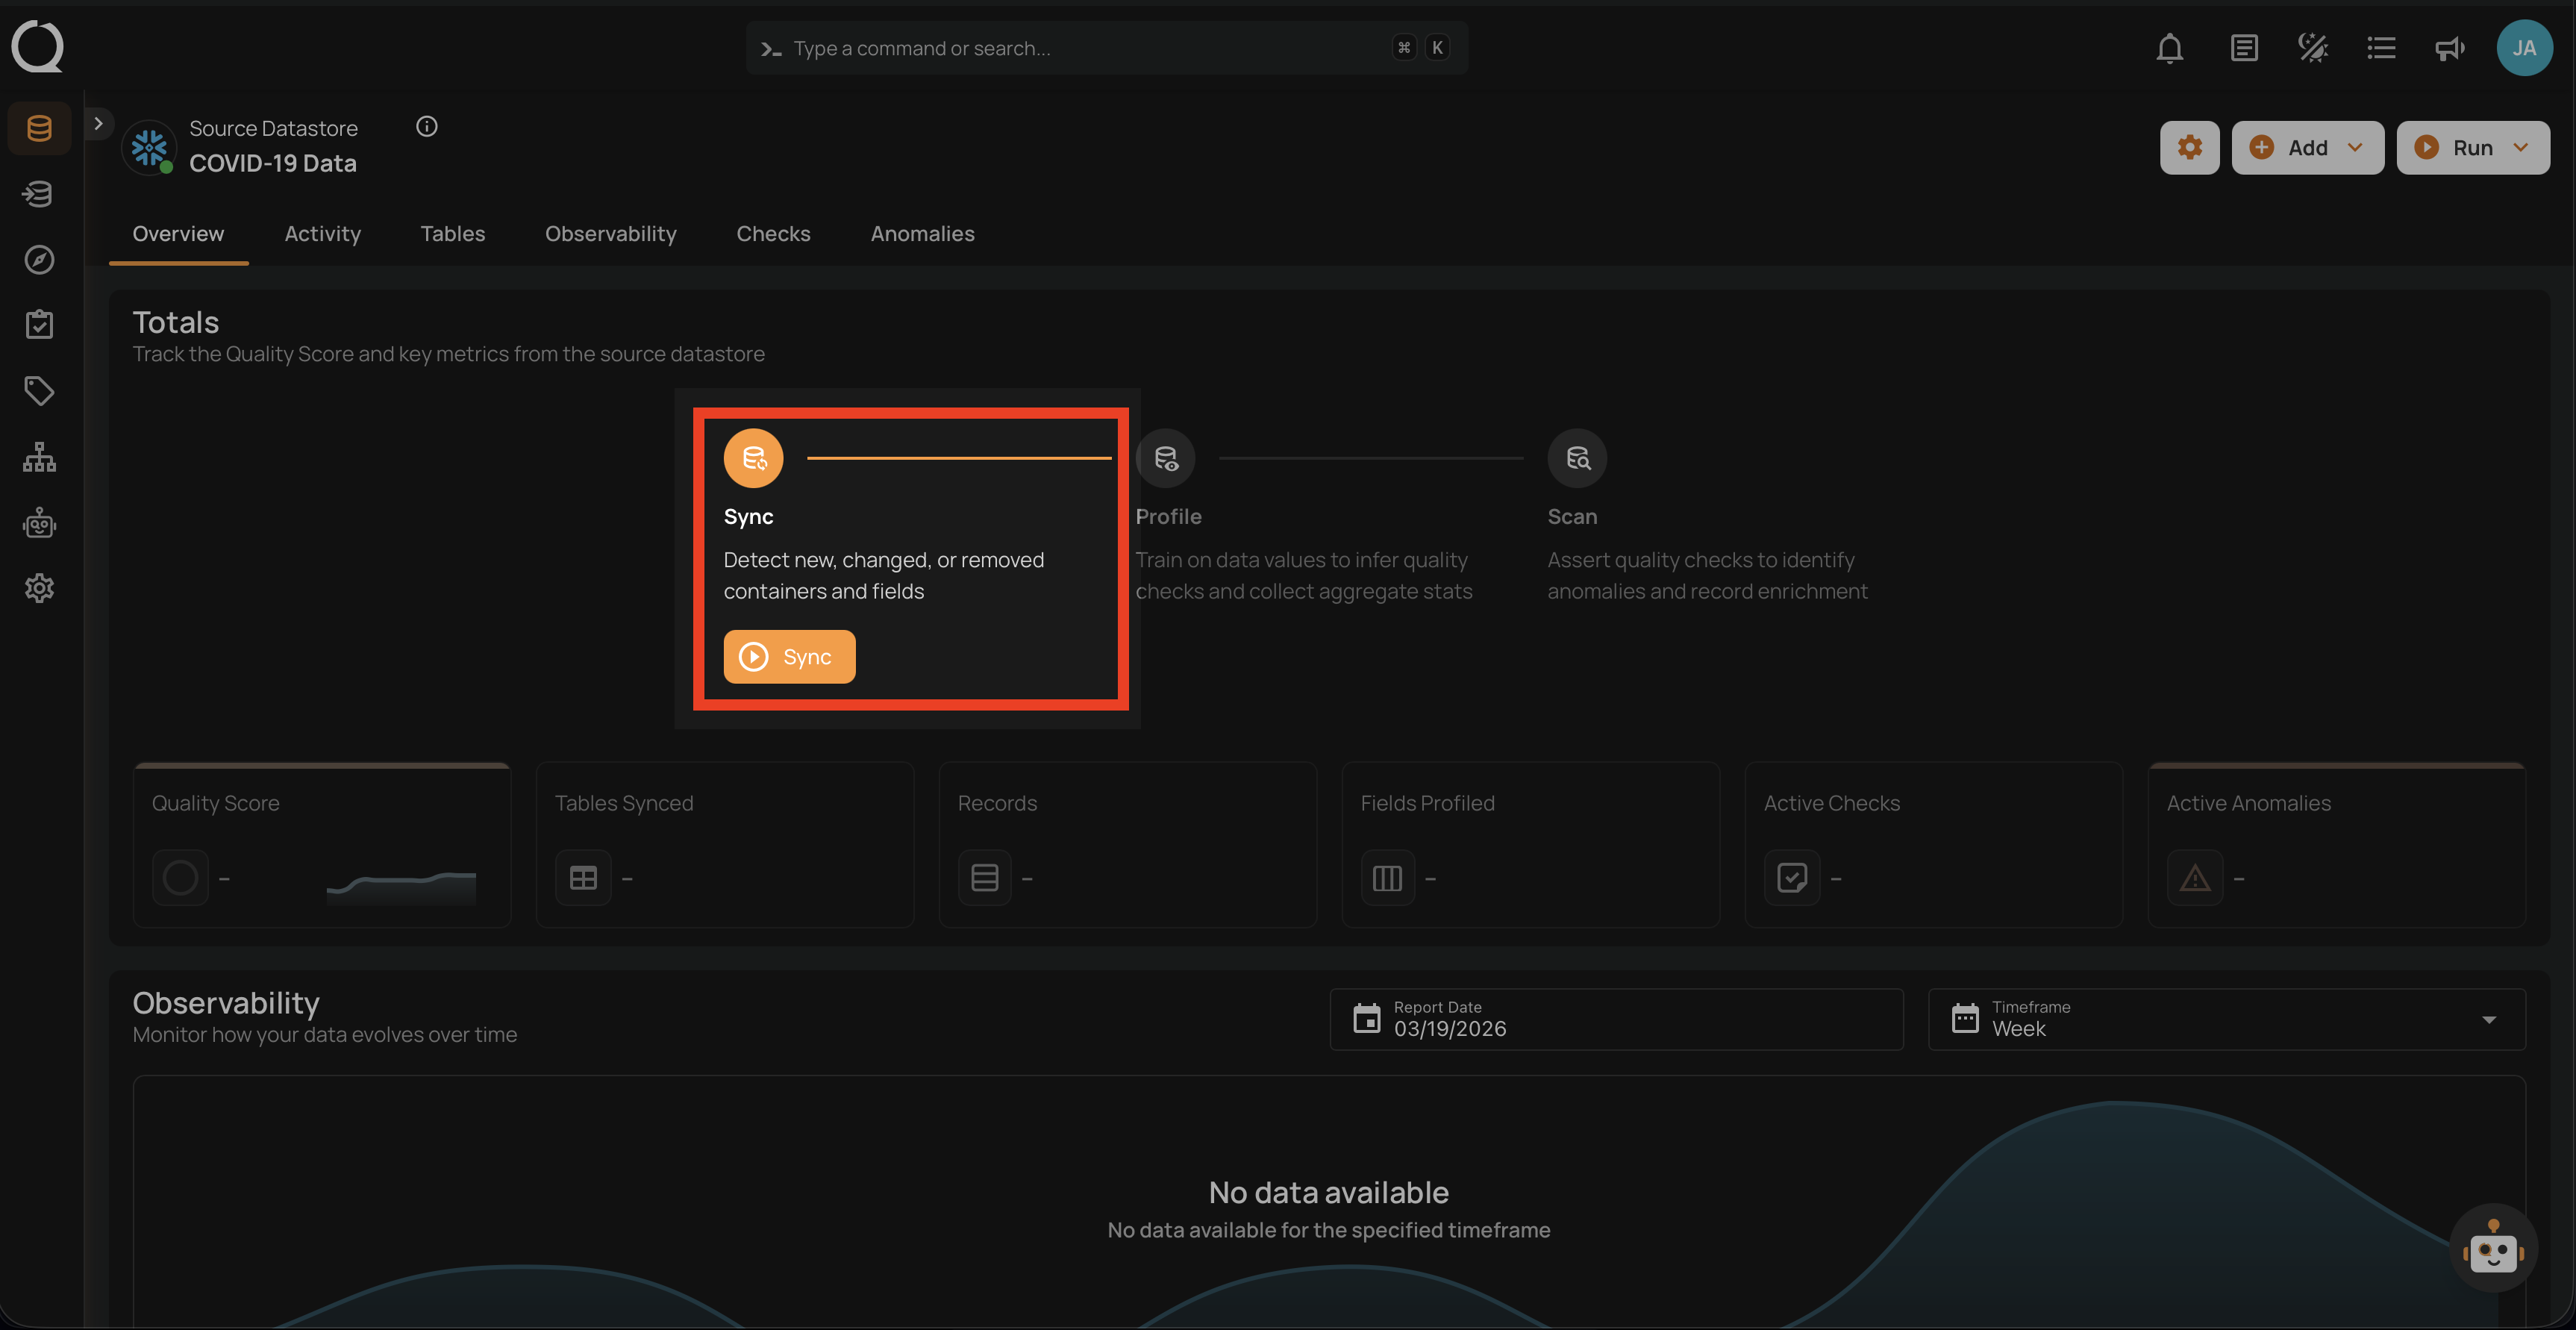
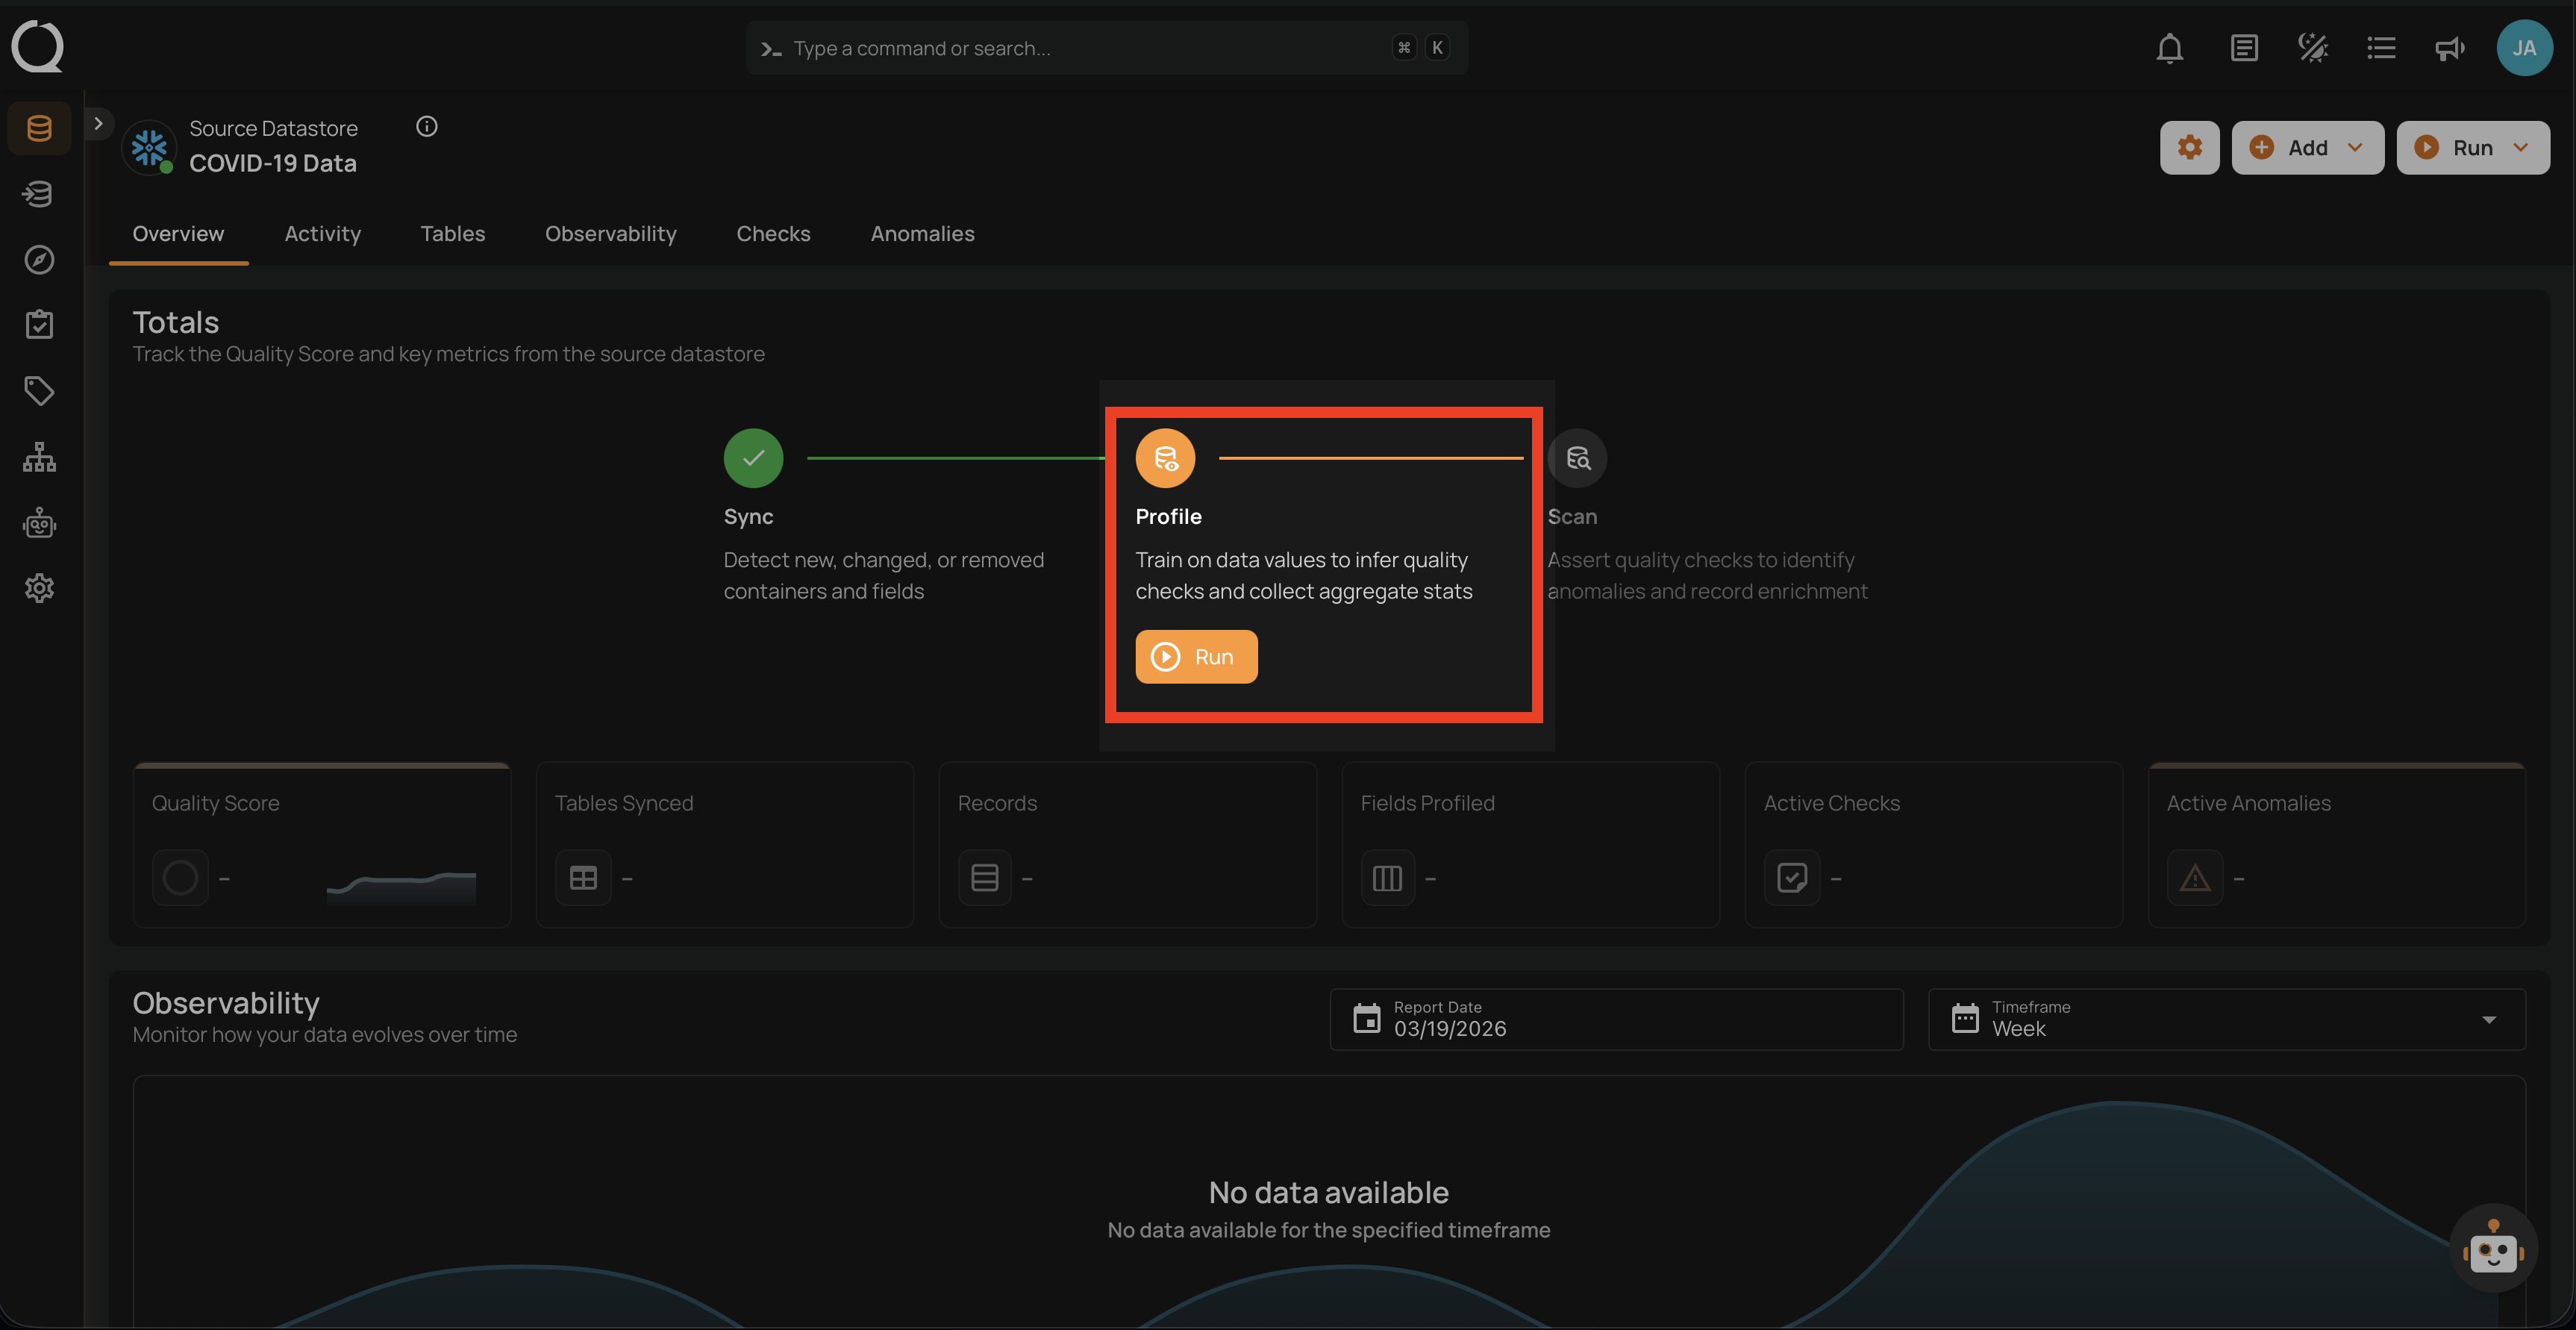
After connecting your datastore, Sync, Profile, and Scan build the first set of governed quality signals. The new datastore's overview page tracks these first runs in a Get started in three steps strip: each step unlocks when the previous one completes, shows live progress while it runs, and the strip retires once all three have completed successfully.
1. Sync Operation
Sync establishes the inventory that later operations use:
- Detects new, changed, or removed containers and fields and updates the datastore inventory in Qualytics.
- Establishes the containers and fields available to Profile and Scan.
- Can start after creation when Initiate Sync is selected; otherwise, run it from the datastore.
2. Profile Operation
Profile records statistics and observed patterns for the selected data:
- Records profile metadata.
- Calculates measures such as:
- Basic metrics (type, min/max, and lengths).
- Advanced analytics (skewness, kurtosis, and correlations).
- Value distributions and patterns.
- Generates and maintains most AI Managed checks according to the selected AI Effort level.
- Uses Oversight to determine whether new AI Managed checks become Active or remain Draft for review.
3. Scan Operation
Scan evaluates the active checks within the selected scope:
- Evaluates applicable AI Managed and Authored checks.
- Records failed checks as potential issues for review.
- When an enrichment destination is linked, writes anomaly details and source-record examples there.
- Updates the related quality scores.
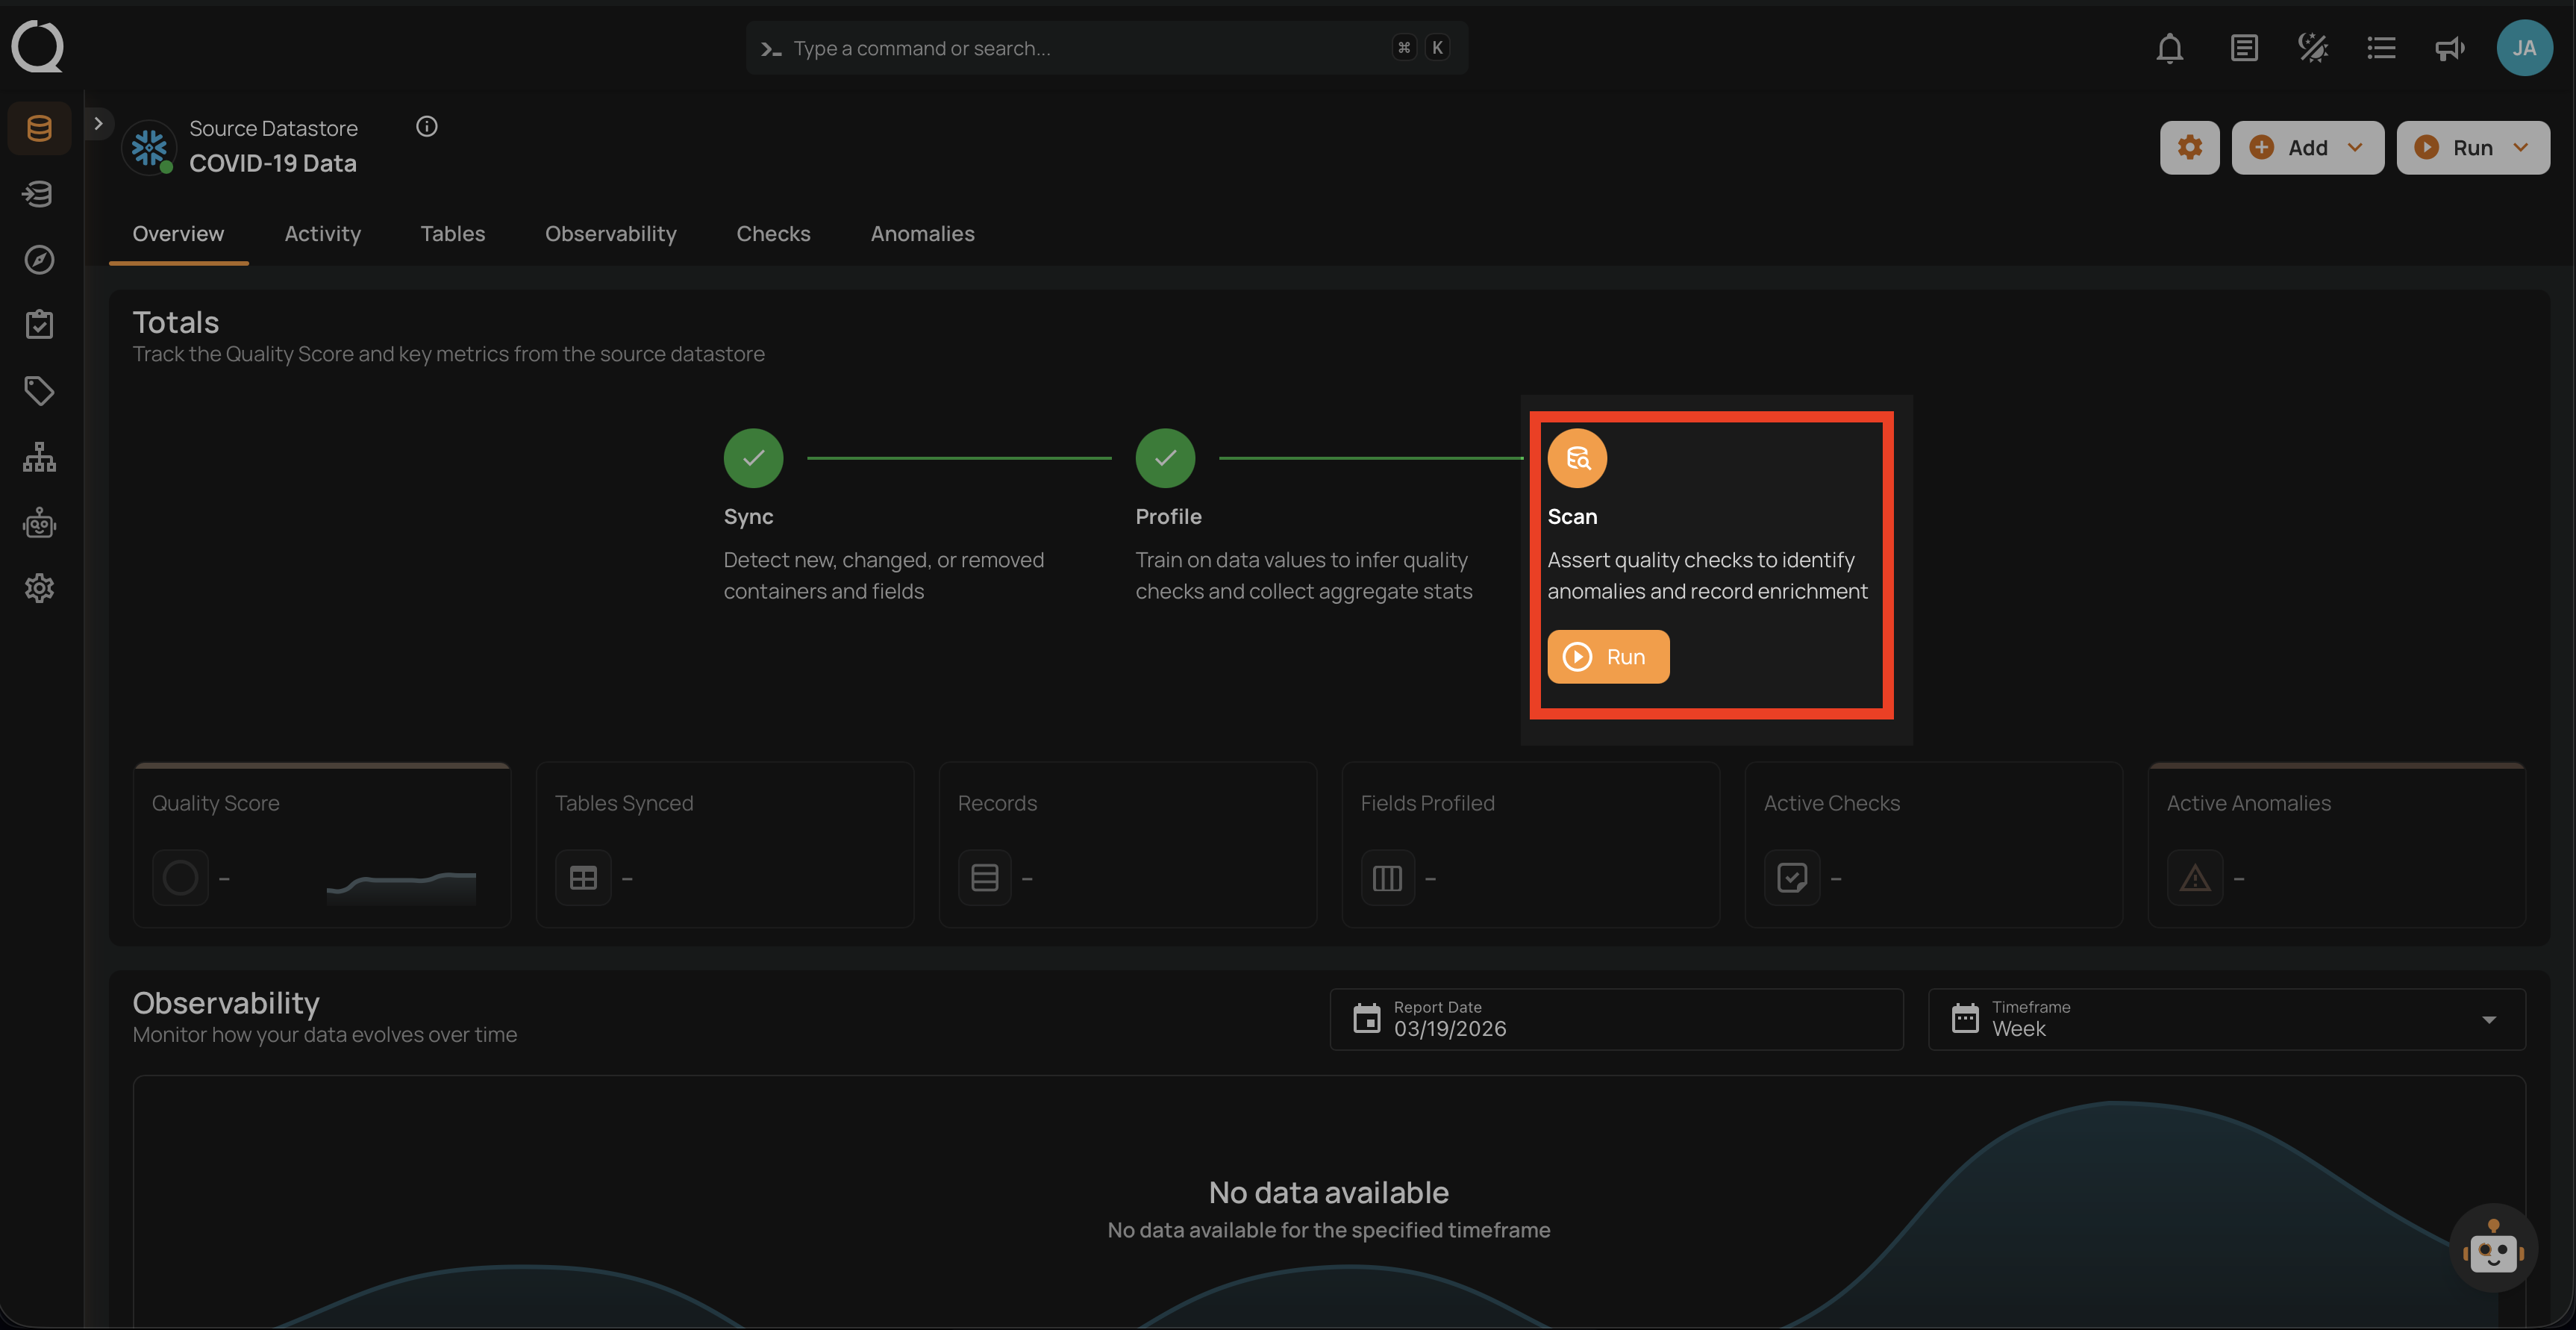
After a Scan completes, you can review:
- Start and finish times.
- Records processed.
- Anomalies detected.
- Quality scores.
Reviewing Data Quality
Quality Checks
Qualytics uses two types of quality checks:
1. AI Managed Checks
- Most are inferred from observed data during Profile operations. Volumetric and Freshness checks use recorded Observability measurements.
- Provide broad starting coverage without requiring every check to be written manually.
- Can become Active automatically or remain Draft for review, depending on Oversight.
- Qualytics maintains the check during later Profile operations while it remains Qualytics-owned.
- Marked with a purple AI badge (four-point star icon).
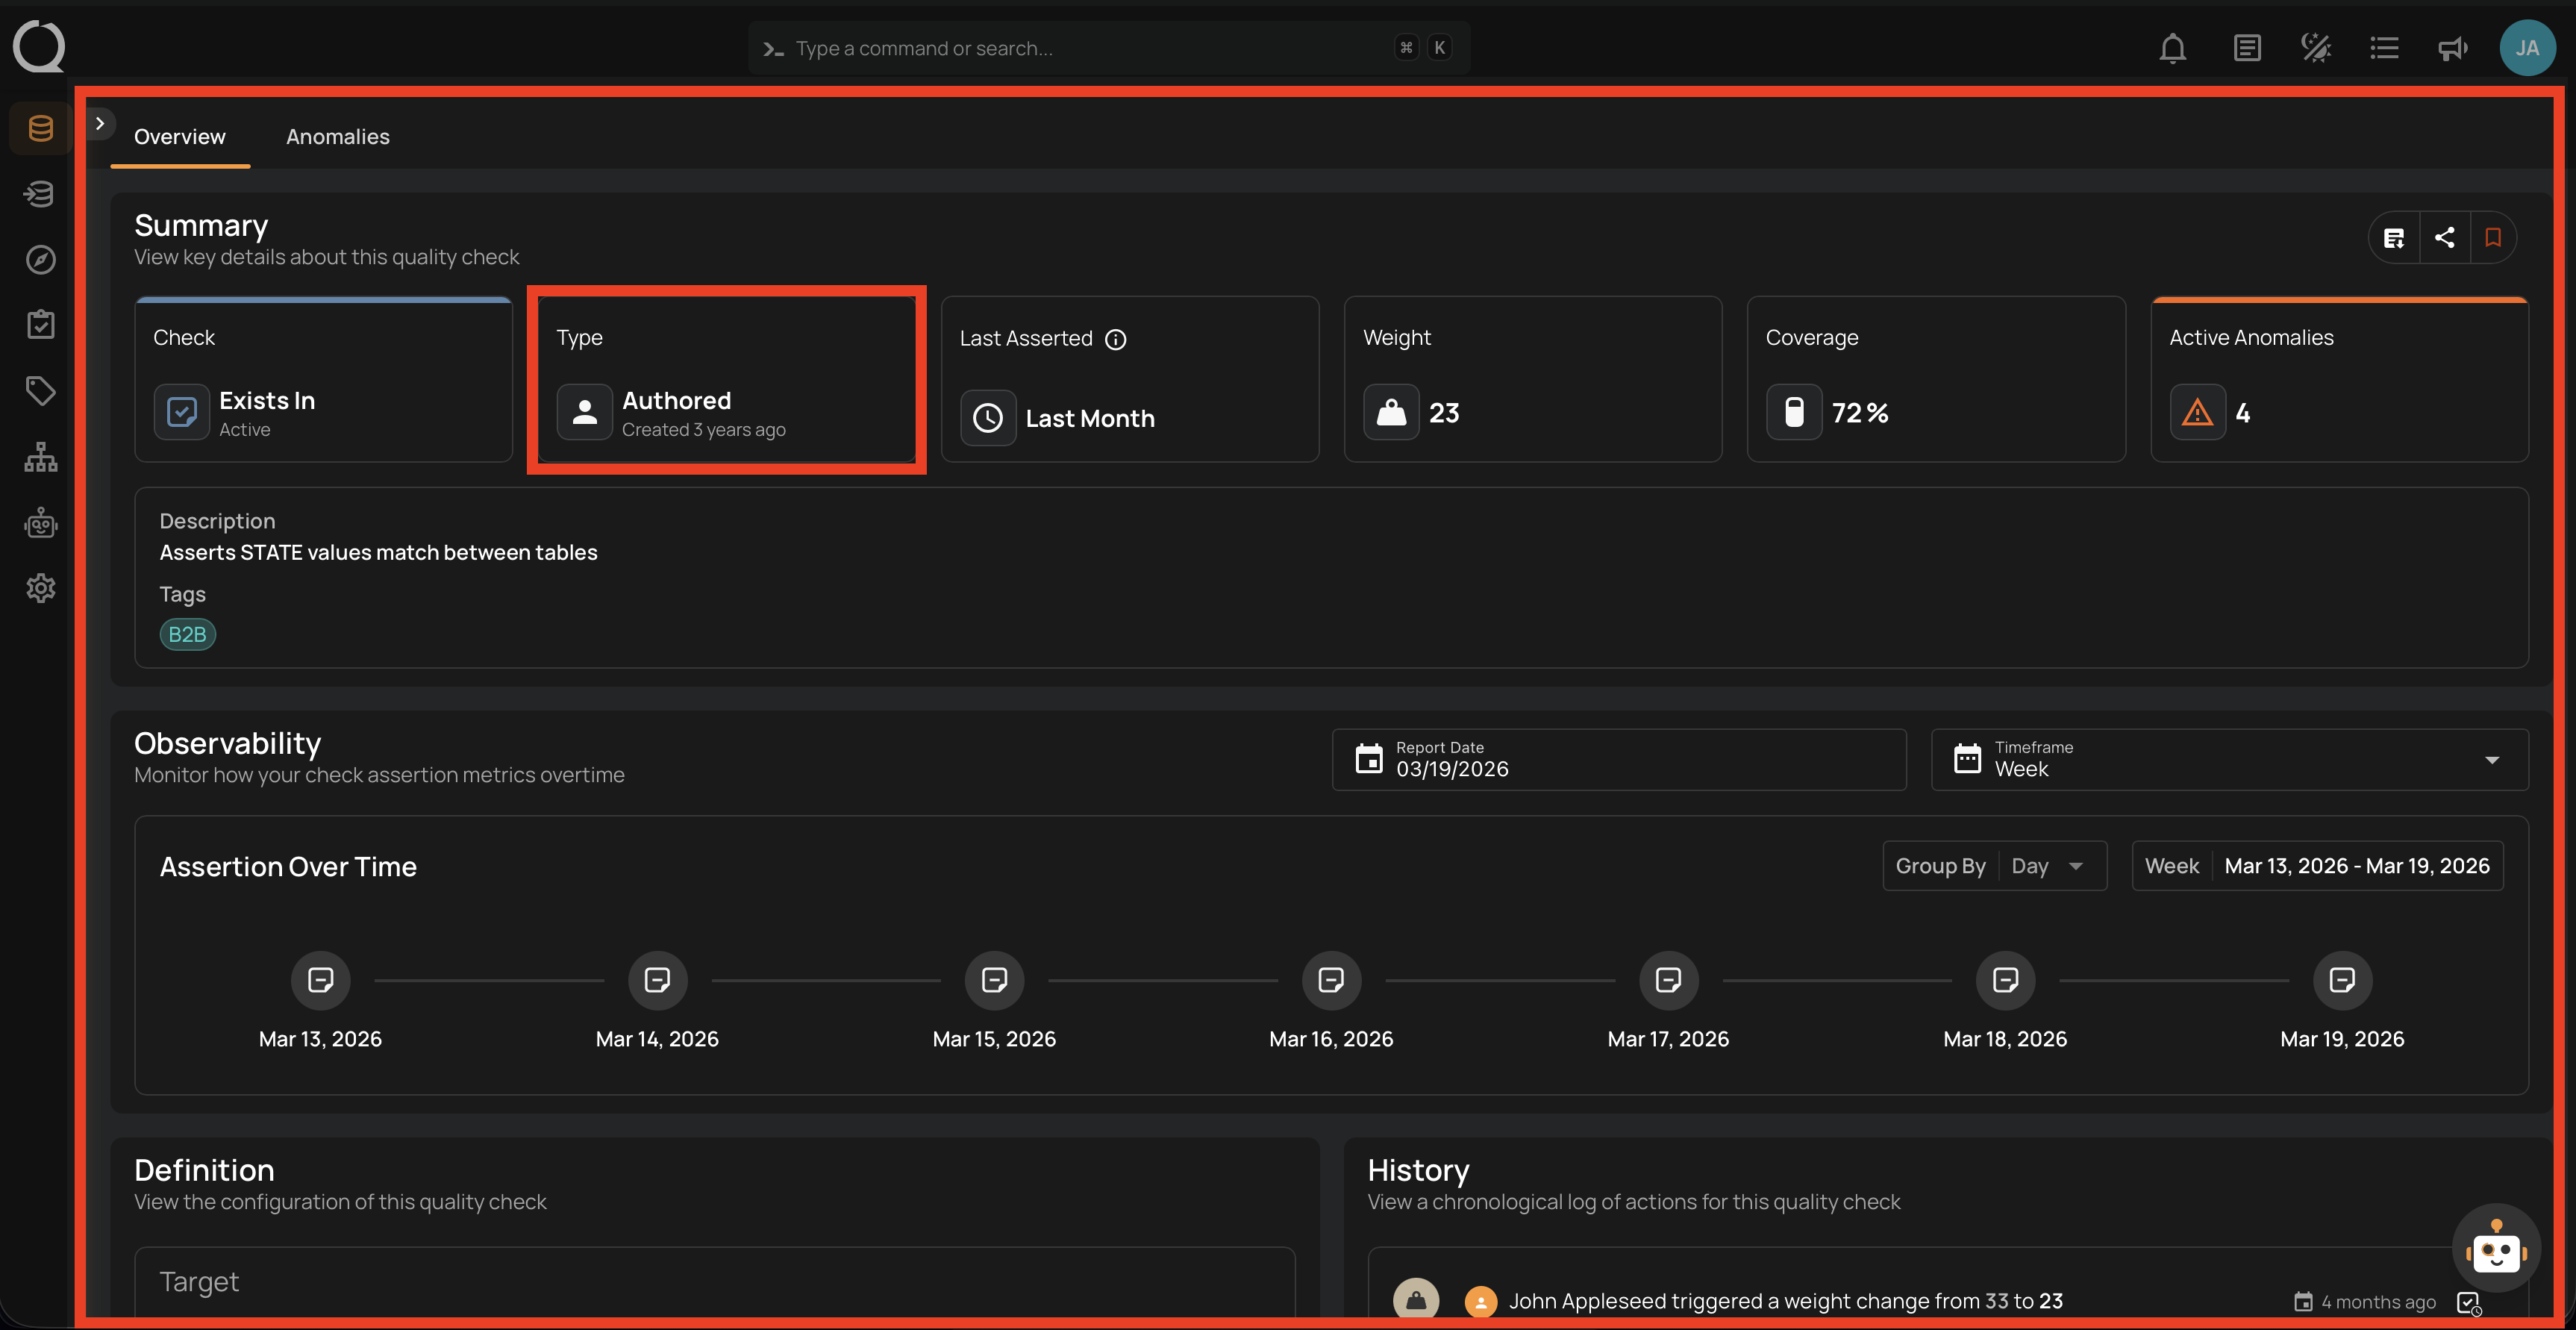
2. Authored Checks
- Manually created by users.
- Owned by a user: the Owner card on the check's overview names who is responsible for it, while AI Managed checks stay under Qualytics ownership.
- Capture business rules and known expectations that observed patterns cannot provide.
- Range from guided rule types to advanced SQL expressions.
- Can be saved as check templates and applied to compatible data.
Platform Navigation
Explore Dashboard
Explore brings recorded quality signals and operation history together across the source datastores you can access:
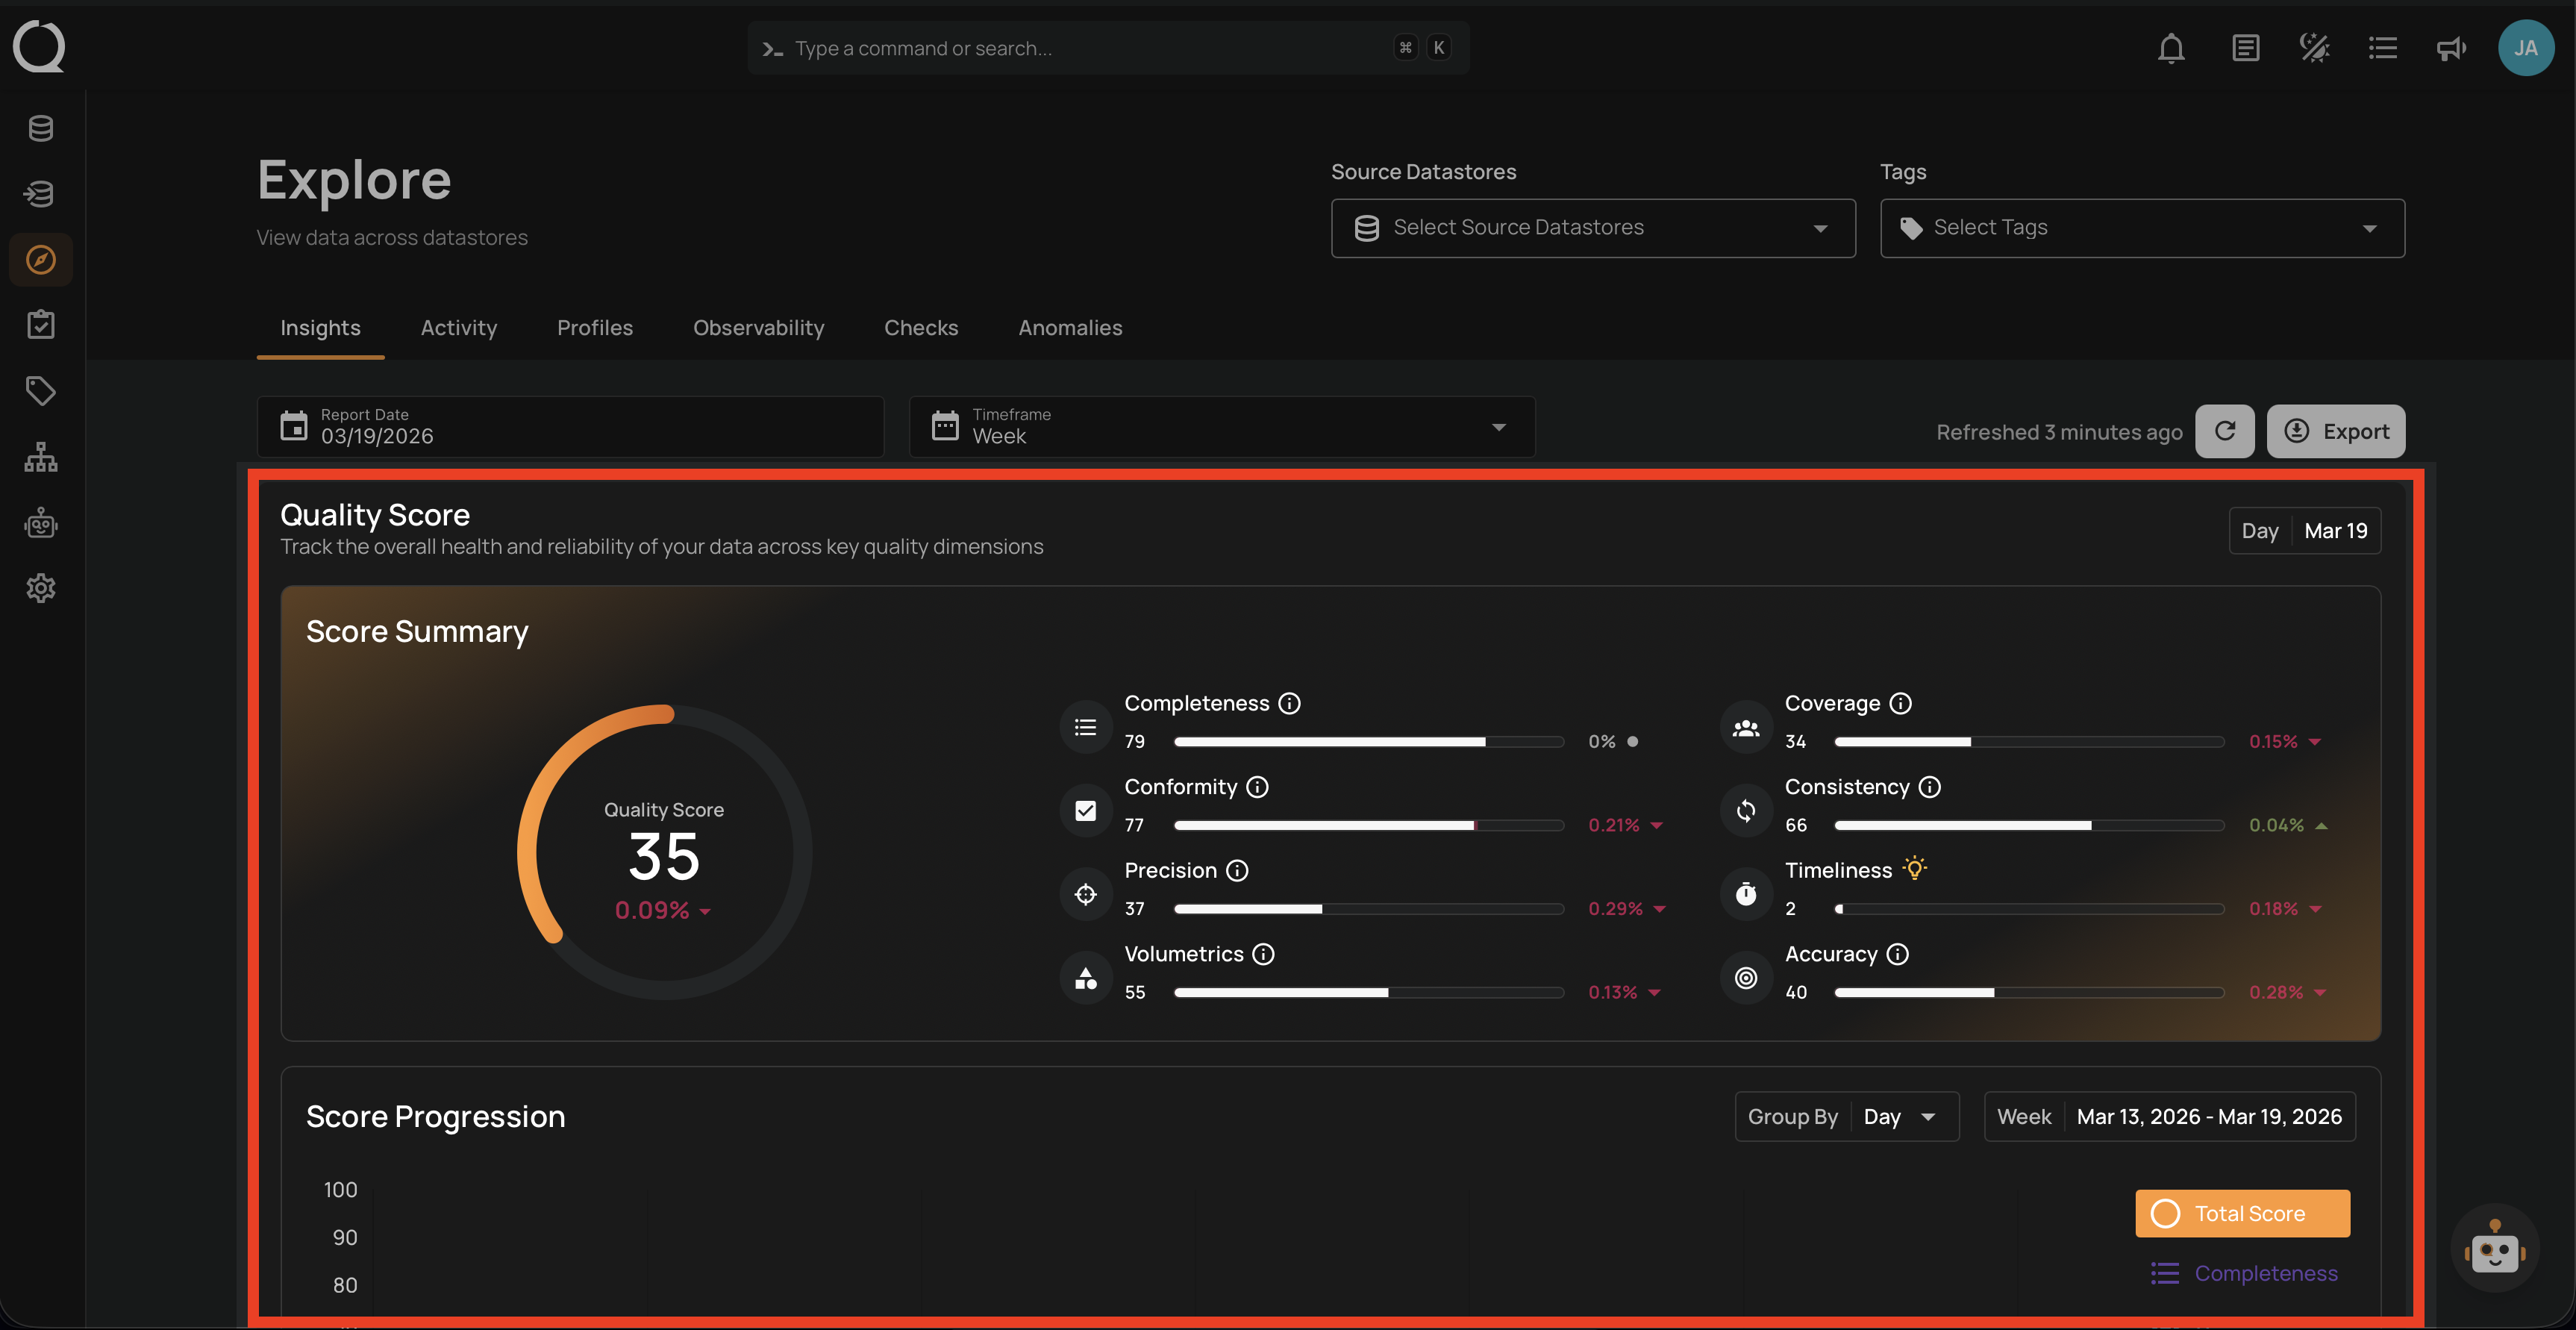
1. Insights
- Recorded quality scores, active checks, and anomalies.
- Profile and Scan activity.
- Filter by Source Datastores and Tags, then select a Report Date and Timeframe.
2. Activity
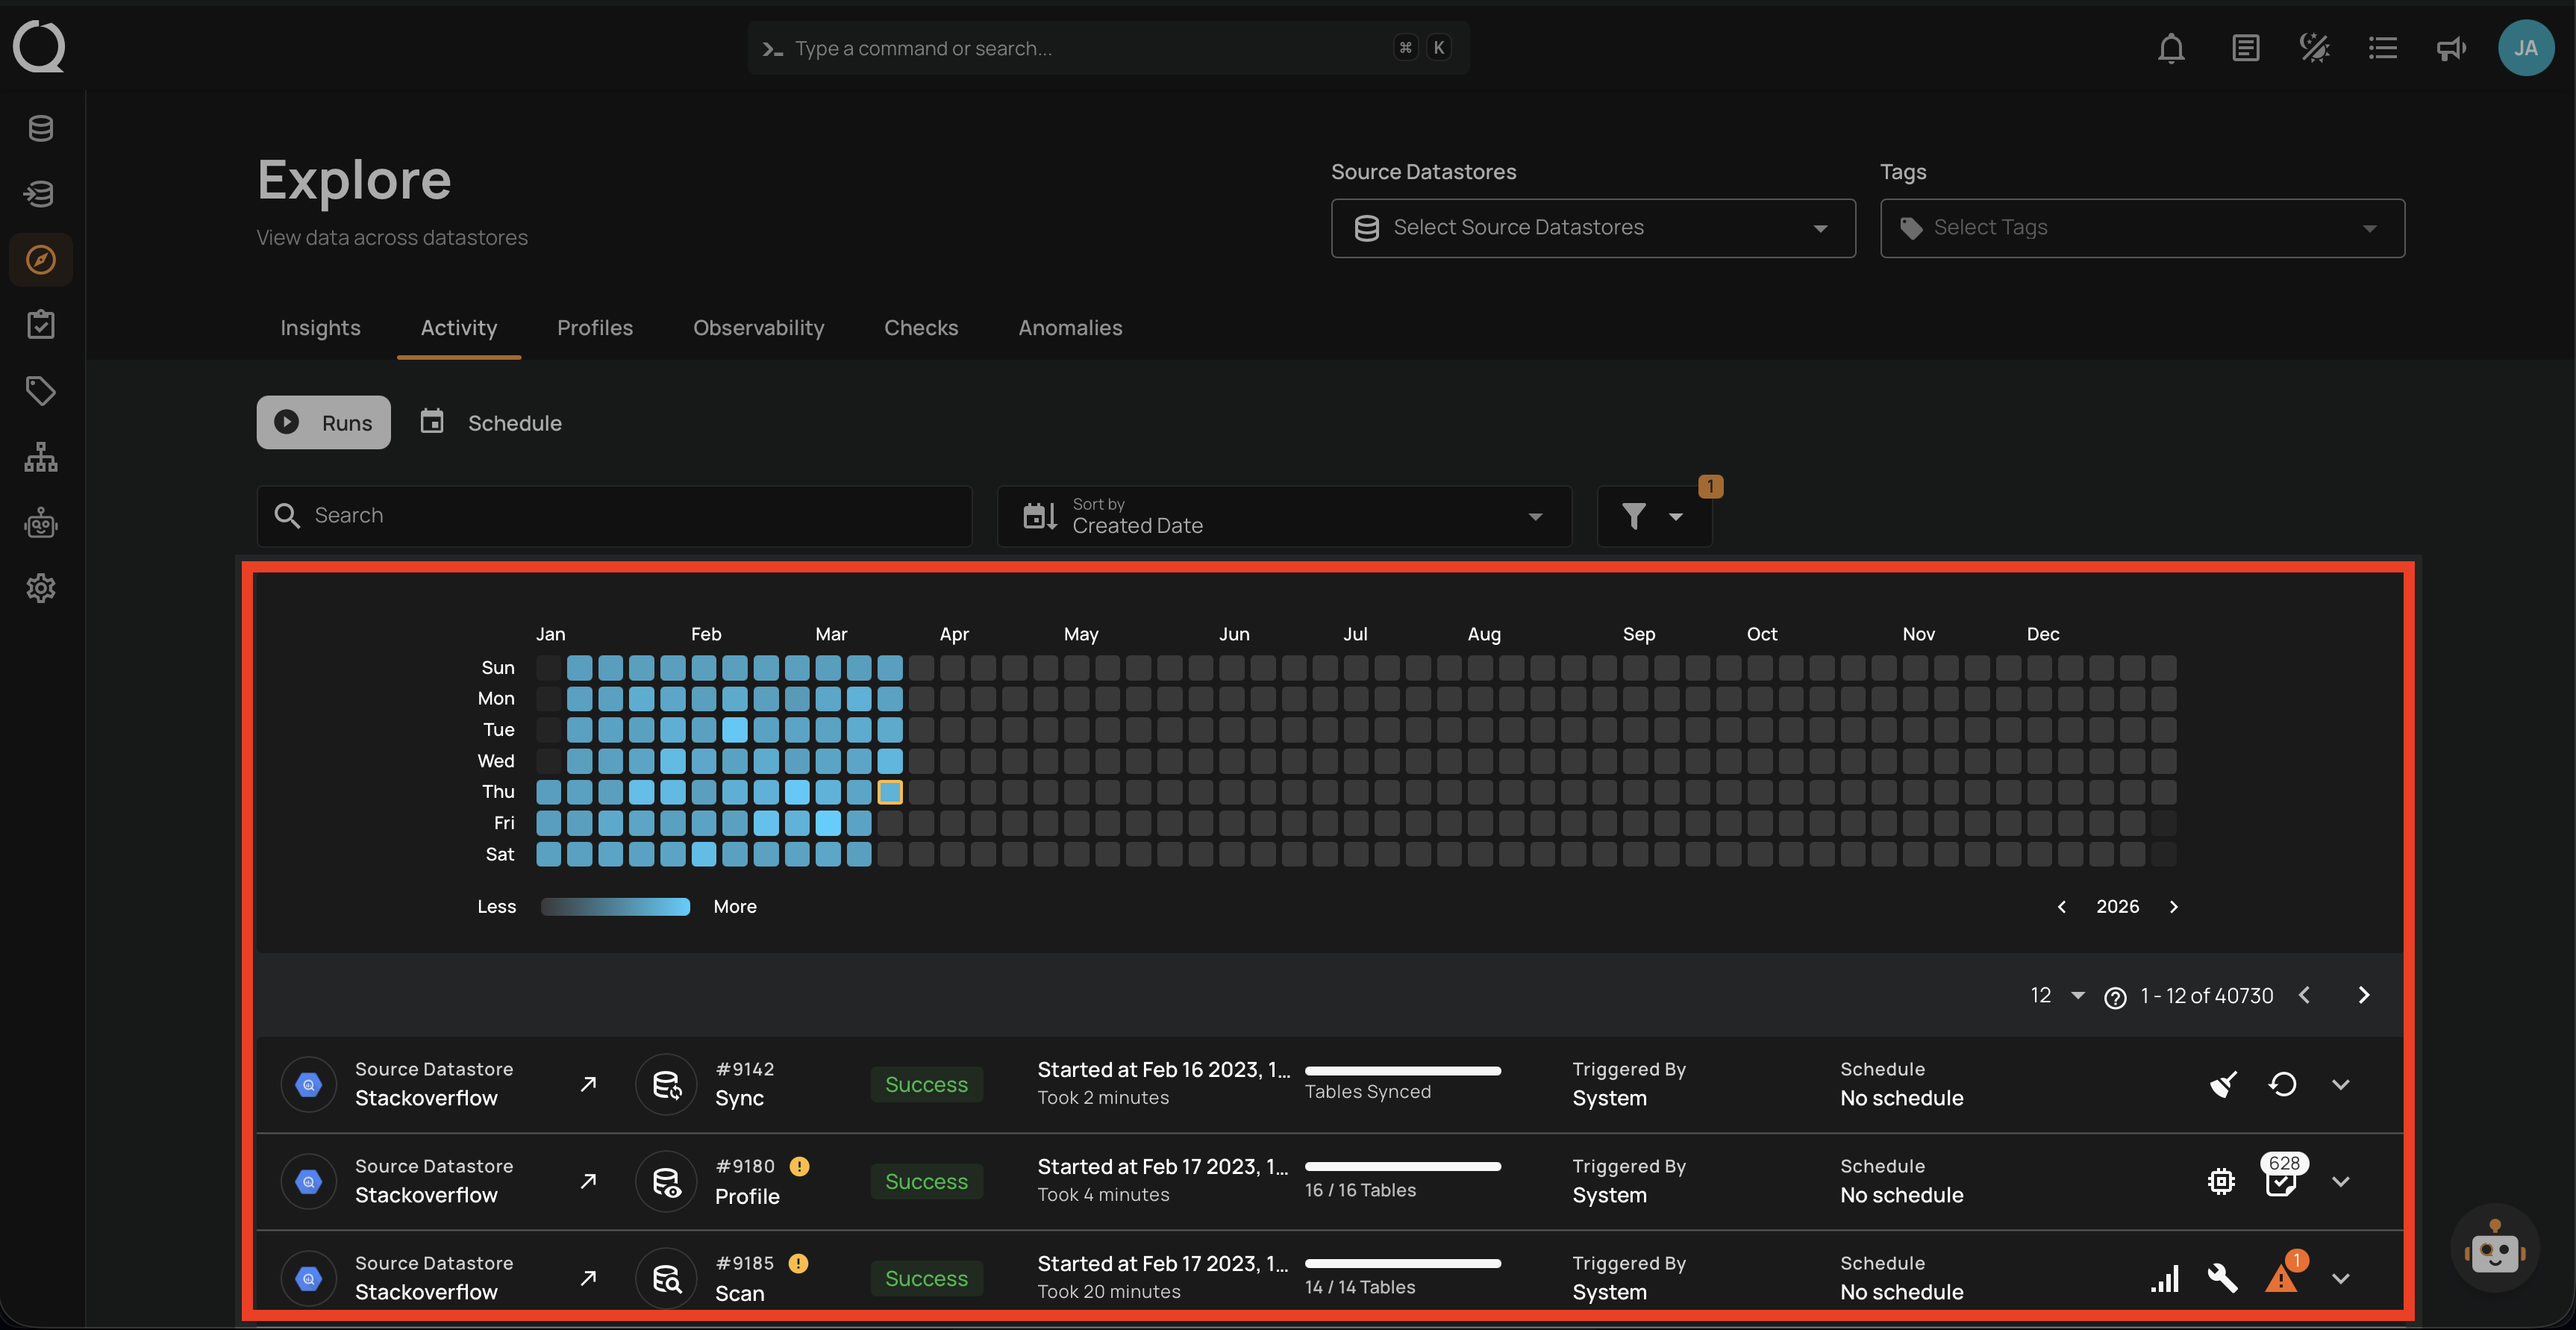
- Review operation history, status, results, and logs.
- Use the calendar heatmap to see operation counts by day.
- Review and manage operation schedules.
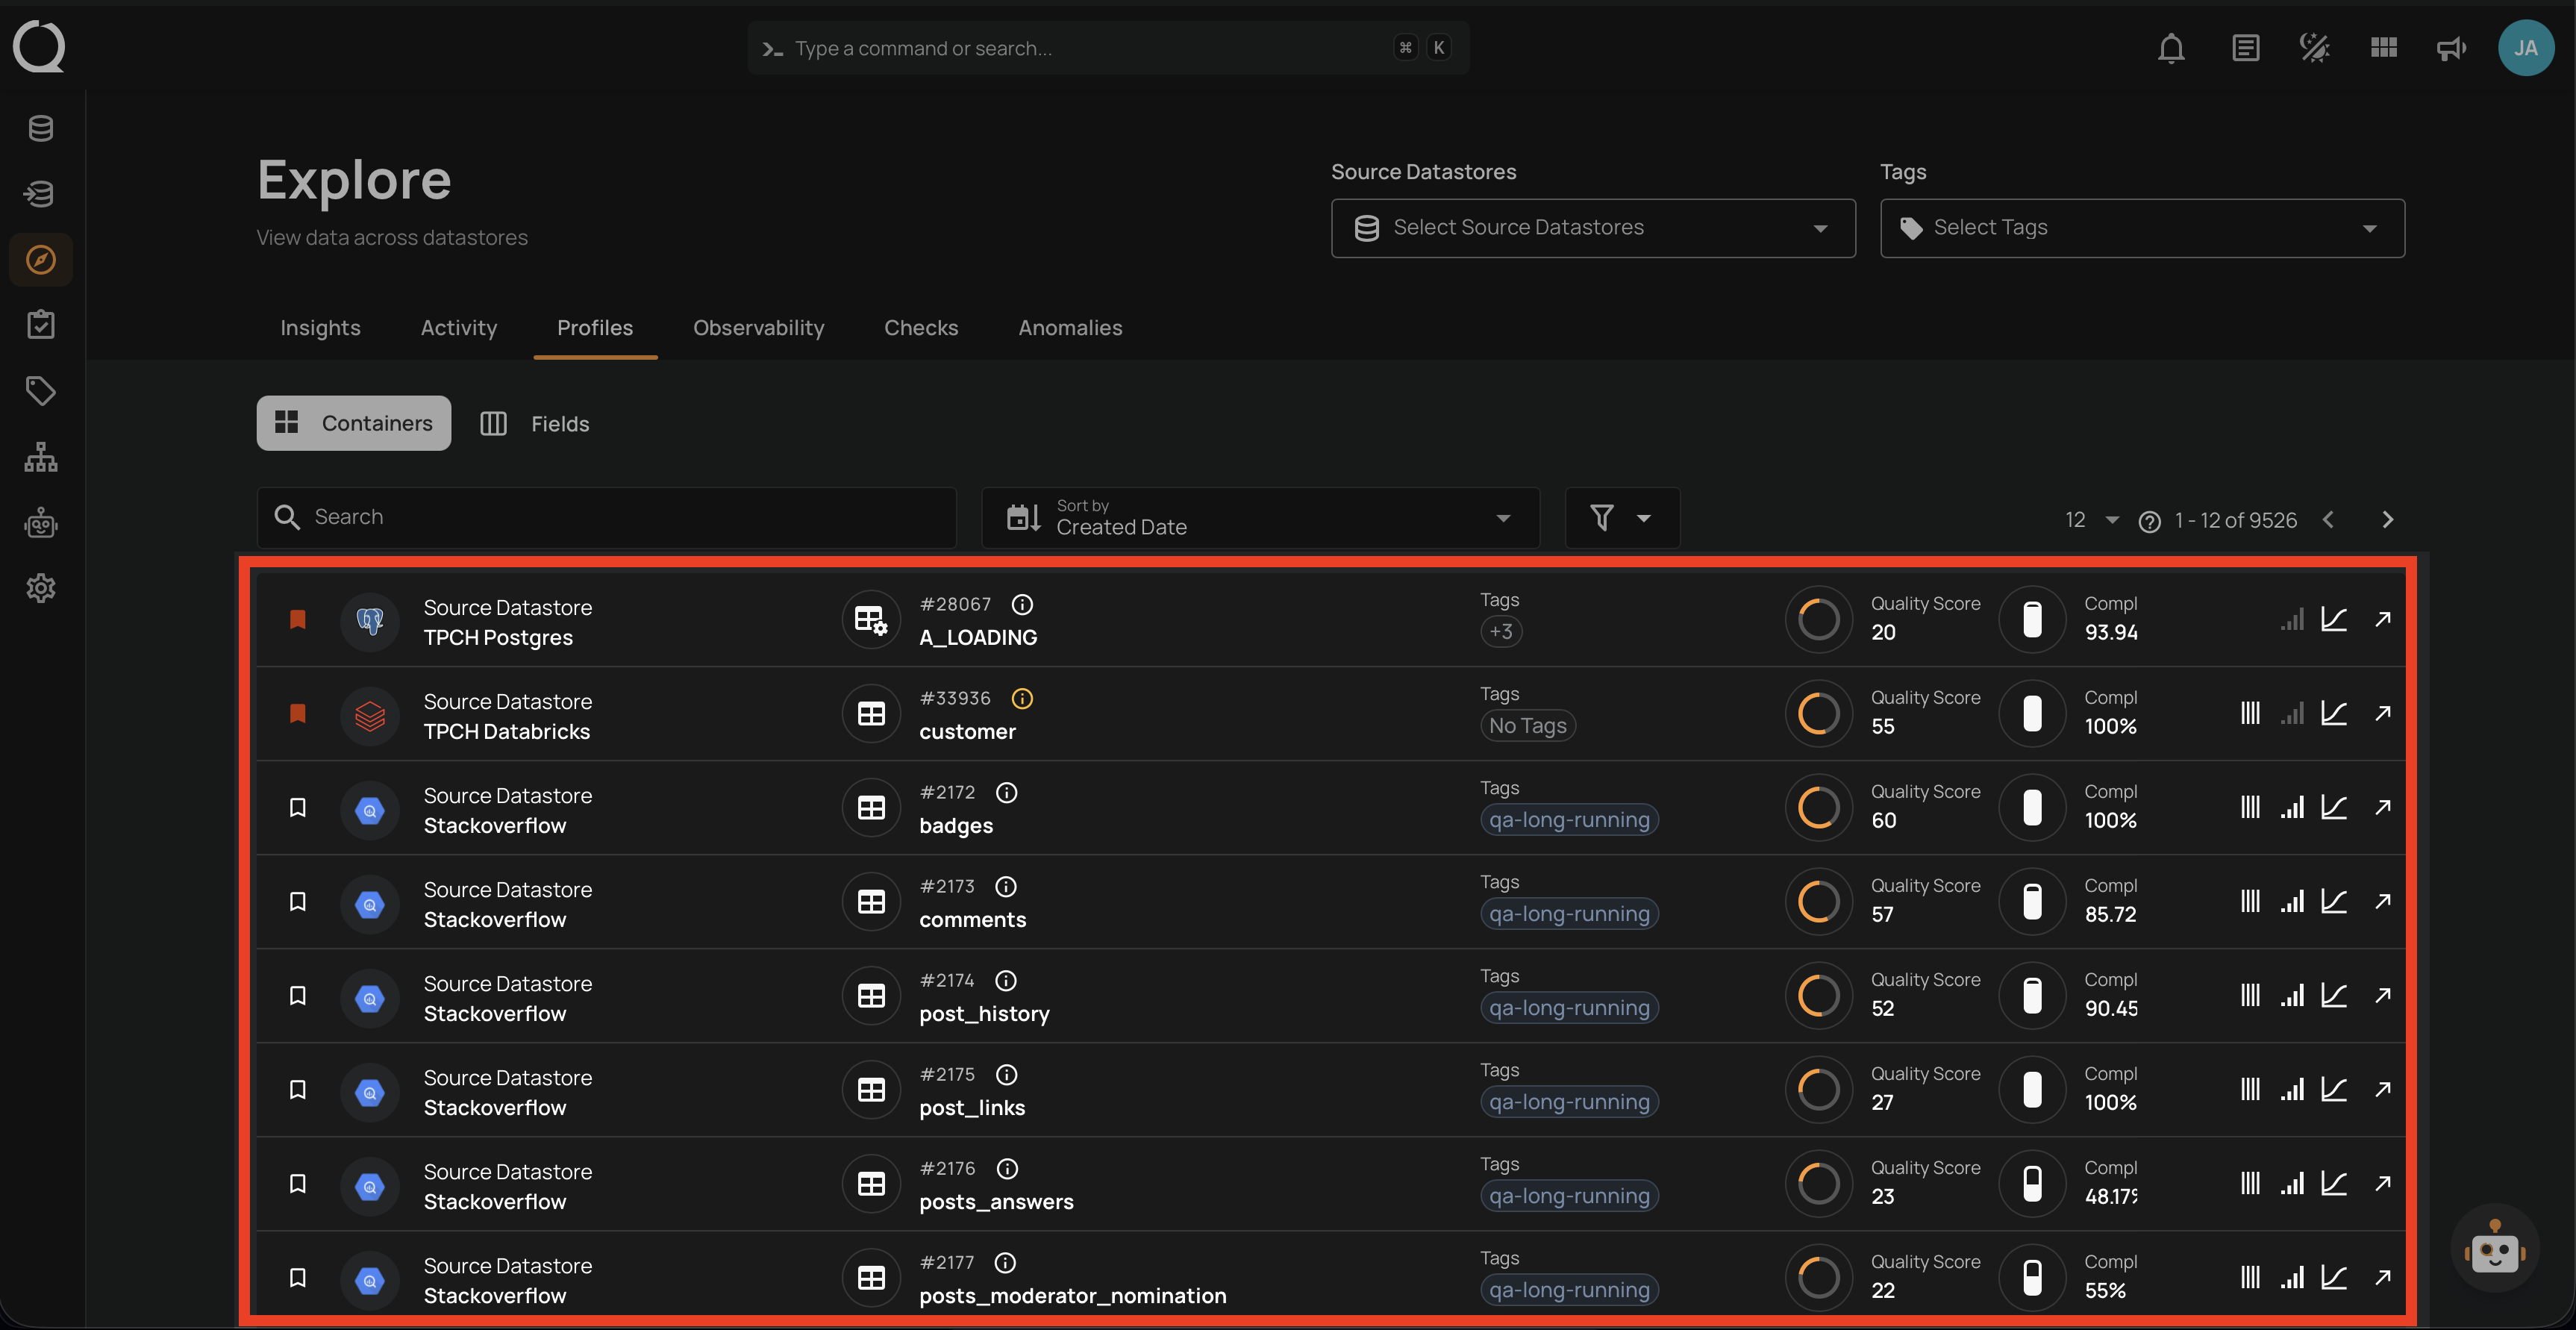
3. Profiles
Browse profiled assets across datastores you can access:
- Containers, including tables, files, and computed assets.
- Active, masked, missing, and excluded fields.
4. Observability
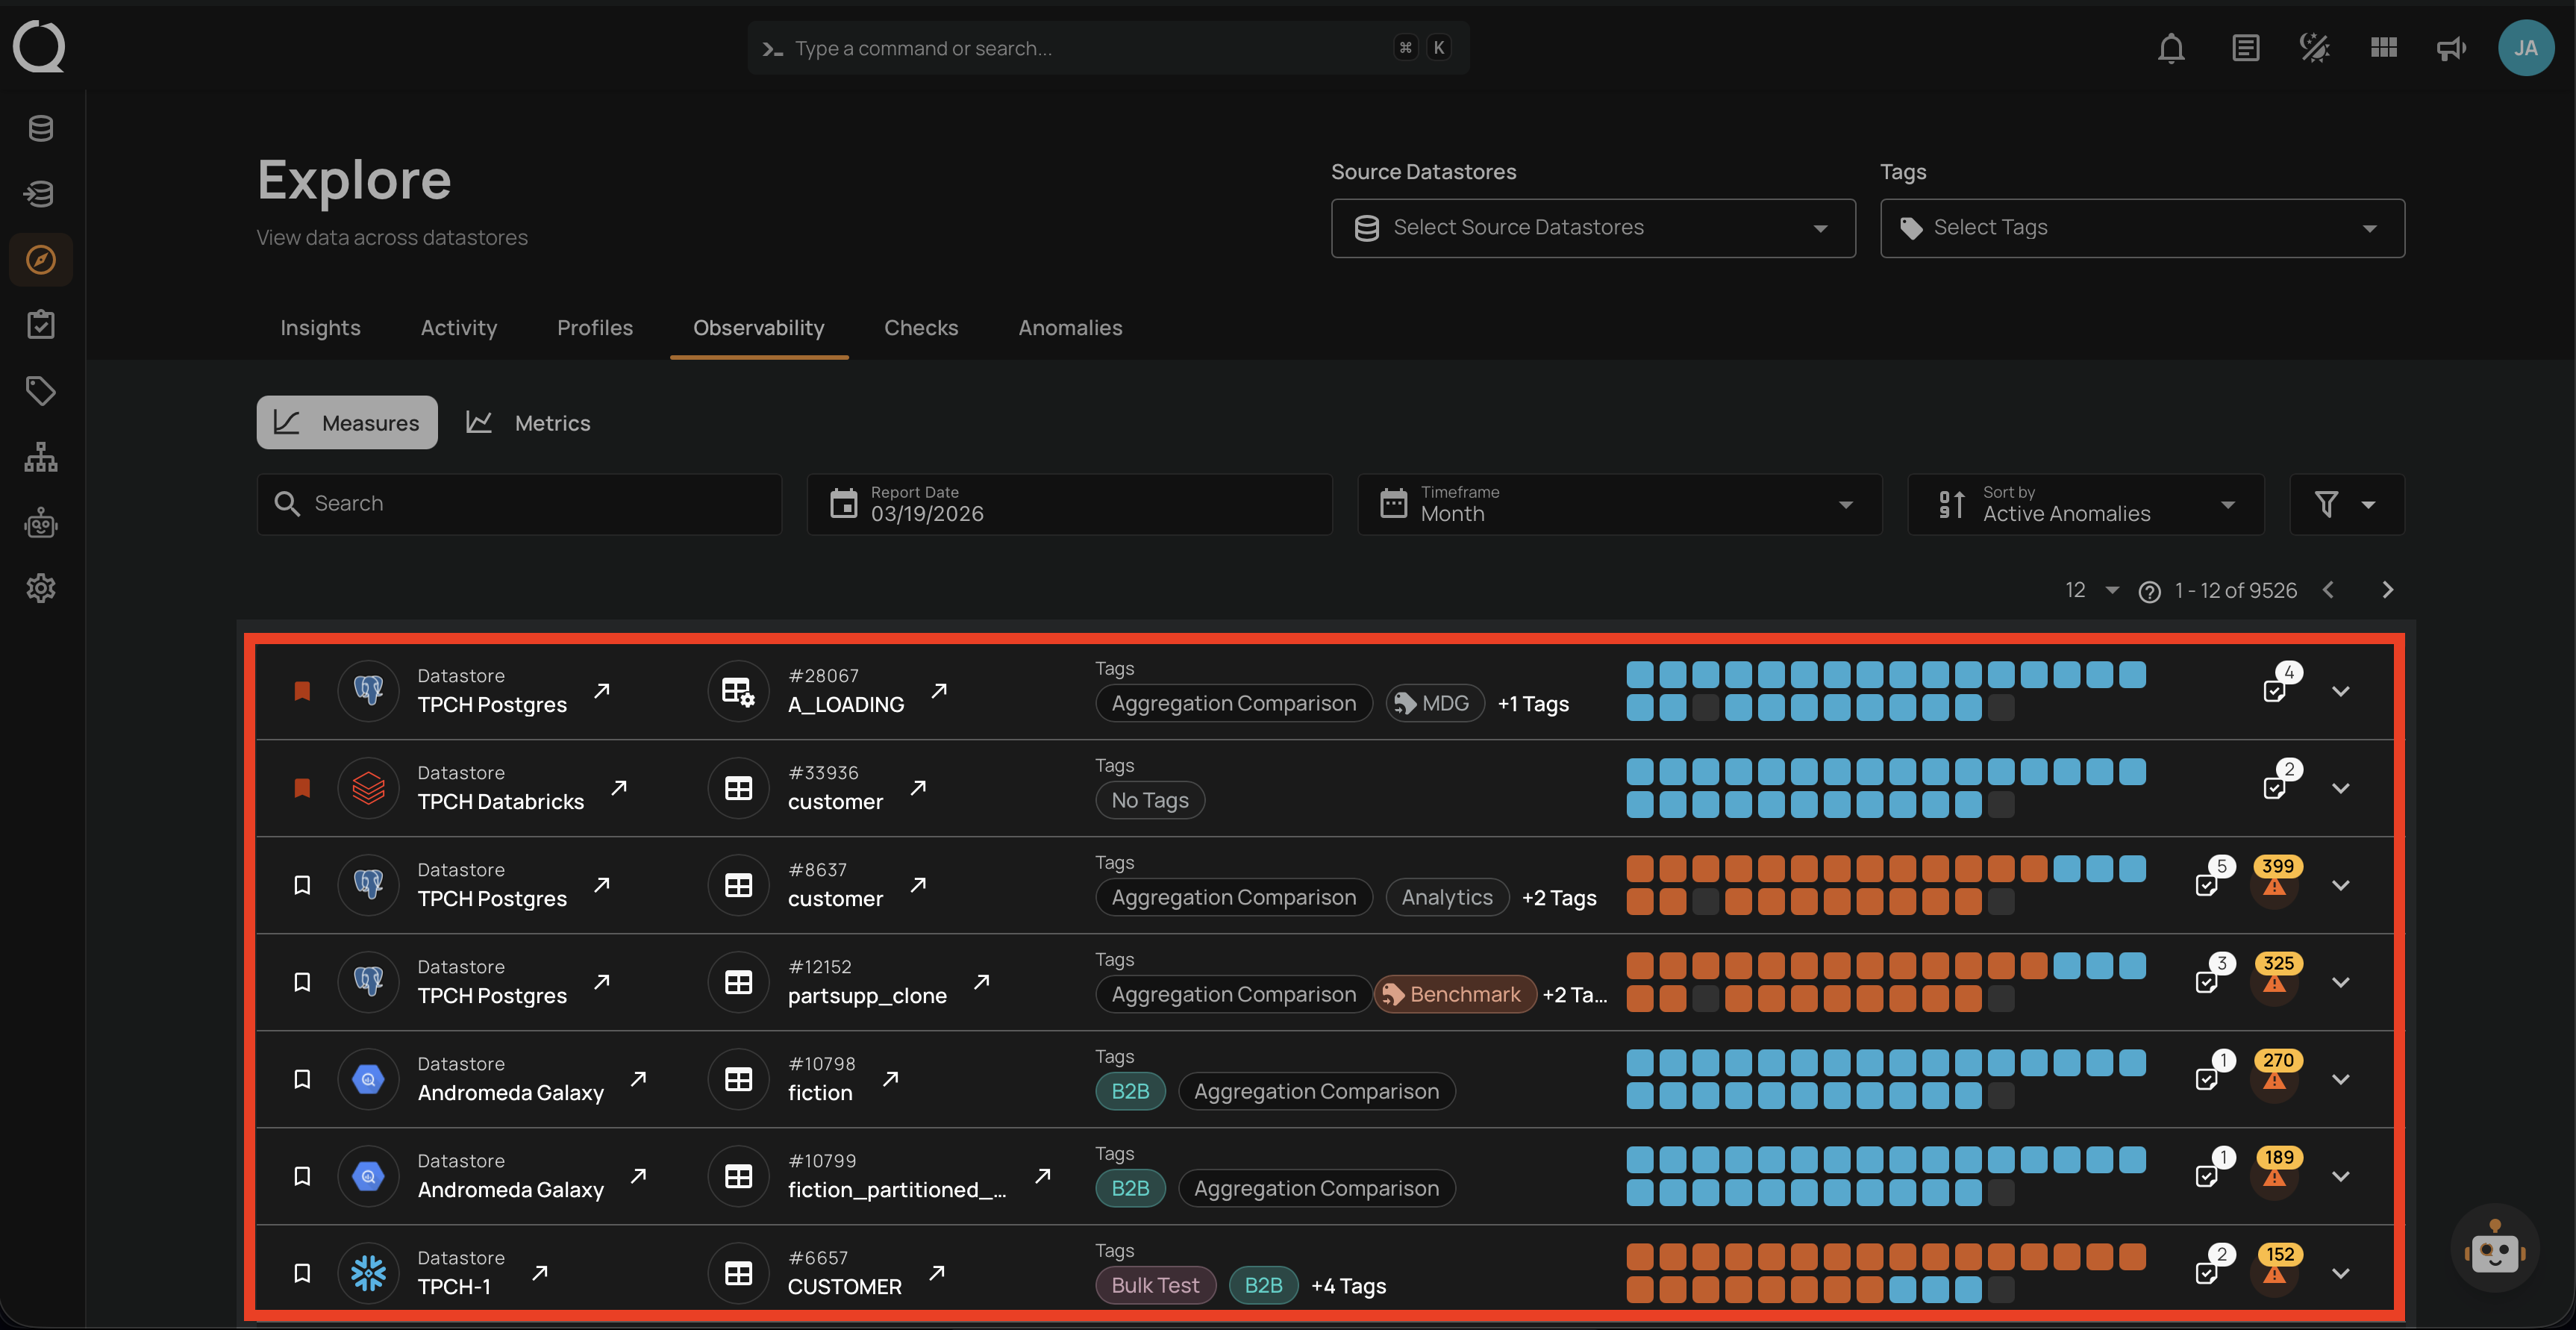
Review volume, freshness, and field-level measurements:
- Volumetric and Freshness measurements recorded on their configured schedule.
- Metric measurements recorded by relevant Profile and Scan operations.
- Charts and anomalies produced when observability checks evaluate those measurements.
5. Checks
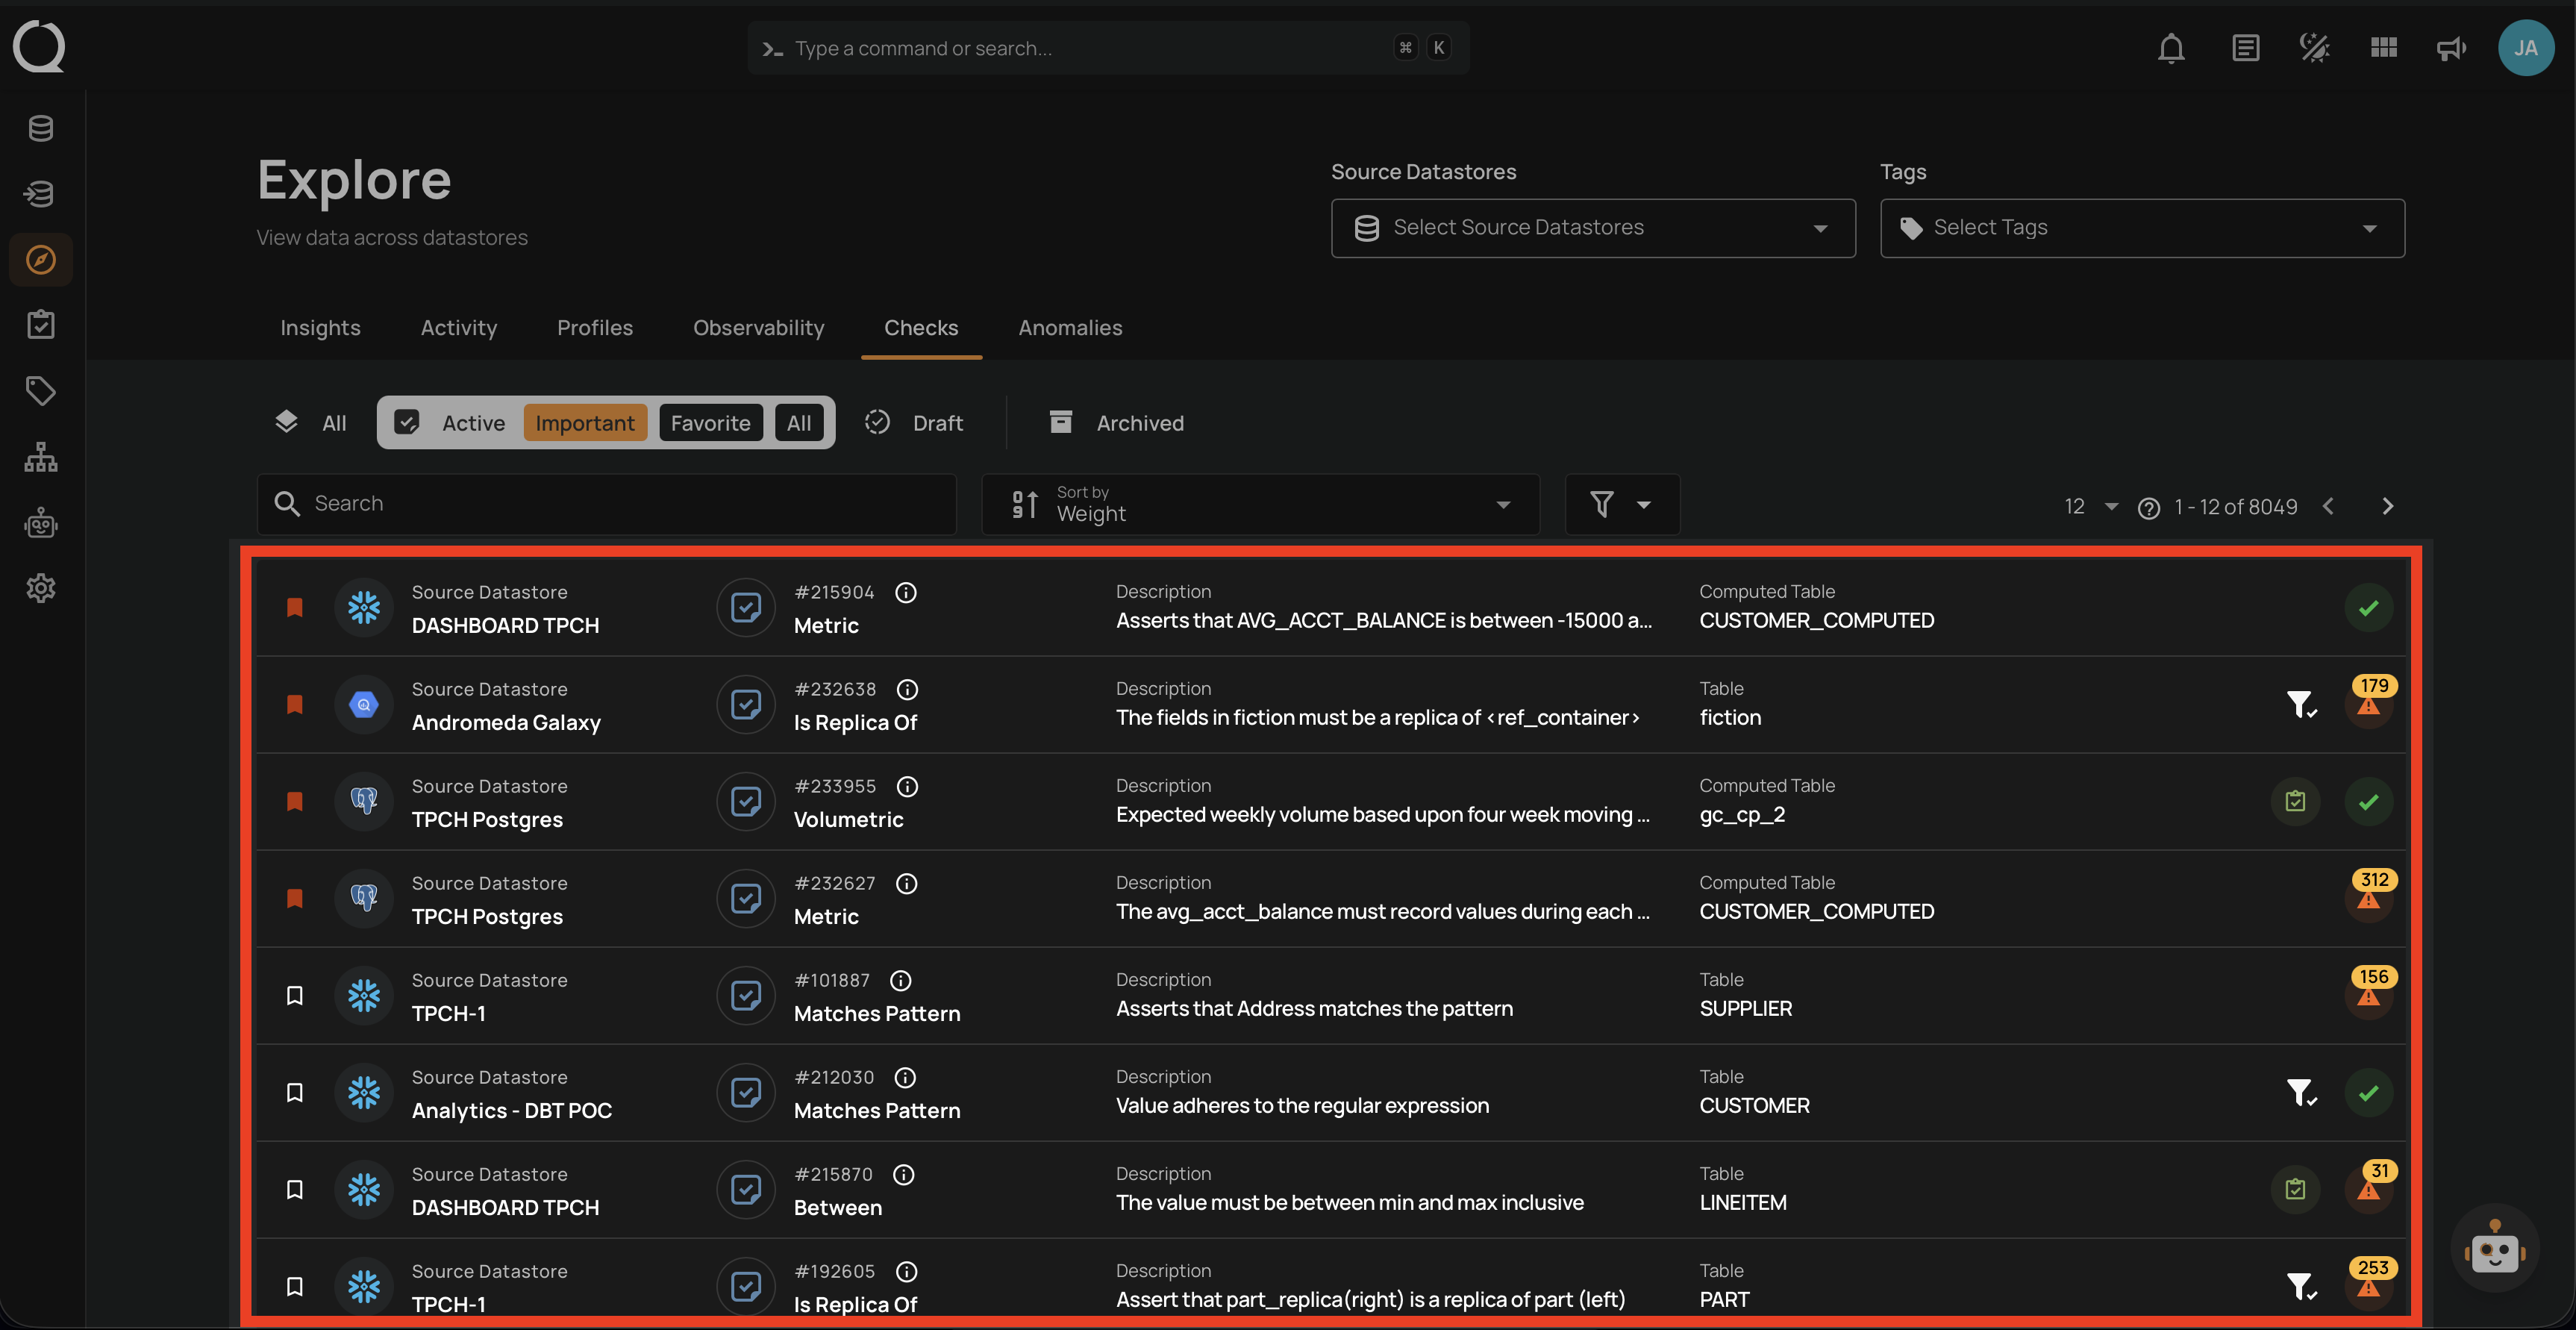
Unified view of all data quality validations across datastores:
- Use All, Active, Draft, or Archived; narrow Active and Draft checks by Important, Owned, Favorite, or All.
- Narrow the list by datastore and tags at the top of the page, or open the filter panel for criteria such as check type, rule, template, and owner. Importance is available as a sort option.
- View validation results by table and field, including pass/fail status and anomaly counts.
6. Anomalies
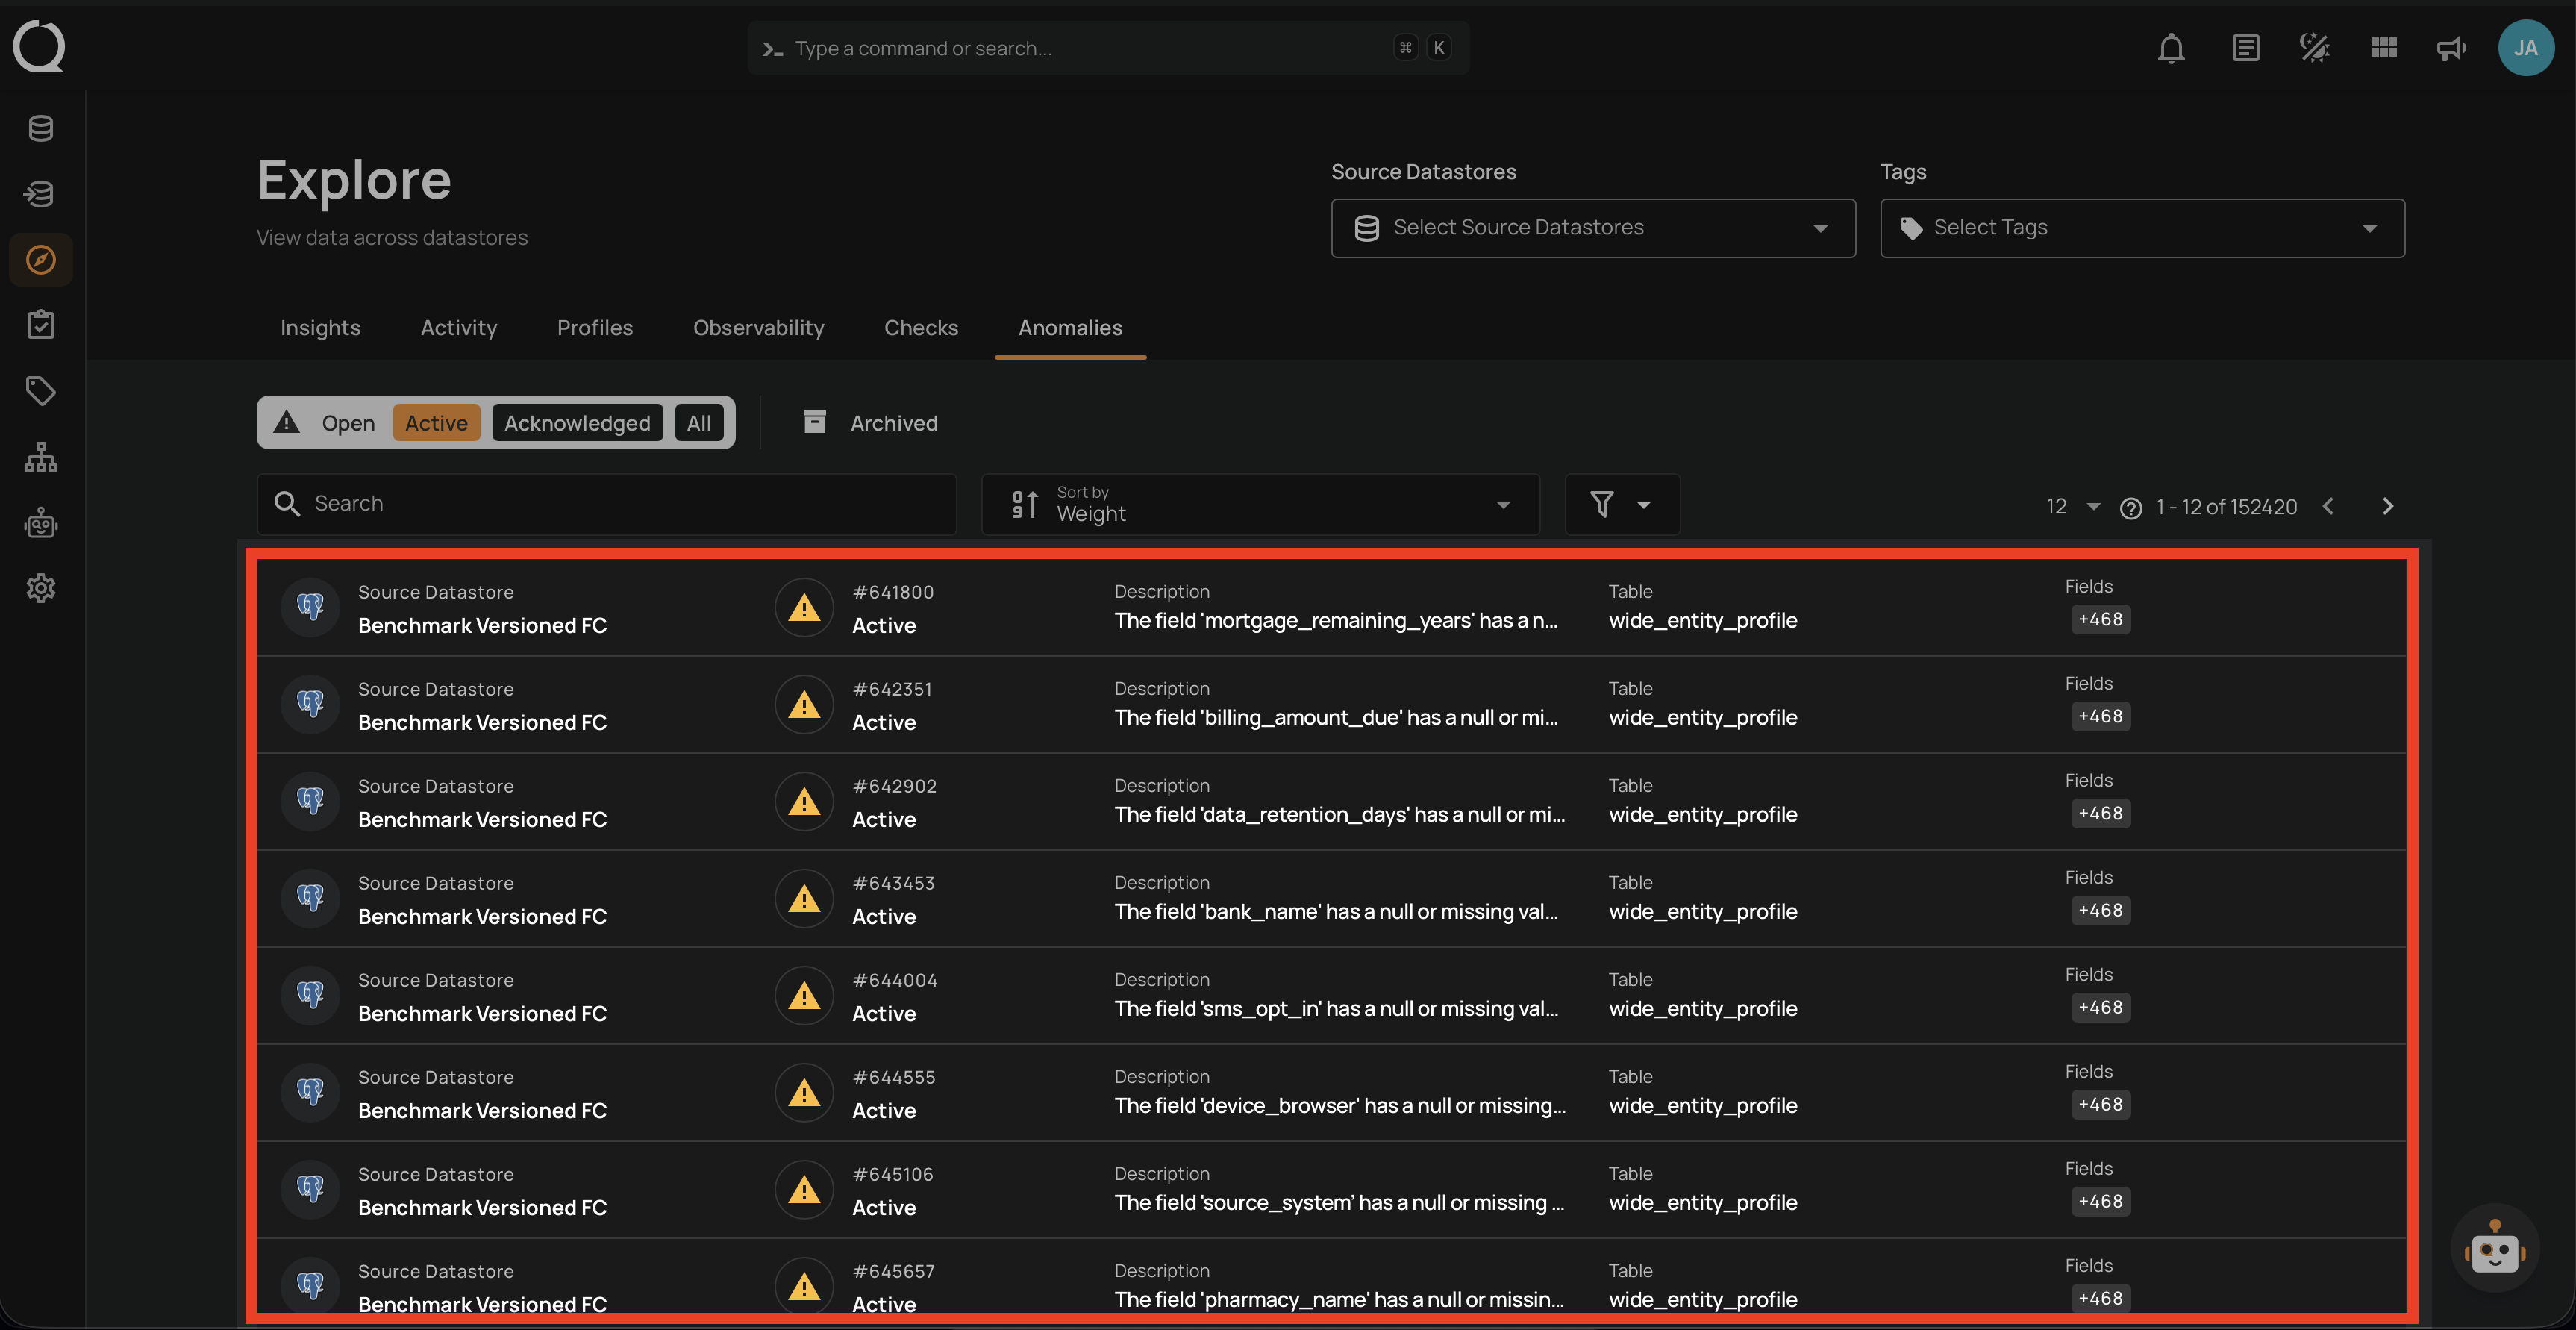
Review potential quality issues surfaced across datastores:
- Review open anomalies by Active, Acknowledged, Assigned, or All, and archived anomalies by resolution status.
- View the datastore, container, affected fields, failed checks, and detection date.
- Use severity, assignee, and status to prioritize investigation. Review aggregate trends in Insights.
Configure Responses and Access
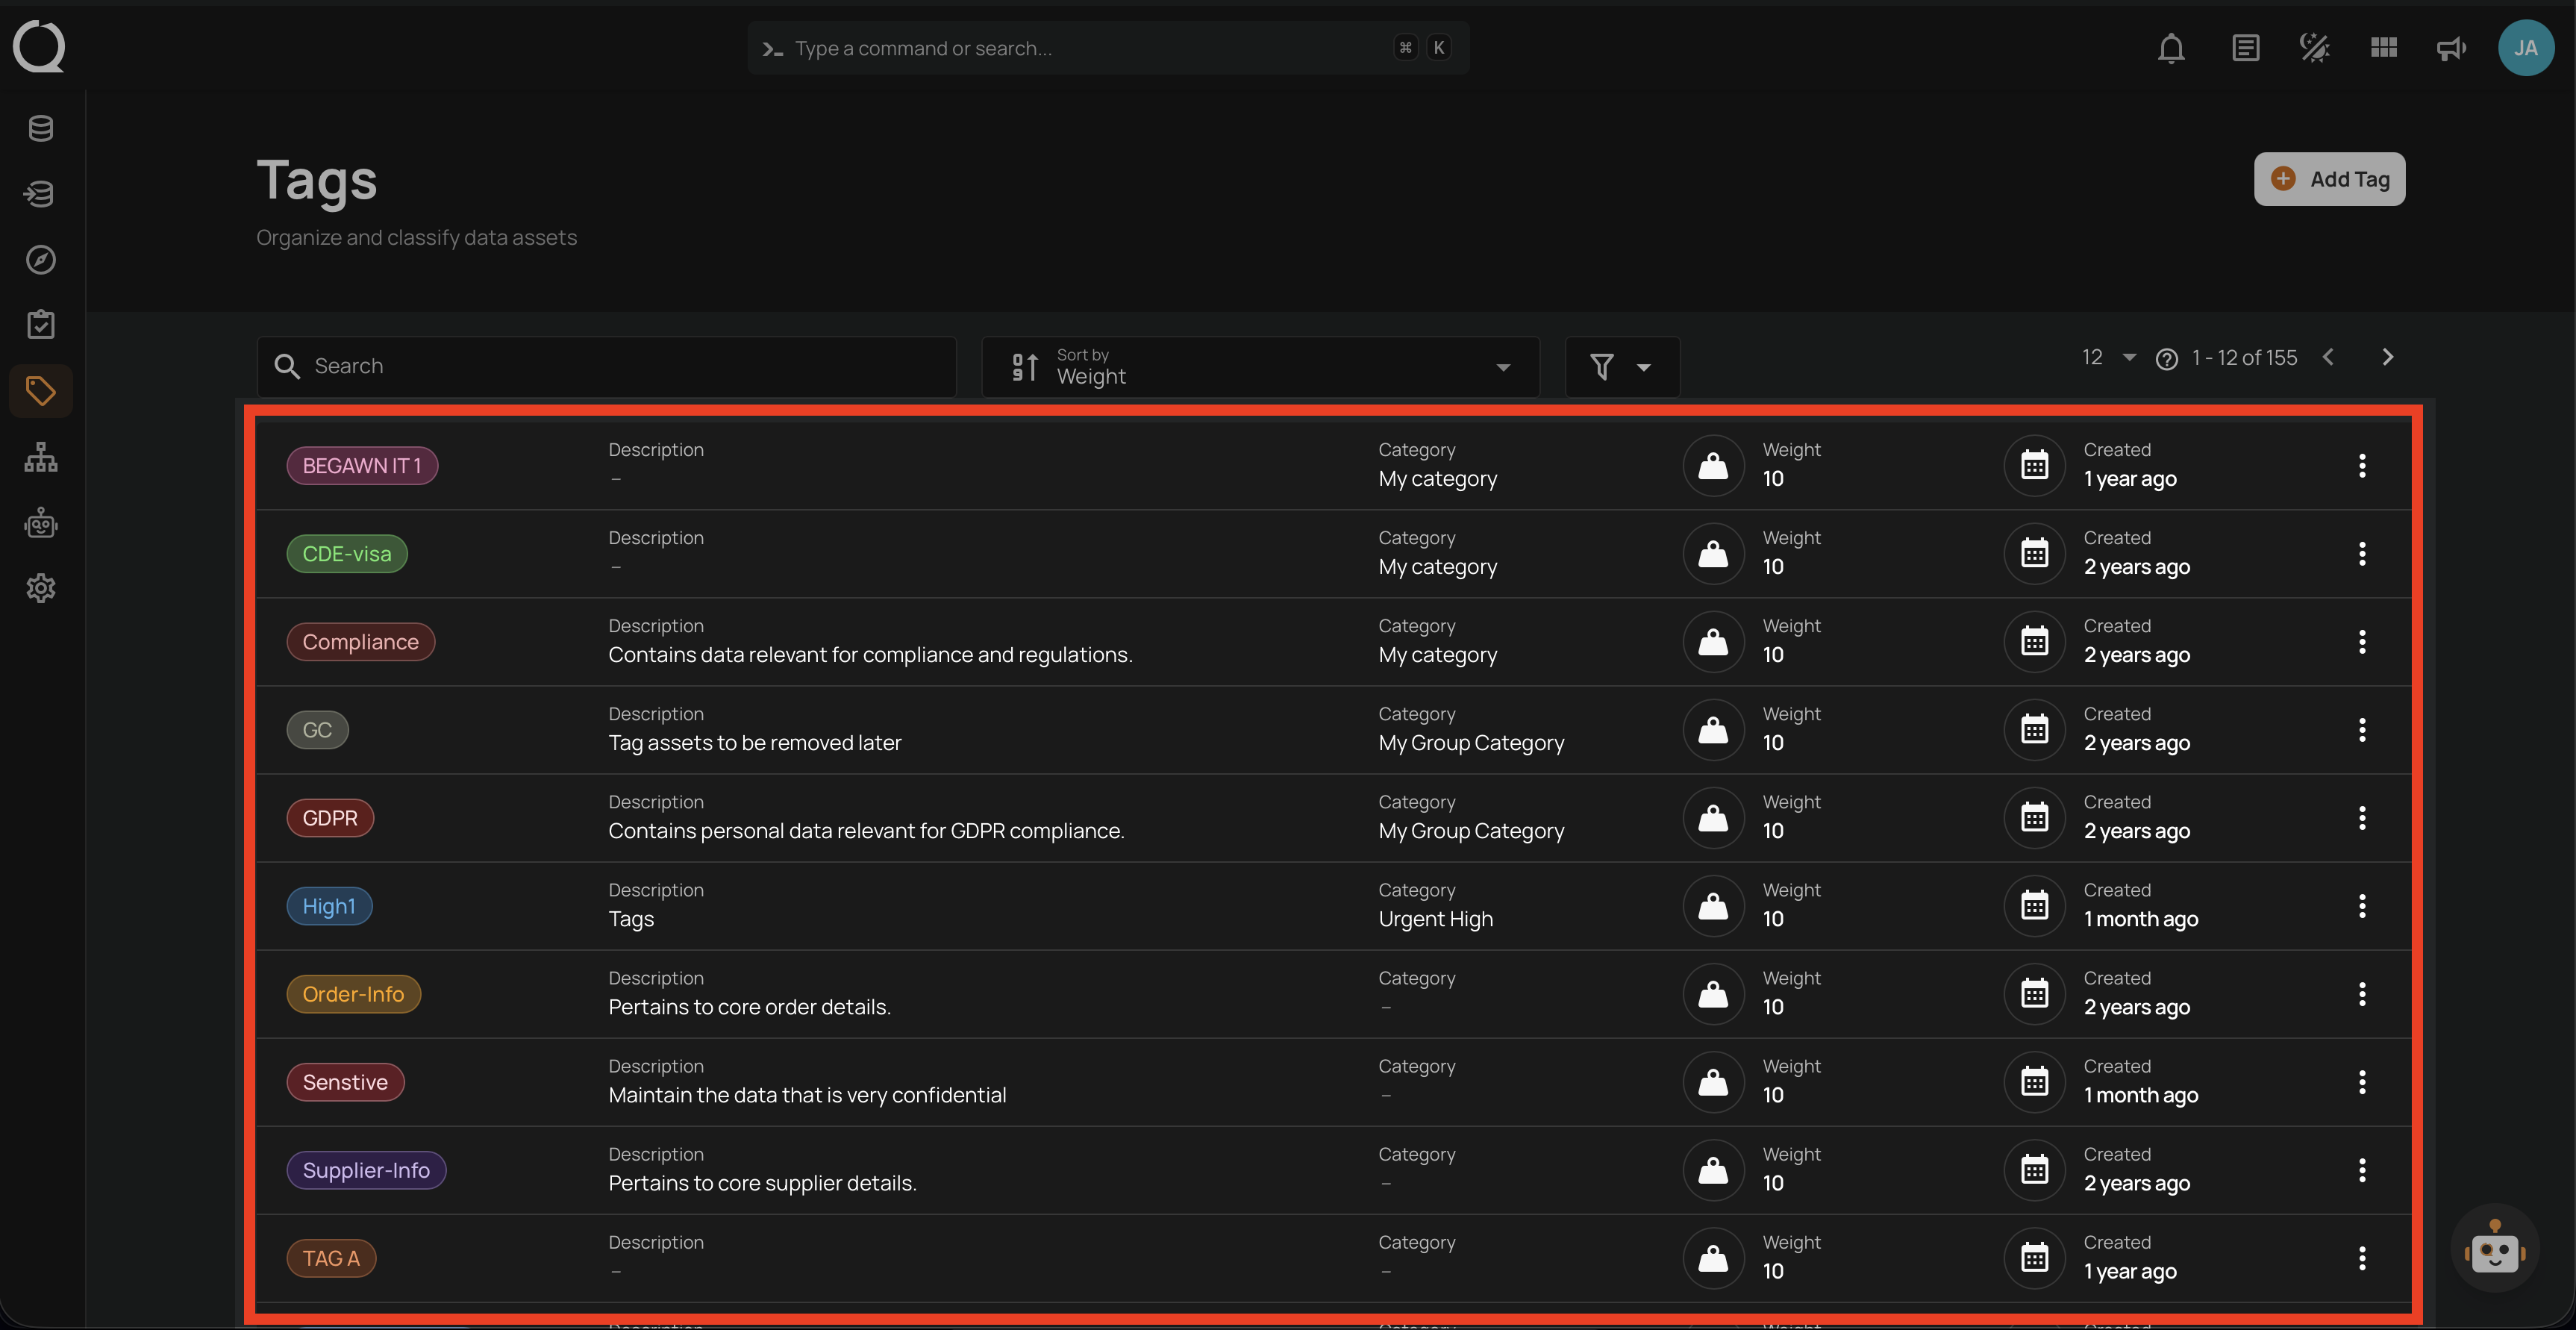
Tags
Use shared business context to organize and prioritize work:
- Categorize assets with shared business context.
- Use tags in Explore filters, operation scope, and Flow conditions.
- Use weight modifiers to influence aggregate quality scores and anomaly priority.
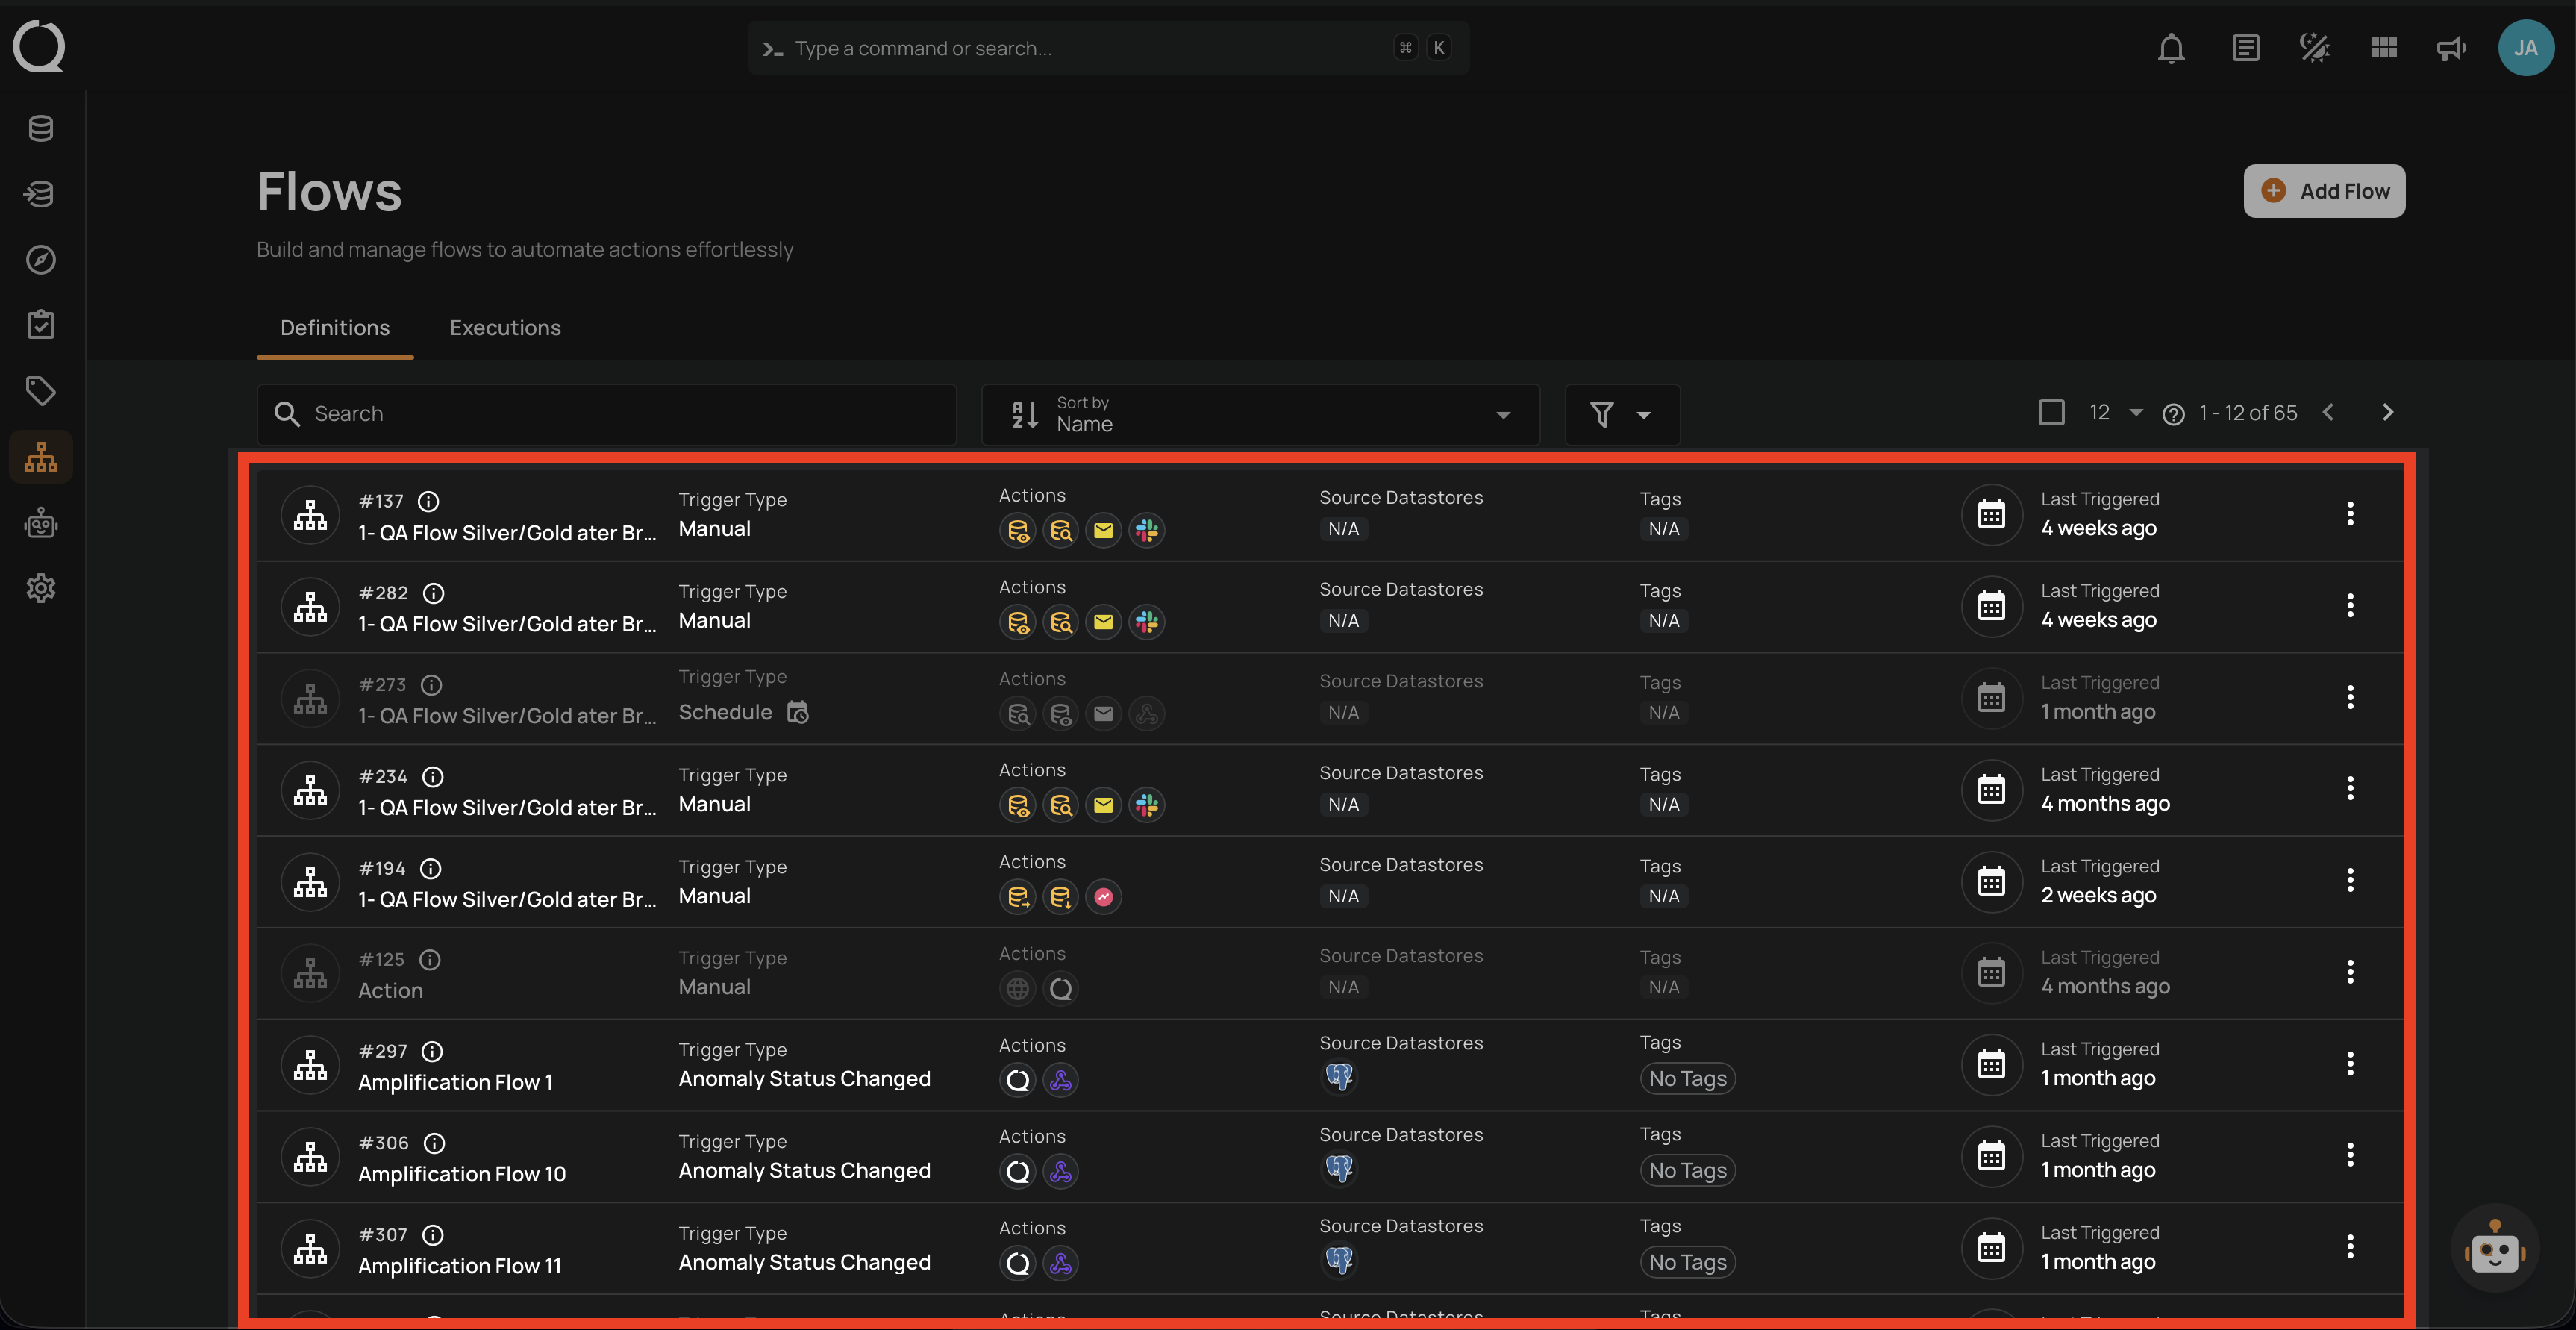
Flows
Coordinate supported responses:
- Start from a schedule, manual run, supported operation, or matching anomaly event.
- Run supported operations, update anomalies, or send configured notifications, tickets, and workflow requests.
- Review execution status and timestamps.
Platform Settings
Access key configuration areas:
-
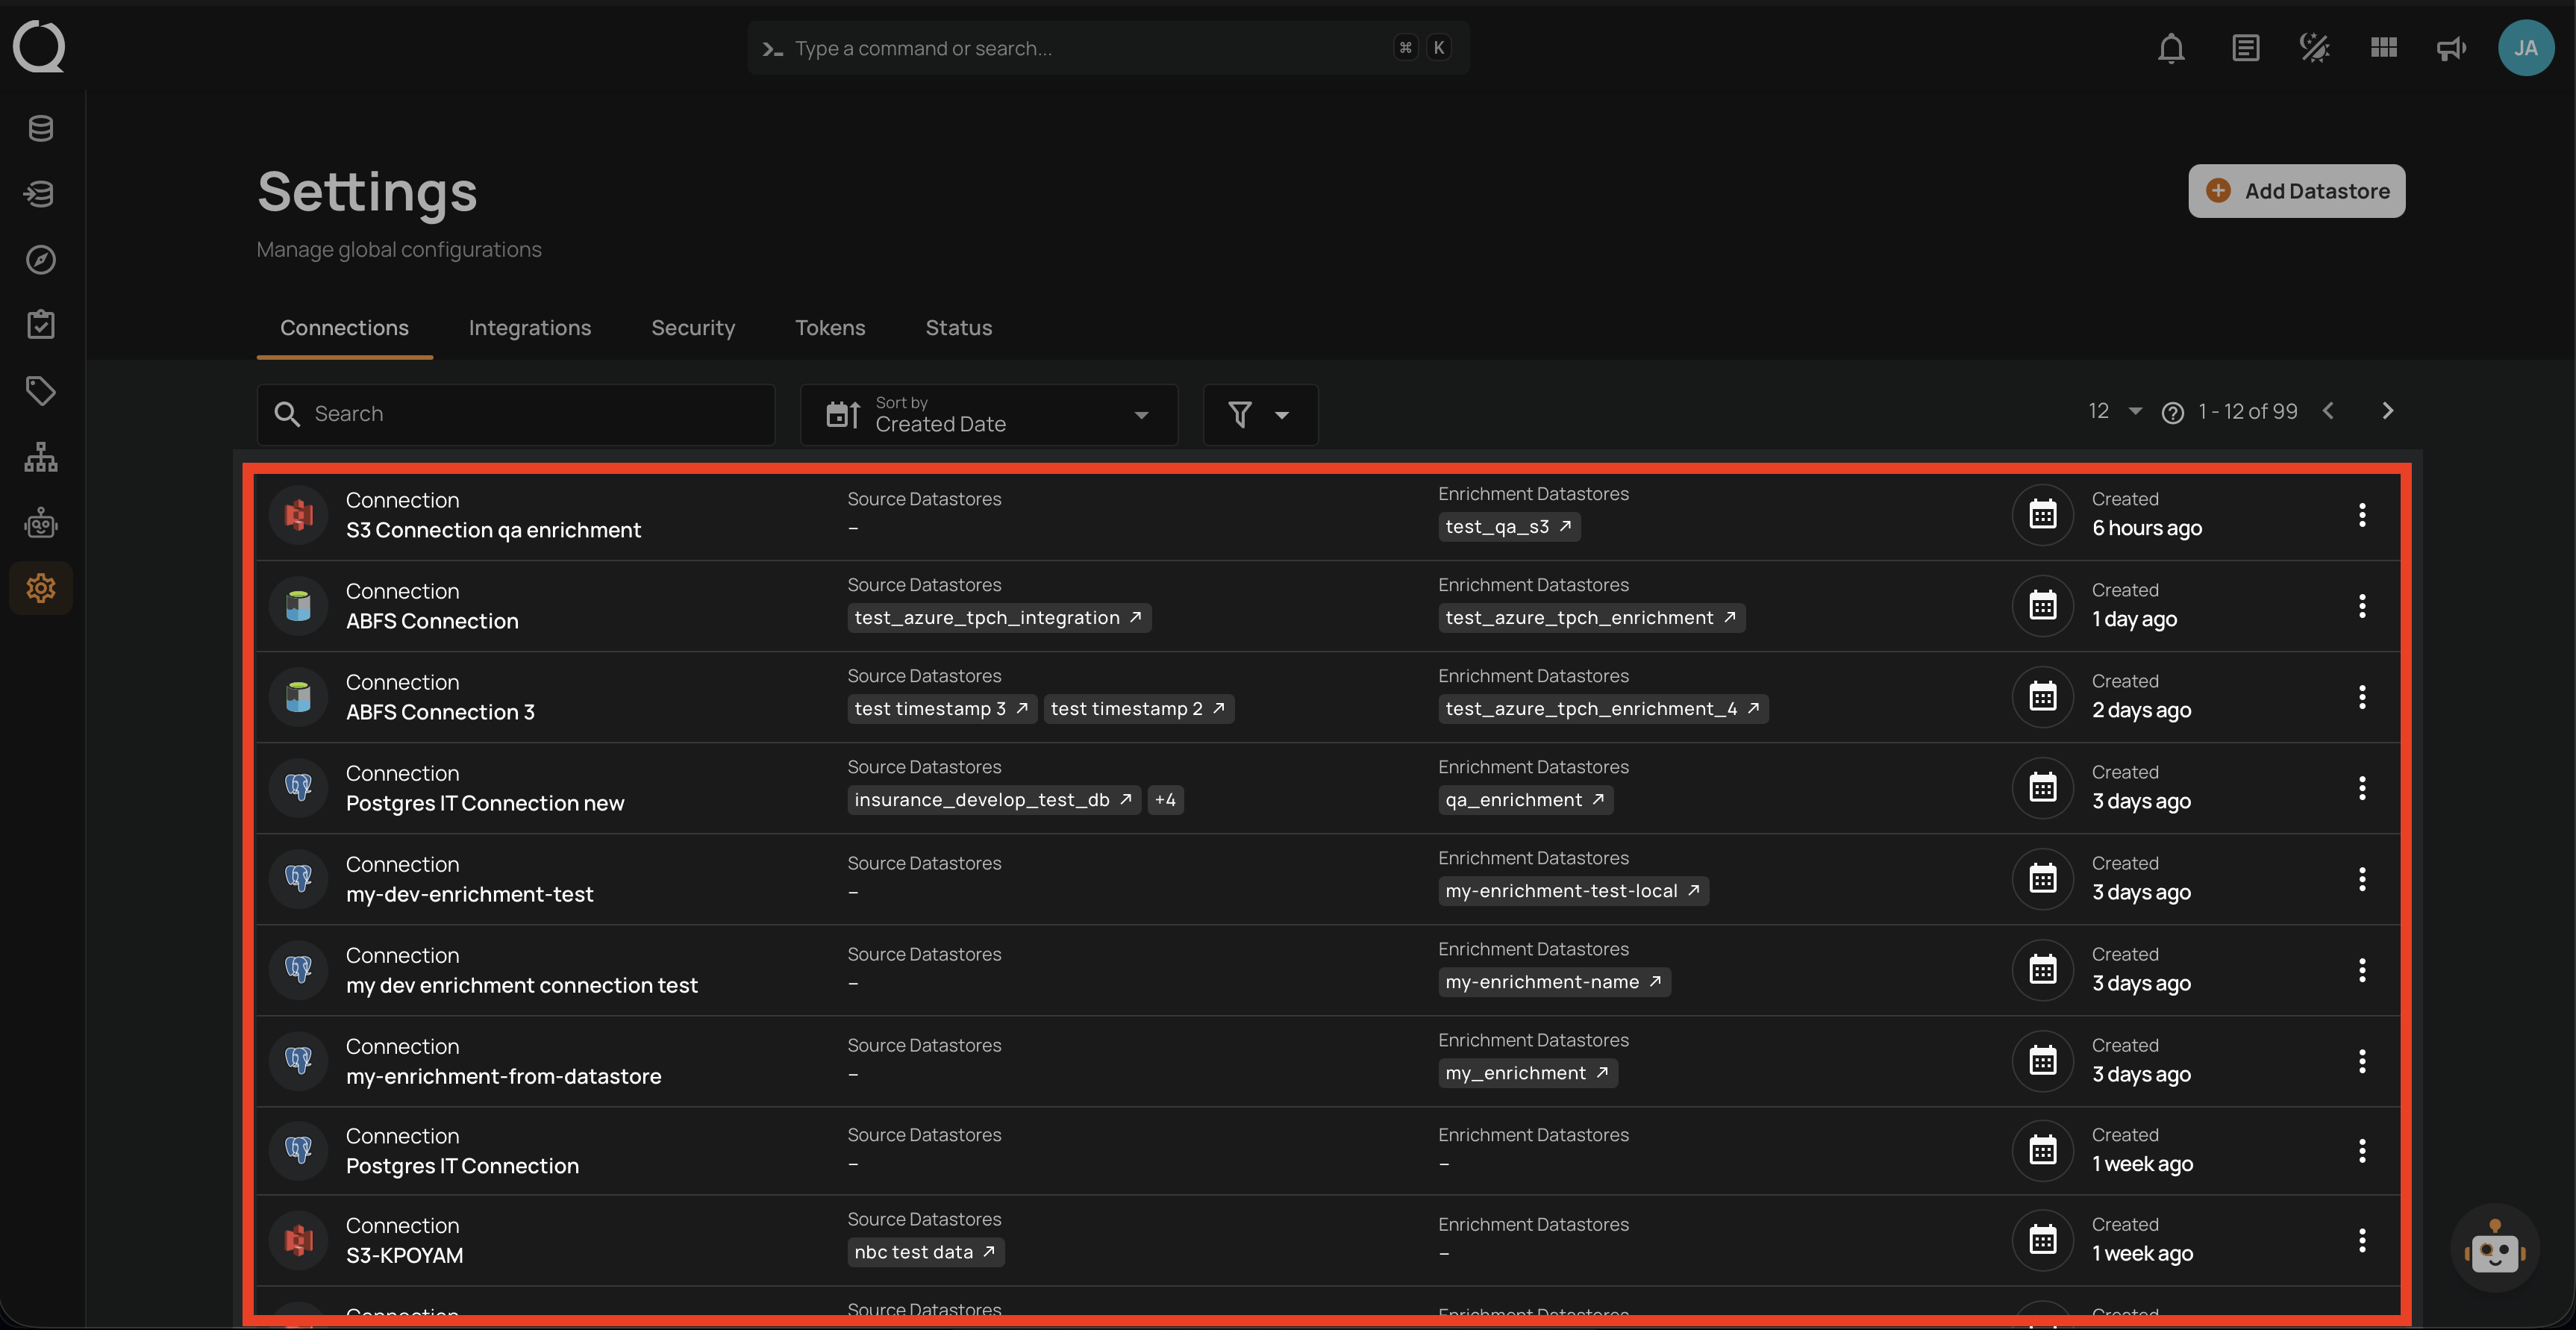
Connections
- Manage reusable connection definitions.
- Start adding datastores from a connection.
-
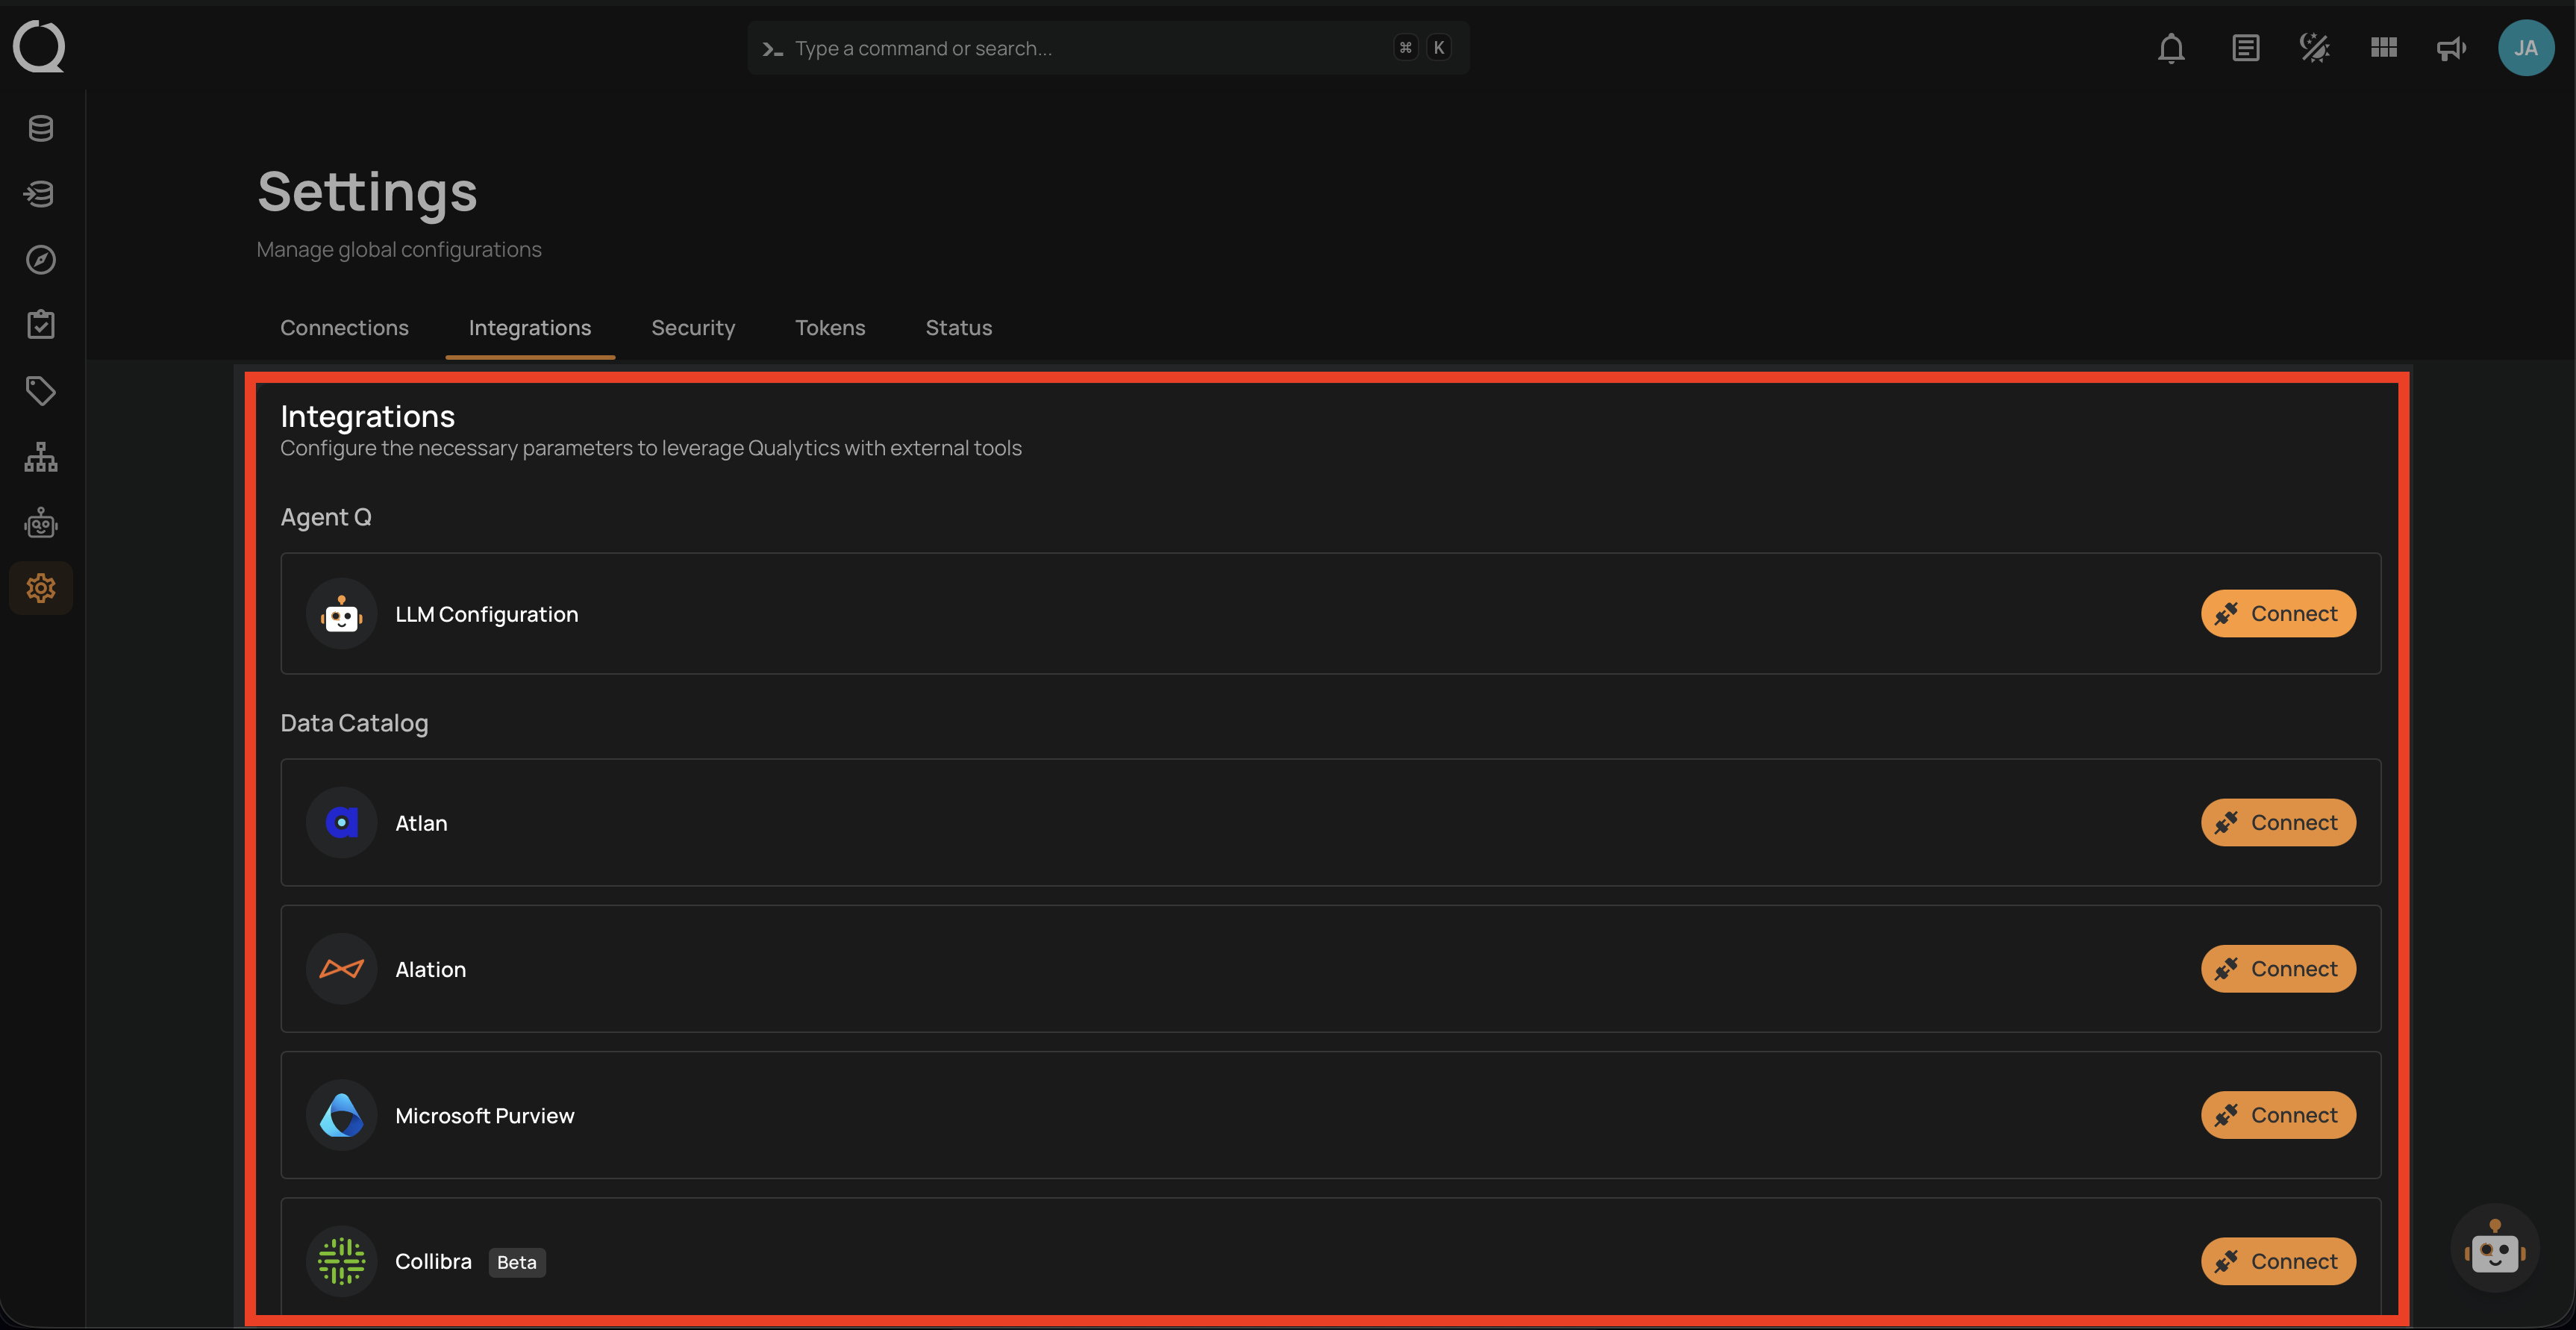
Integrations
- Open the AgentQ page, where the AgentQ provider is managed.
- Configure supported data catalog, alerting, and ticketing integrations.
- Available to Managers and Admins.
-
Defaults
- Set deployment-wide defaults for Observability, Profile, and Scan.
- Available to Admins.
-
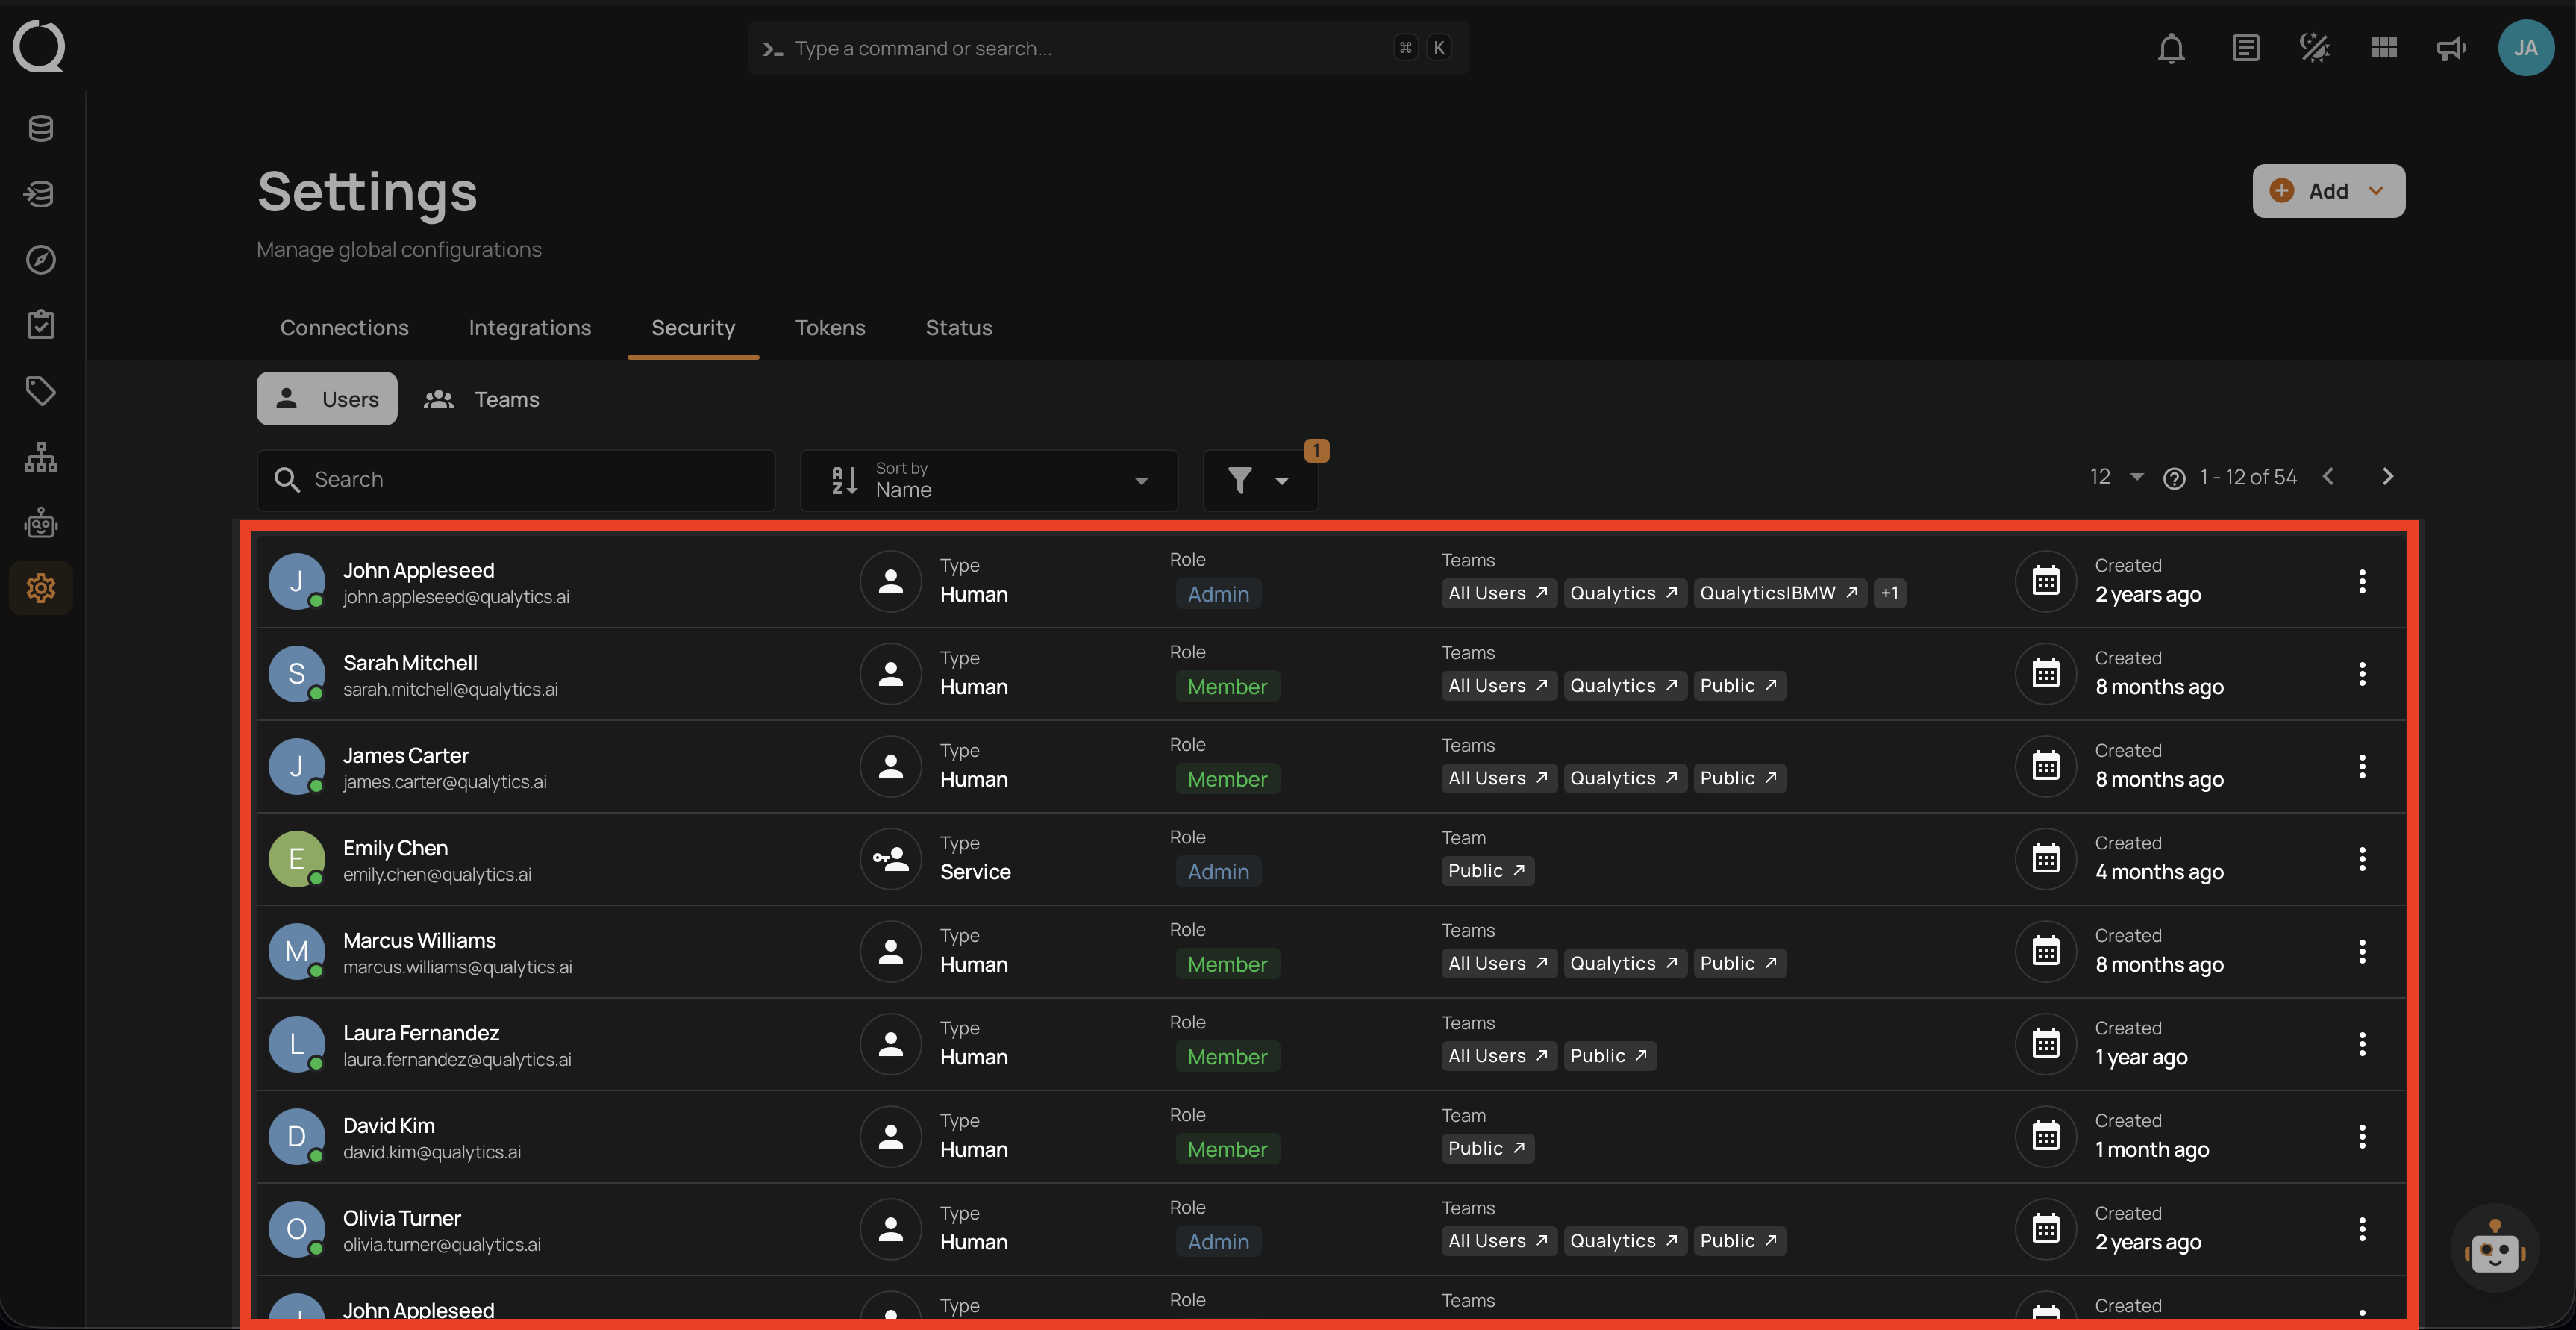
Access
- Manage users and Teams.
- Manage platform roles and datastore team permissions.
- Configure how people sign in to Qualytics.
- Available to Managers and Admins.
-
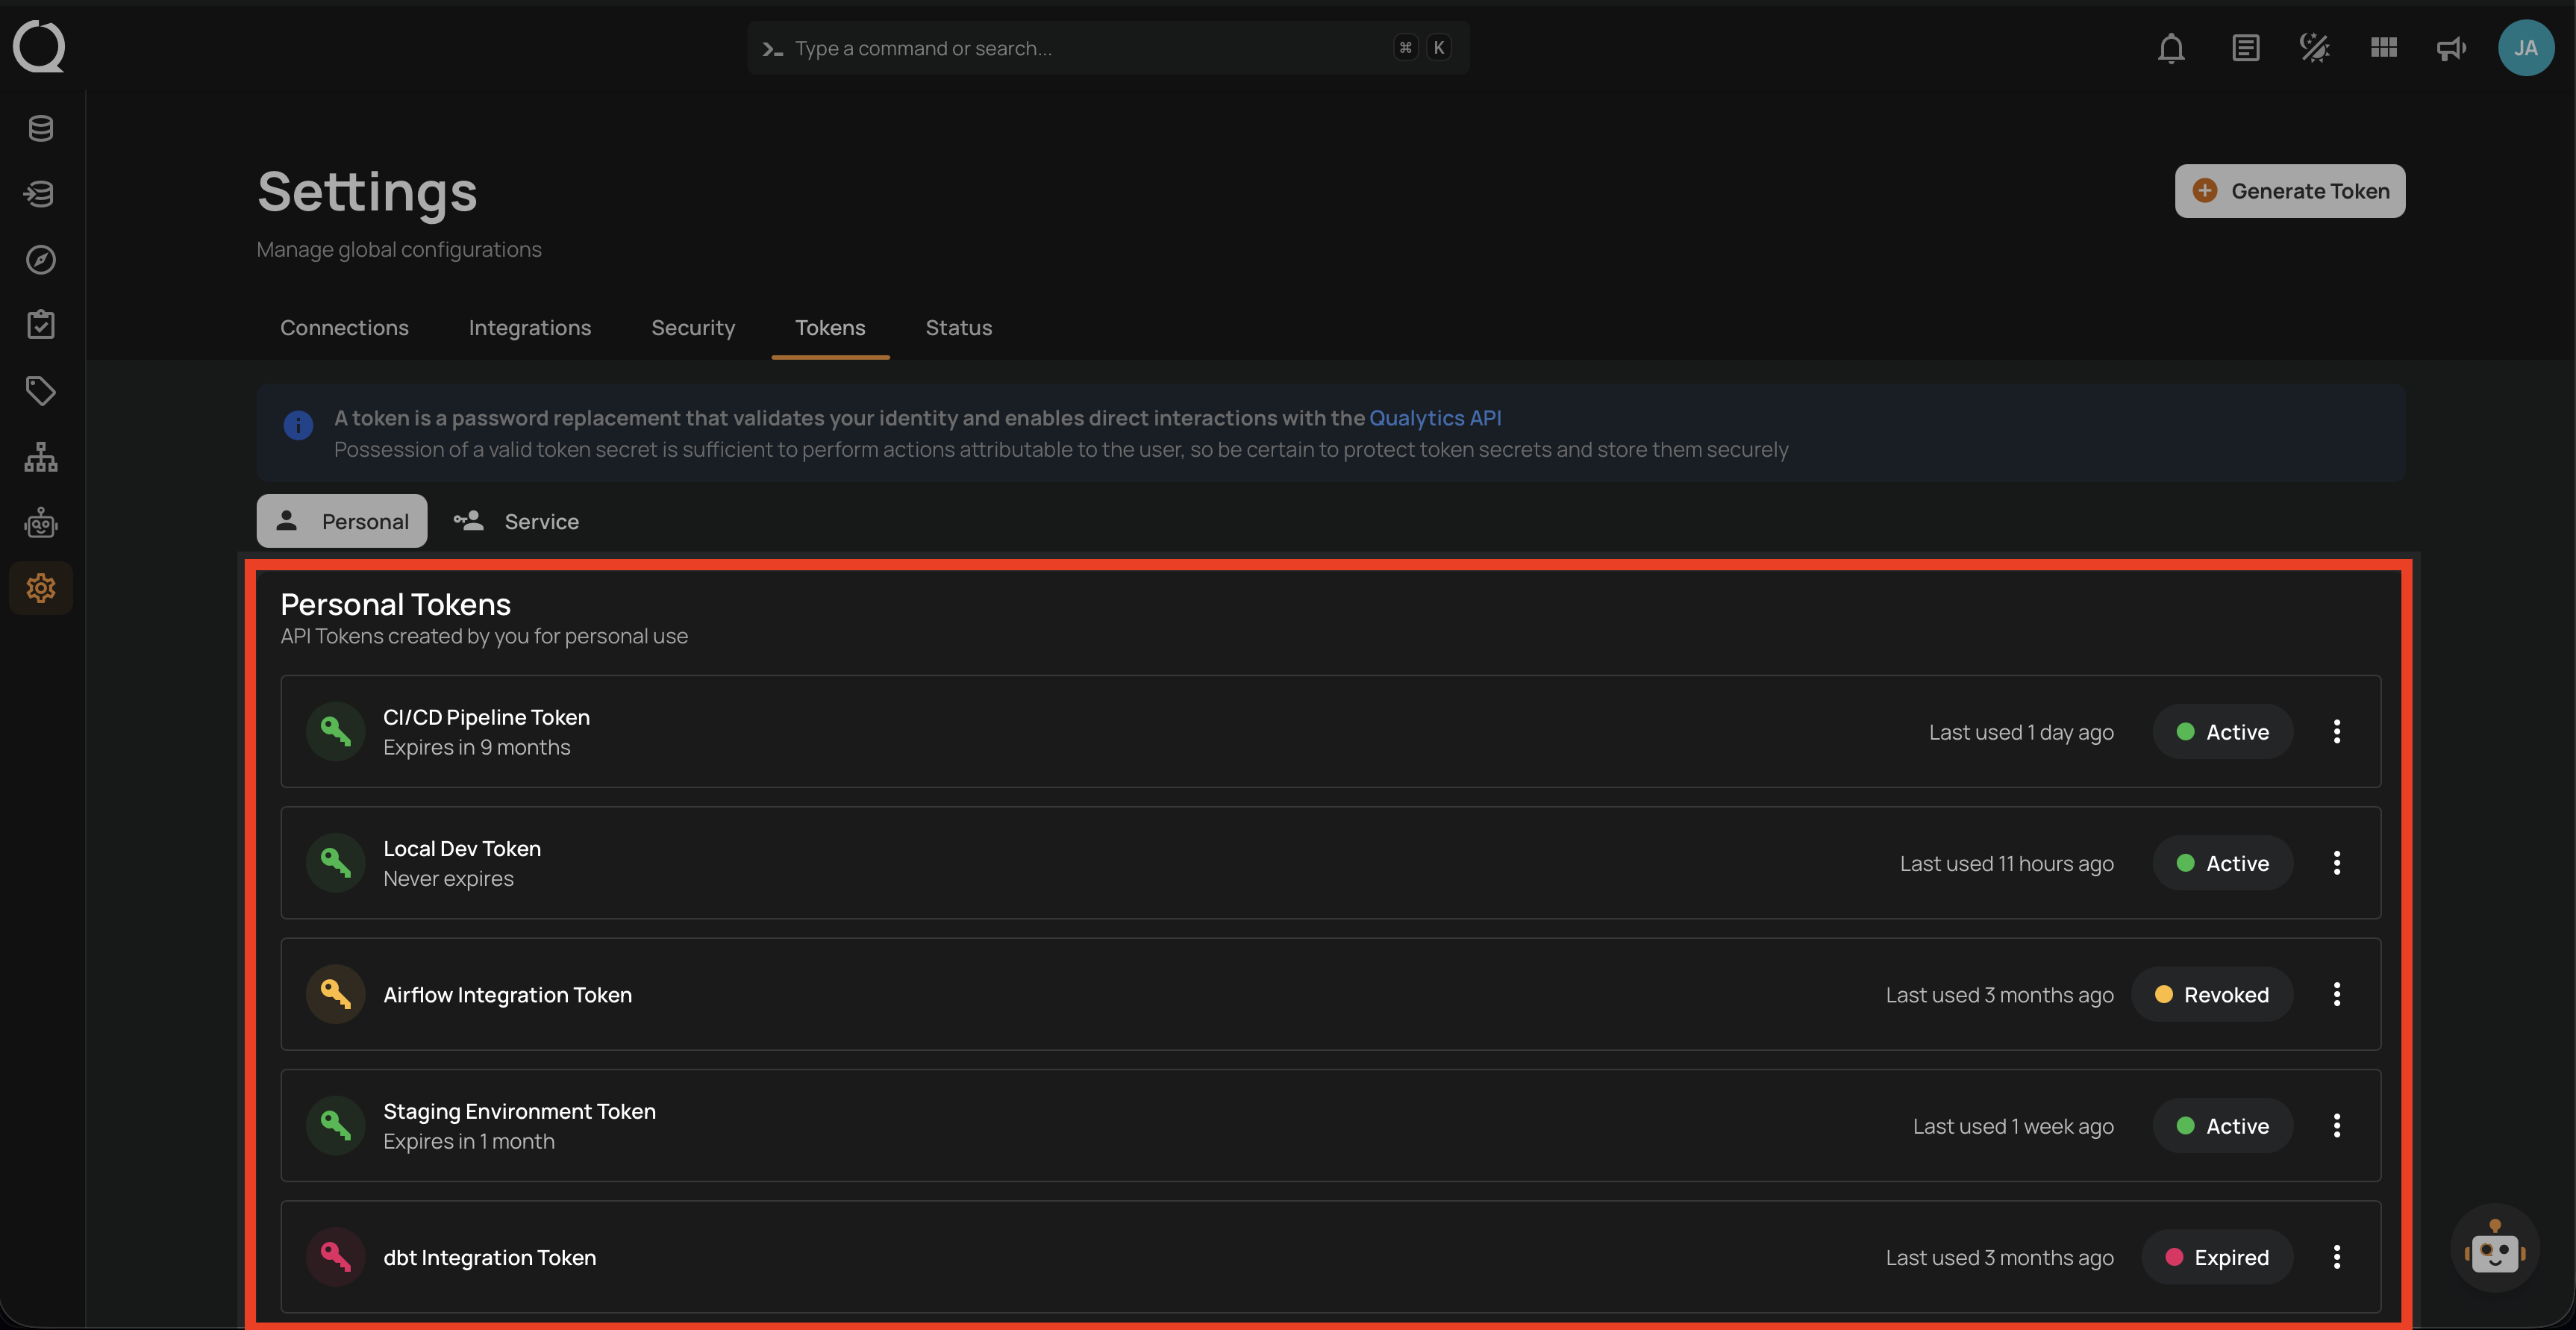
Tokens
- Manage Personal tokens and, where permitted, Service tokens for programmatic access.
- Tokens can be revoked, restored, or deleted at any time.
-
Audit
- Review and export platform activity.
- Available to Admins.
-
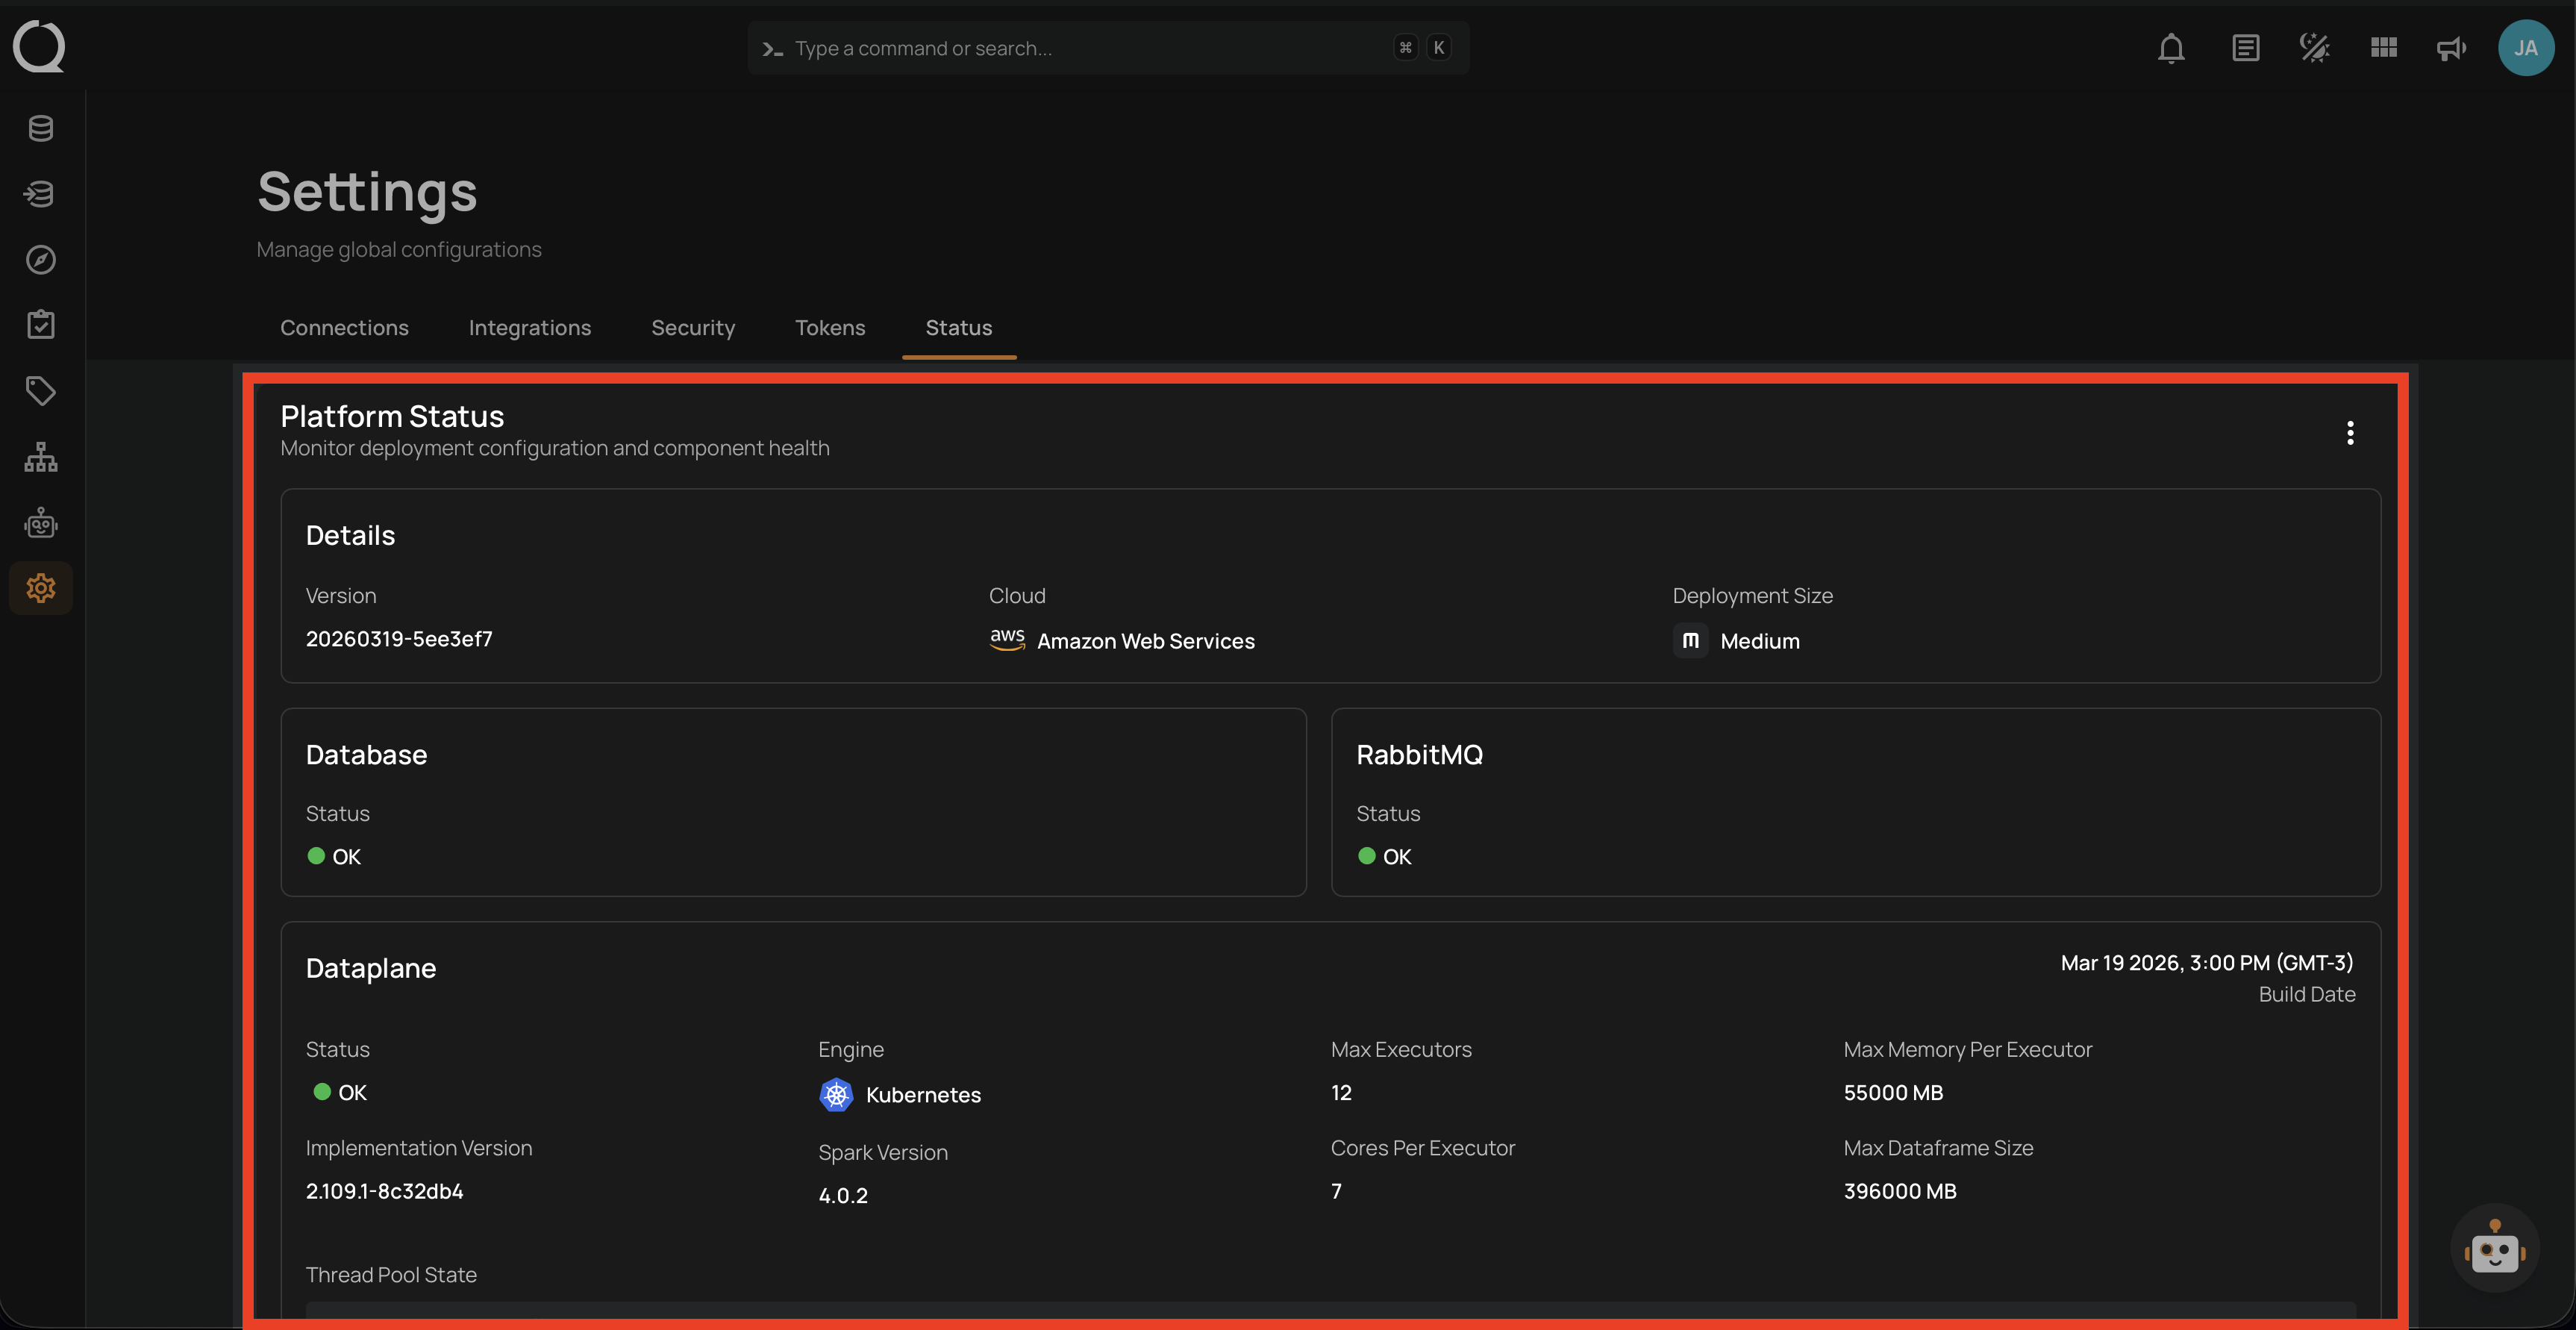
Status
- Review deployment configuration, component health, and capacity.
- Available to Managers and Admins.
Next Steps
Now that you're familiar with the Qualytics basics, consider:
- Setting up additional datastores.
- Creating Authored checks for known business expectations.
- Configuring Flows and notifications for supported events.
- Reviewing quality scores and anomalies with the responsible data owners.
For detailed information on any topic, explore the relevant sections in our documentation.