Platform Status Getting Started
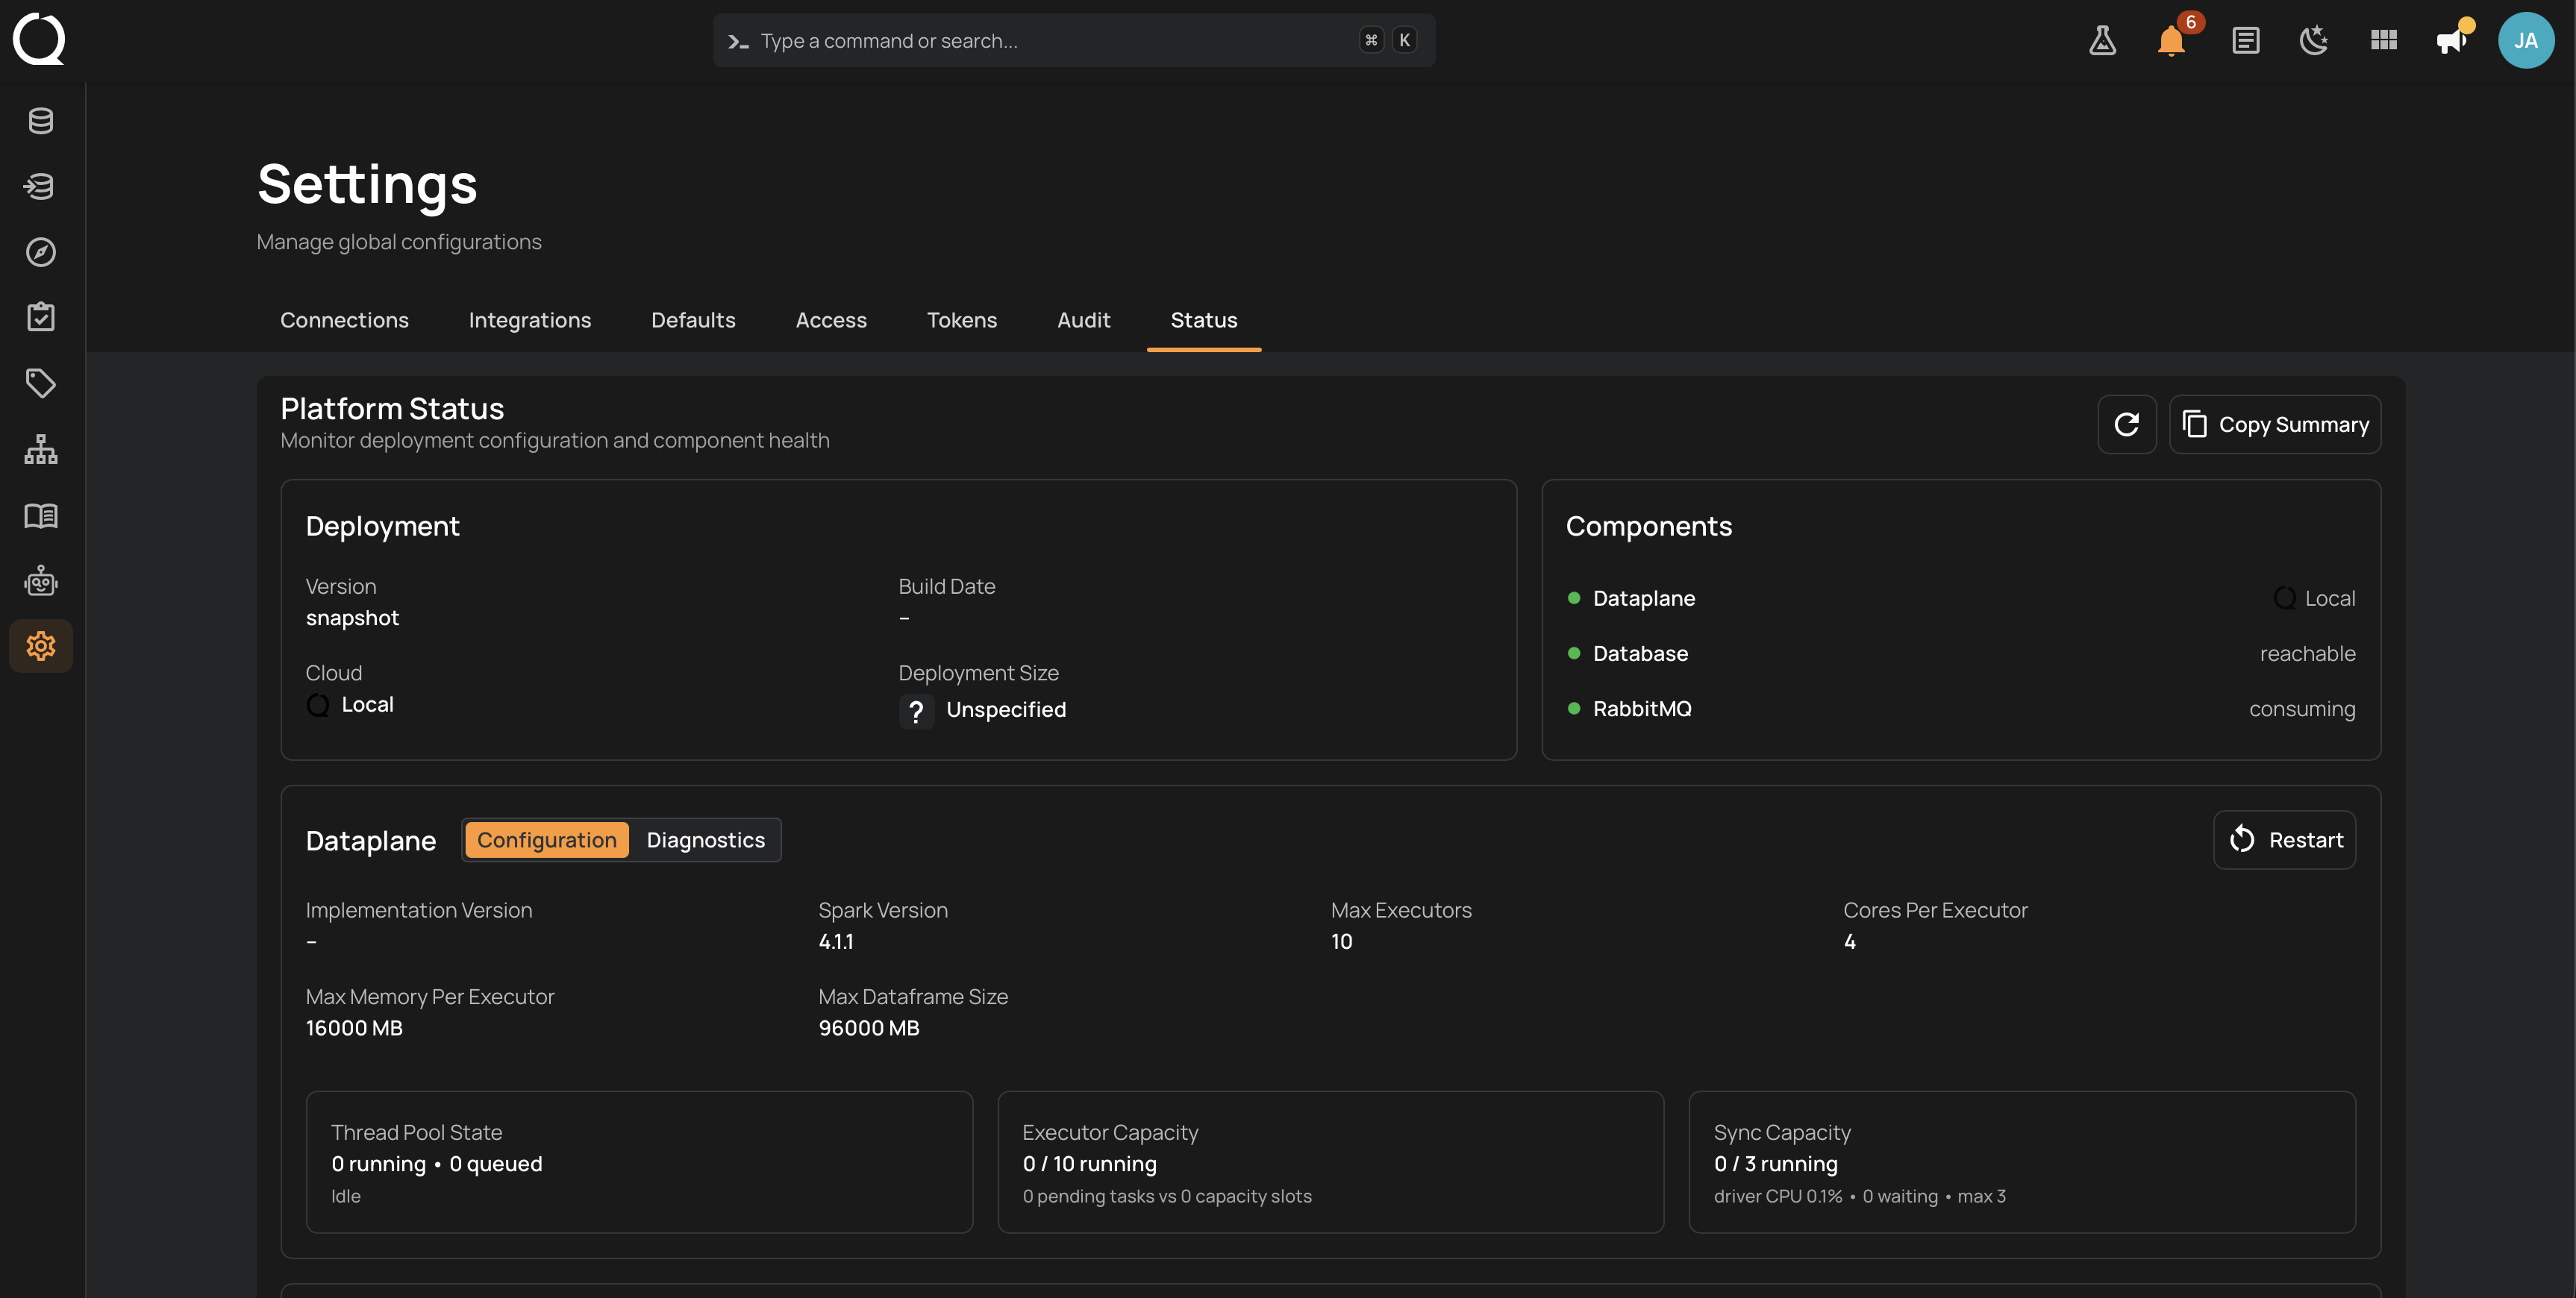
The Platform Status page gives a real-time view of your deployment's configuration and component health. It is the central place to confirm that every critical service is operating correctly, to see how much capacity the Dataplane has, and, for Admins, to inspect what it is doing right now.
Permissions
Users with the Manager or Admin role can access the Platform Status page. Restarting the Dataplane and opening Dataplane Diagnostics require the Admin role. See the Permissions page for the full matrix.
Deep Dive
Understand what each card on the page shows and how to interpret it.
-
Platform Status
Deployment details, component health, Dataplane configuration and capacity, and license state.
-
Permissions
Roles required to view status, capture diagnostics, and restart the Dataplane.
How-tos
Monitor the platform and manage the Dataplane.
-
Refresh Status Summary
Re-run every health check and reload the page with current values.
-
Copy Status Summary
Copy the full status data as JSON for a support ticket.
-
Capture a Diagnostics Report
Take a live report of what the Dataplane is doing right now (Admin).
-
Capture on an Interval
Refresh the report every few seconds to watch an incident develop (Admin).
-
Download a Diagnostics Report
Save the report on screen as a standalone file before it is gone (Admin).
-
Restart Dataplane
Send a graceful shutdown signal to restart the Dataplane (Admin).
Troubleshooting, API & FAQ
-
Troubleshooting
Route a symptom to its cause, and read a Dataplane Diagnostics report section by section.
-
API
Check health, capture diagnostics, and restart the Dataplane programmatically.
-
FAQ
Health indicators, capacity readouts, diagnostics reports, and restart effects.