Profile Operation
The Profile Operation is a comprehensive analysis conducted on every record within all available containers in a datastore. This process is aimed at understanding and improving data quality by generating metadata for each field within the collections of data (like tables or files).
By gathering detailed statistical data and submitting it to Qualytics AI, the operation not only identifies and evaluates data quality but also generates and refines AI Managed checks to ensure ongoing data integrity. Executing profile operations periodically helps maintain up-to-date and accurate data quality checks based on the latest data.
This guide explains how to configure the profile operation with available functionalities such as tables, tags, and schedule options.
Let's get started 🚀
How Profiling Works
Fields Identification
The initial step involves recognizing and identifying all the fields within each data container. This step is crucial as it lays the foundation for subsequent analysis and profiling.
Statistical Data Gathering
After identifying the fields, the Profile Operation collects statistical data for each field based on its declared or detected data type. This data includes essential metrics such as minimum and maximum values, mean, standard deviation, and other relevant statistics. These metrics provide valuable insights into the characteristics and distribution of the data, helping to understand its quality and consistency.
Metadata Generation
The gathered statistical data is then submitted to Qualytics AI. The AI uses this data to generate metadata that forms the basis for creating appropriate data quality checks. This metadata is essential for setting up robust quality control mechanisms within the data management system.
Data Quality Checks
AI Managed data quality checks are rigorously validated and backtested against the actual source data. This validation phase is critical to fine-tuning the checks to the desired sensitivity levels, ensuring they are neither too strict (causing false positives) nor too lenient (missing errors). By calibrating these checks accurately, the system can maintain high data integrity and reliability.
Navigation to Profile Operation
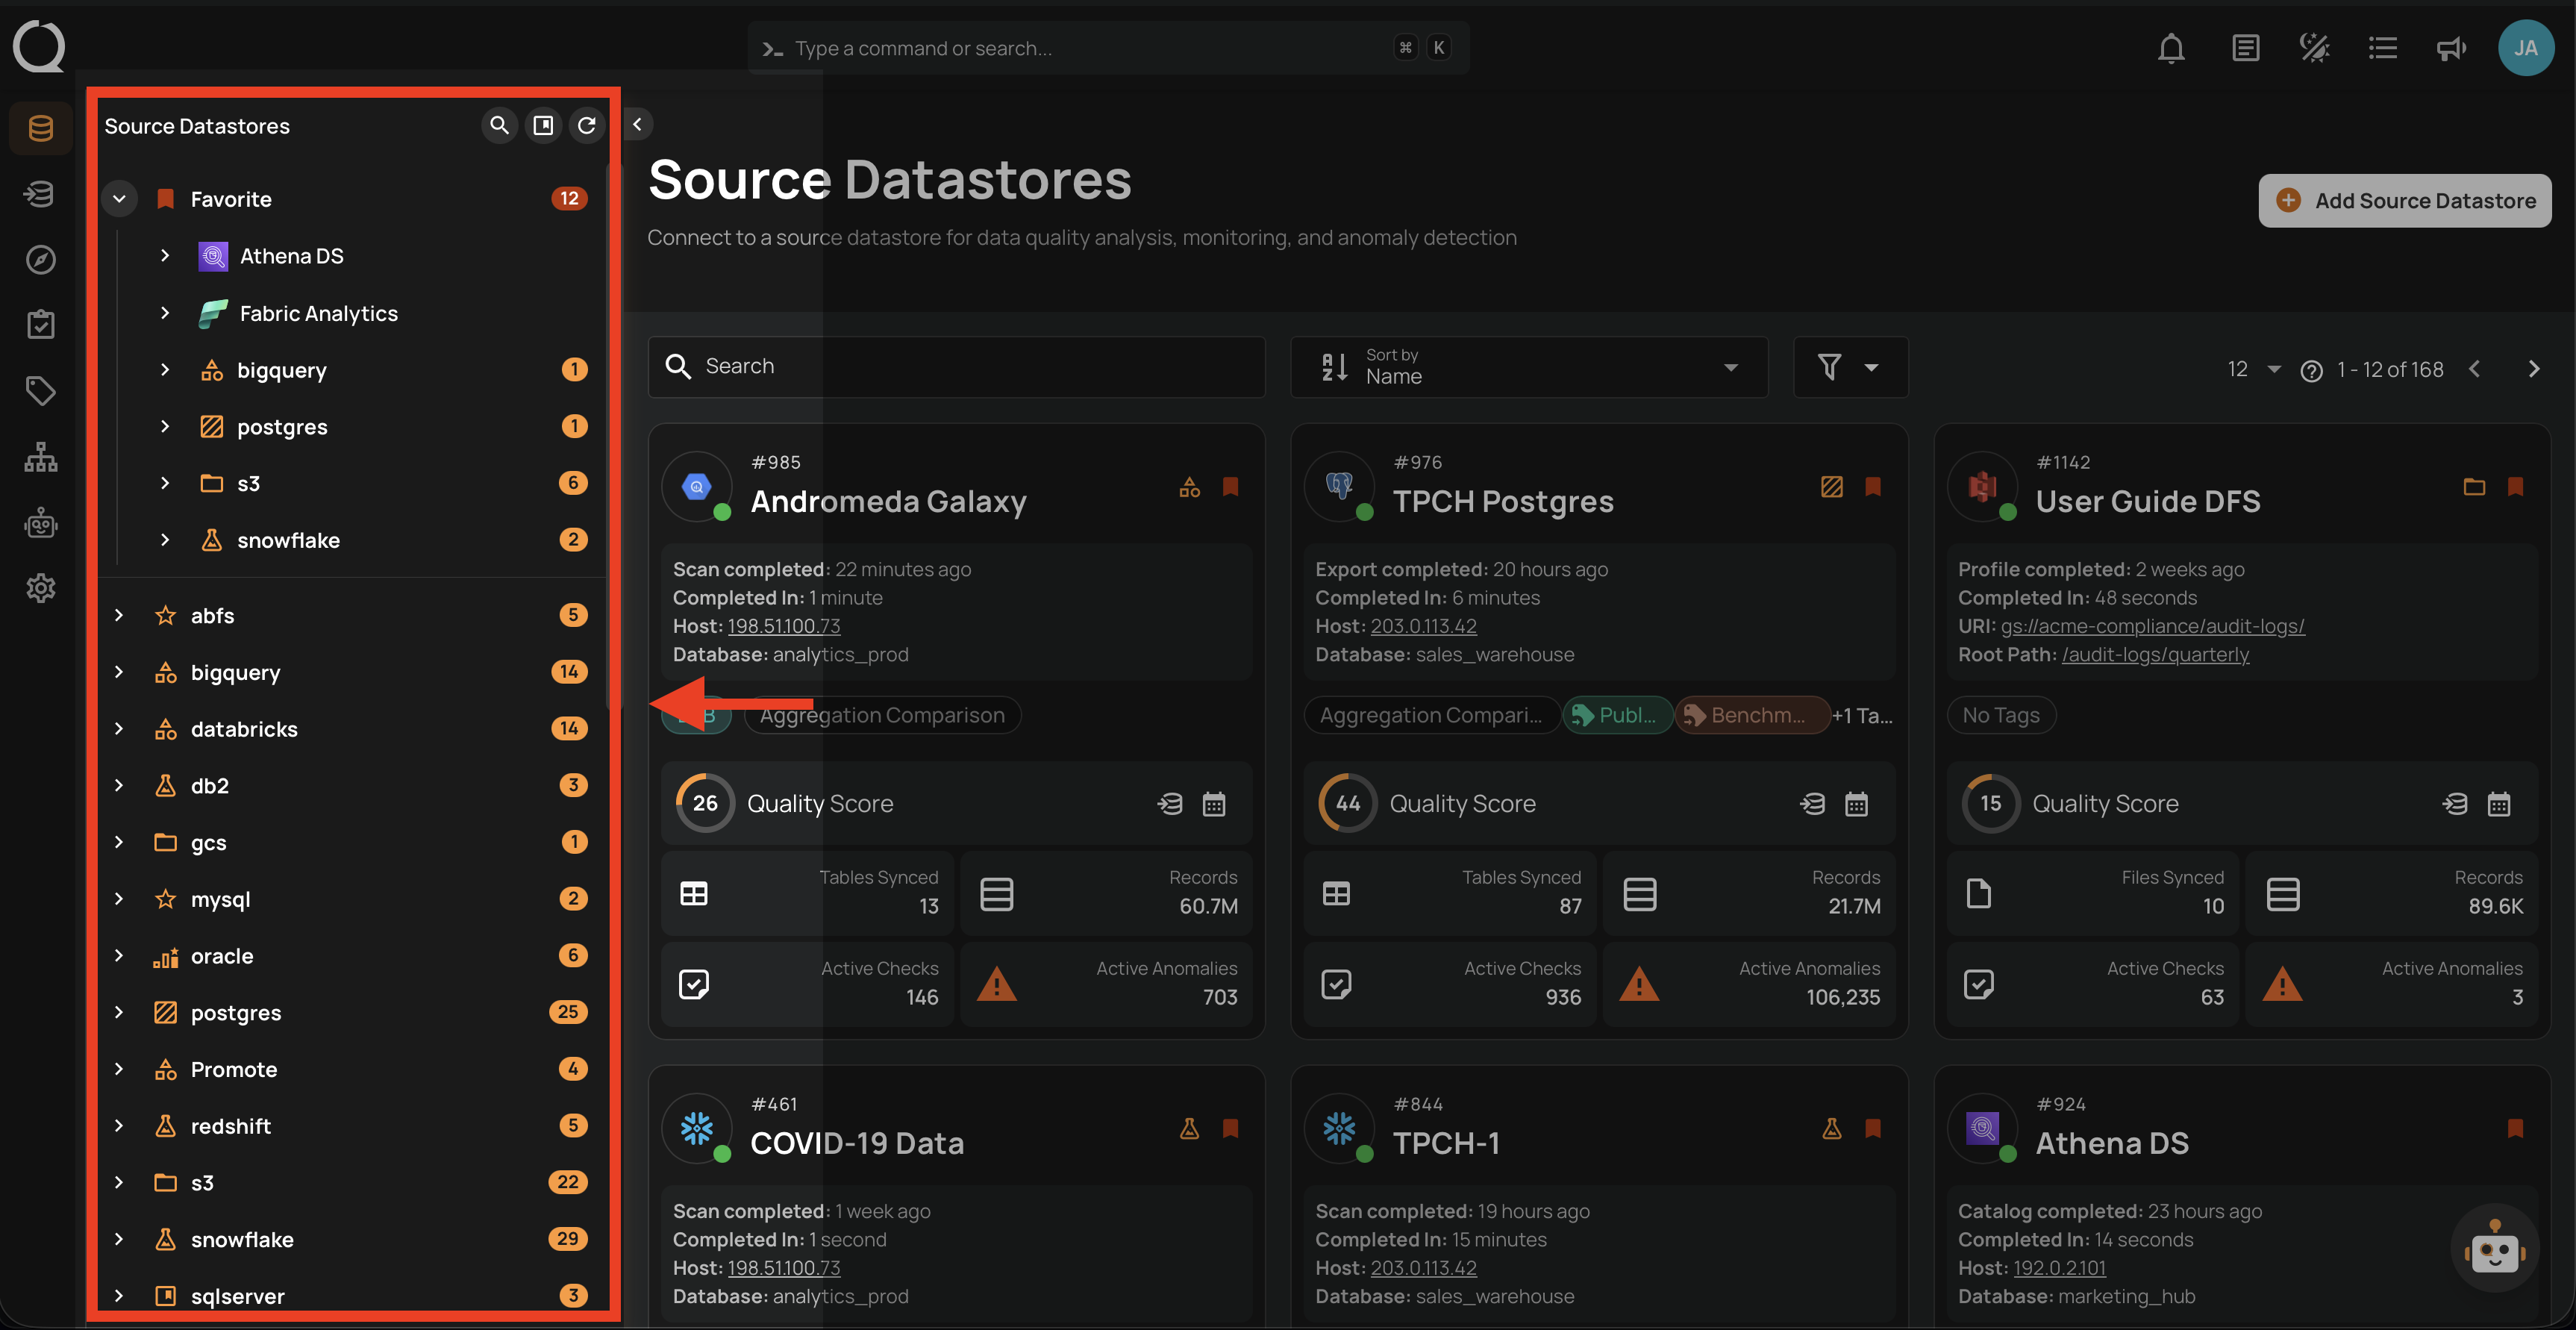
Step 1: Select a source datastore from the side menu on which you would like to perform the profile operation.
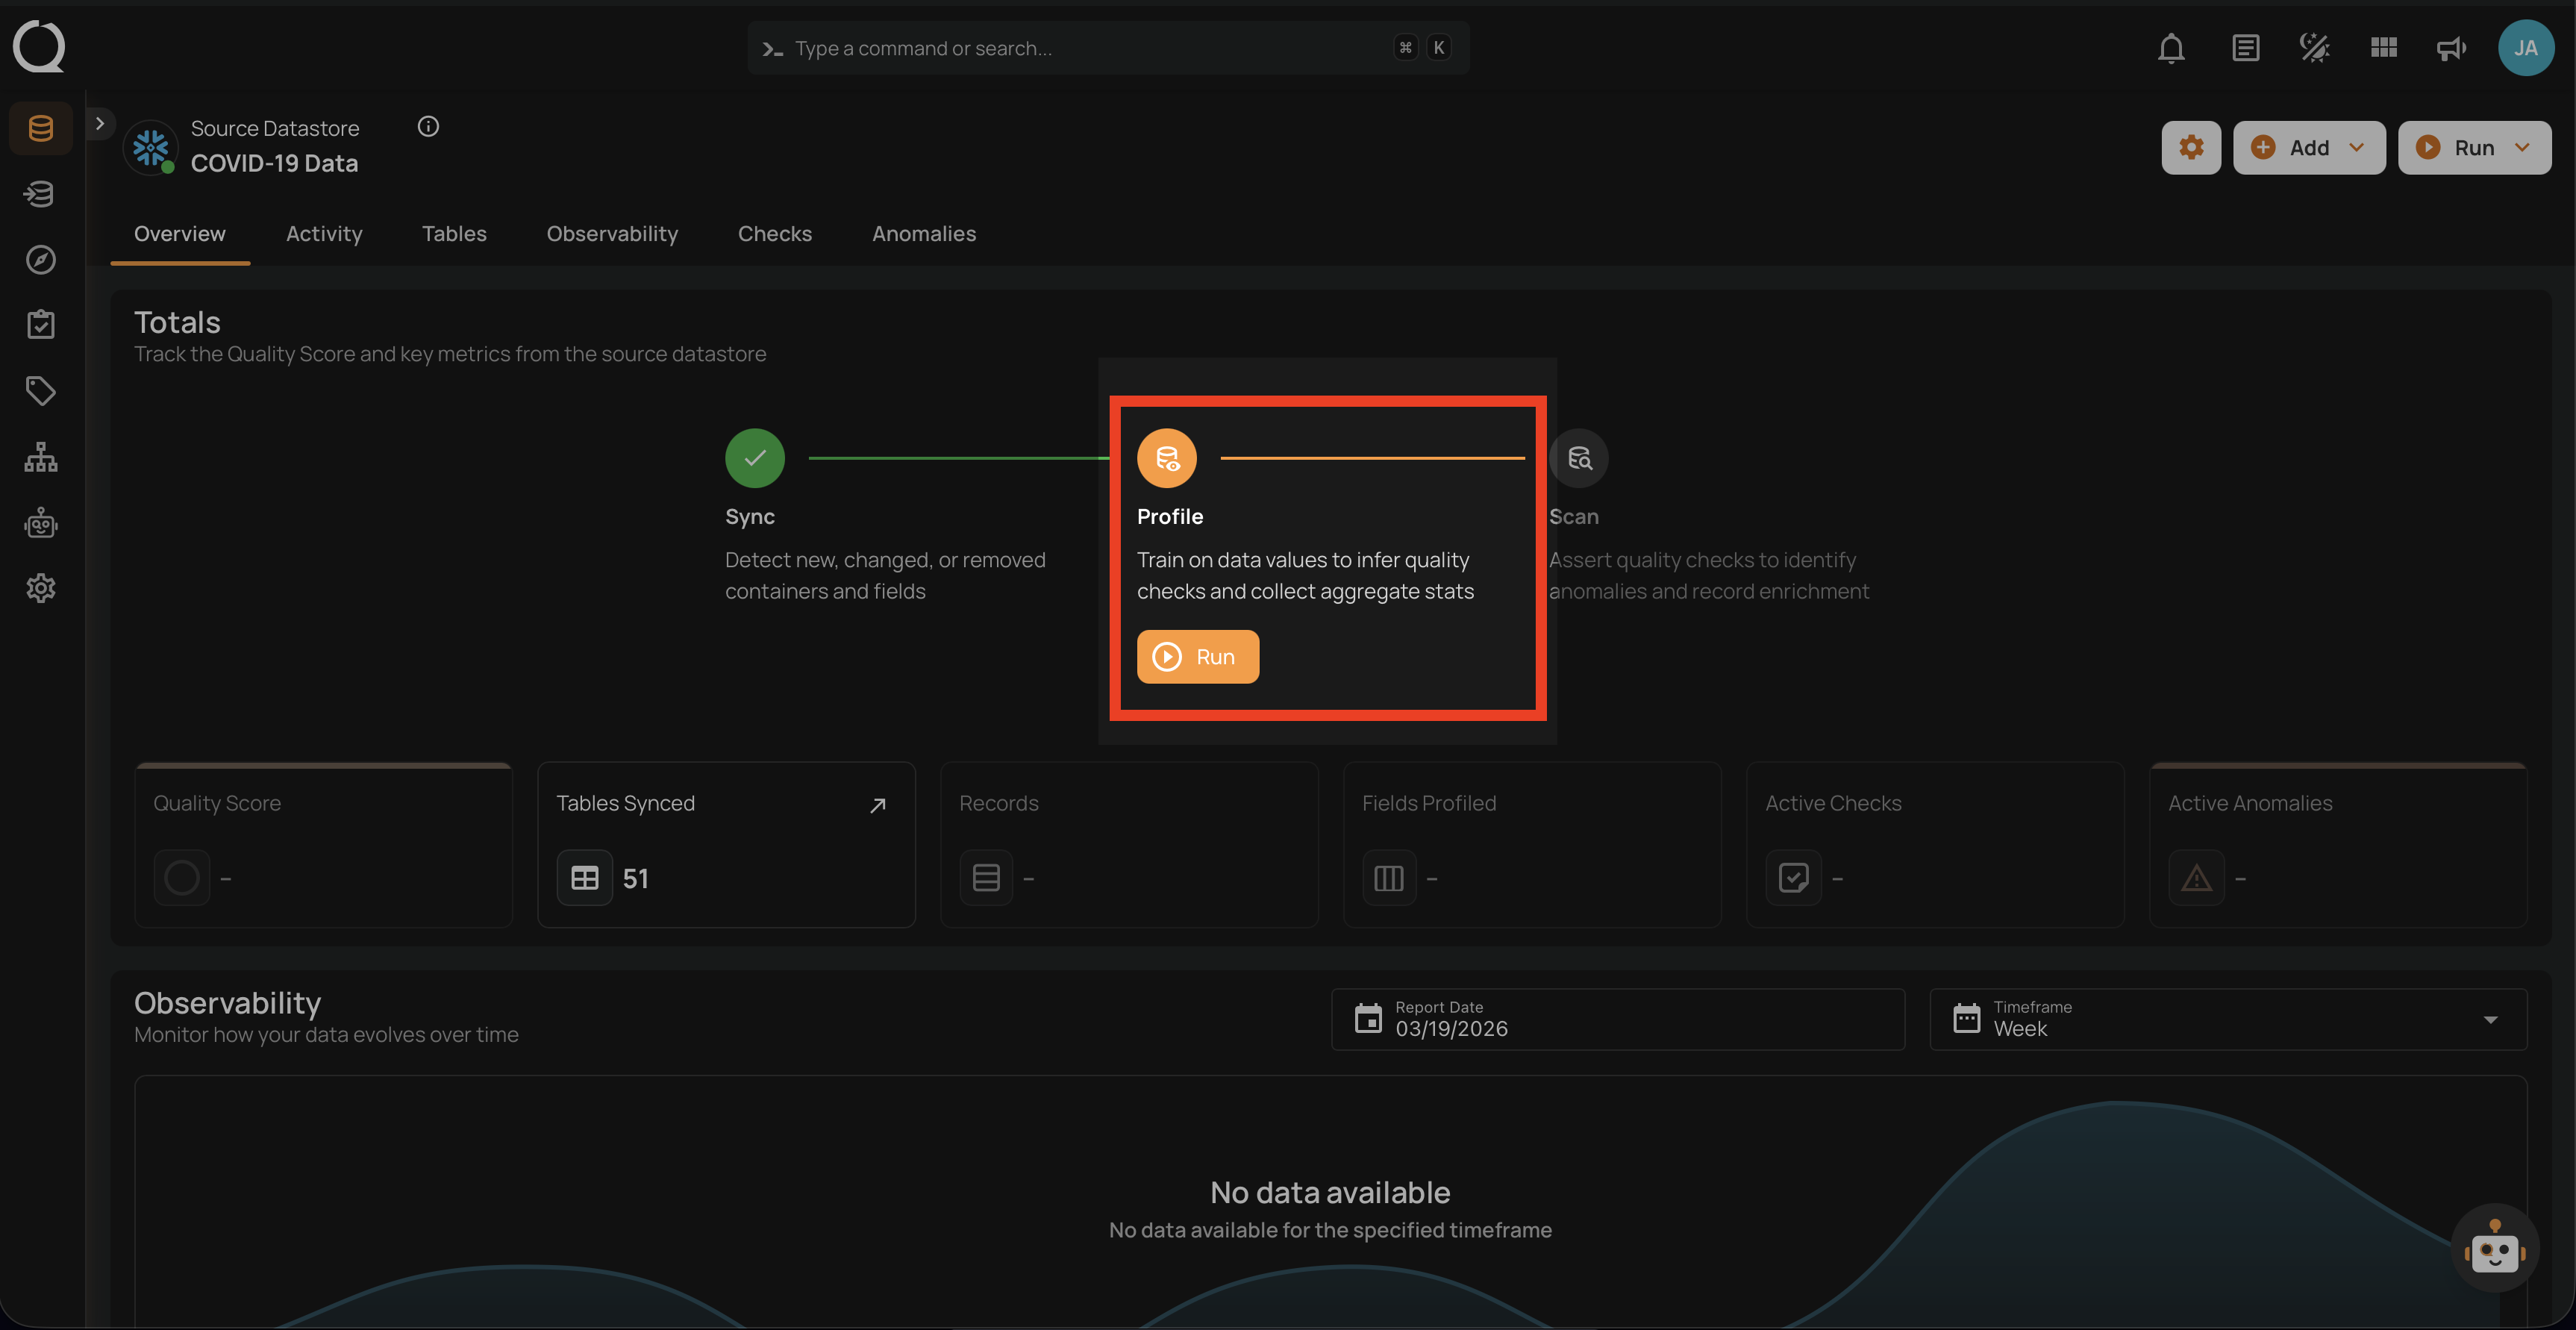
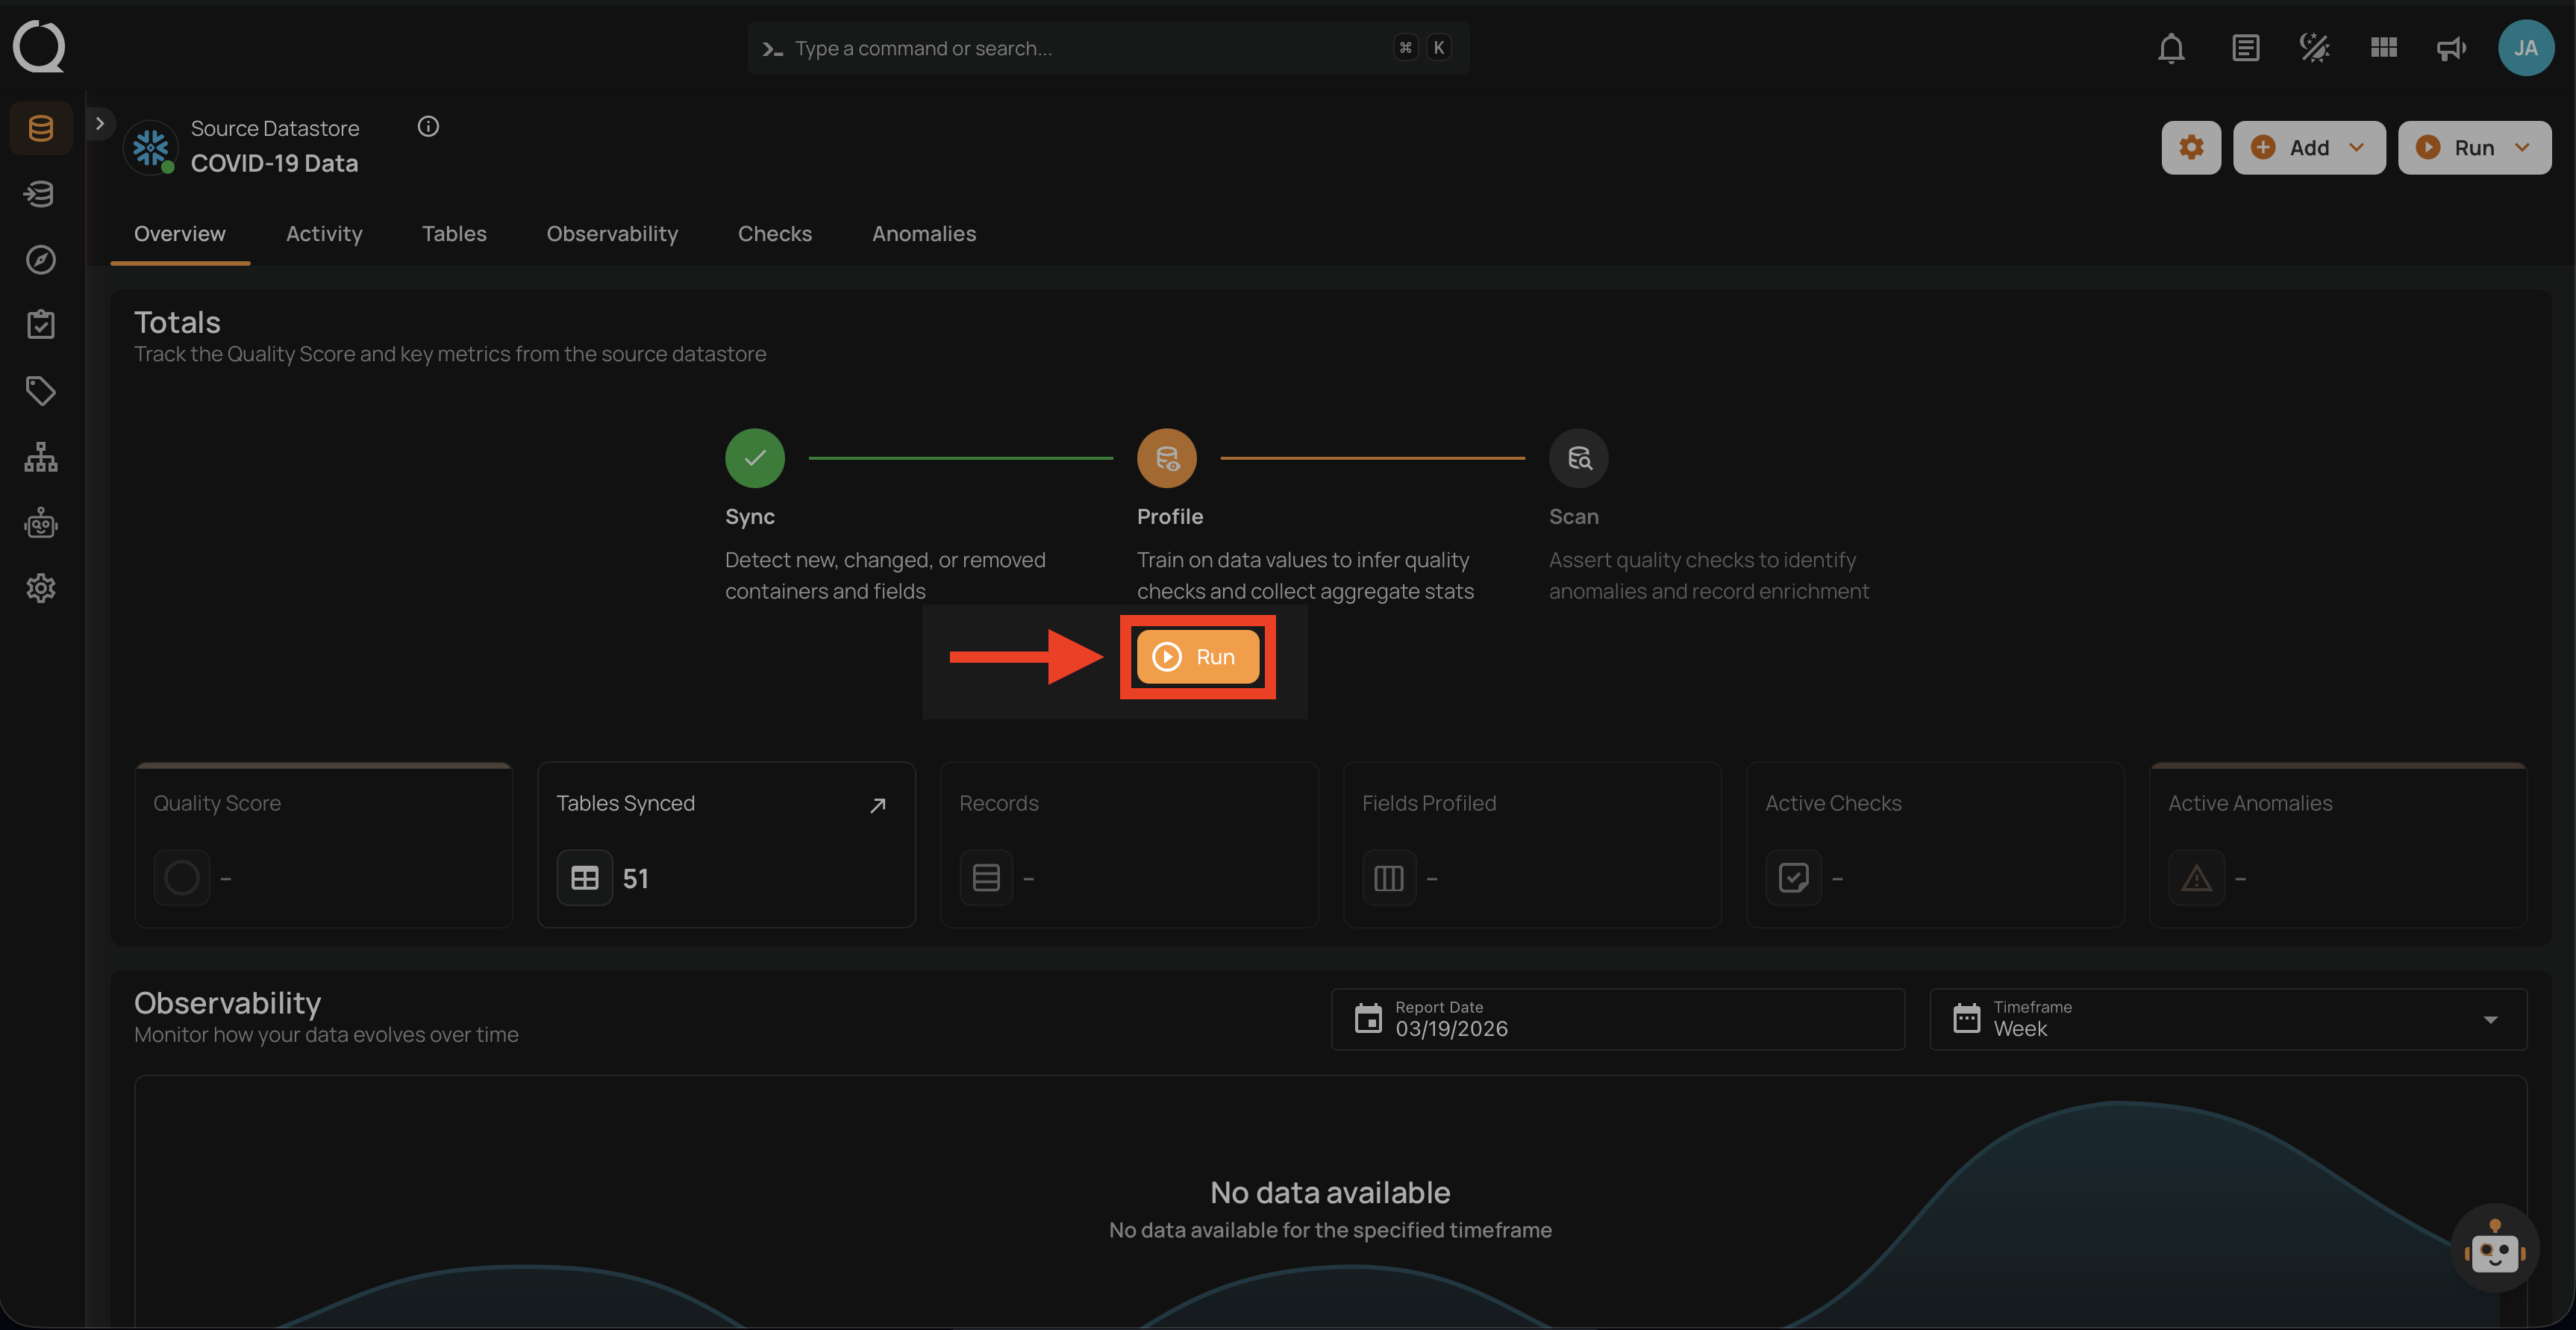
Step 2: Clicking on your preferred datastore will navigate you to the datastore details page. Within the overview tab (default view), click on the Run button under Profile to initiate the profile operation.
Configuration
Step 1: Click on the Run button to initiate the profile operation.
Note
You can run Profile Operation anytime to update the AI Managed checks automatically based on new data in the datastore. It is recommended to schedule the profile operations periodically to keep AI Managed checks calibrated. More details are discussed in the Schedule section below.
User-edited checks are protected
Profile only refreshes AI Managed checks that are still managed by Qualytics. As soon as a user edits an evaluation property of an AI Managed check (rule properties, coverage, filter clause, or fields), the check is converted to Authored and subsequent Profile runs leave it alone — your tuning is preserved across runs. See AI Managed Checks Introduction for the full conversion behavior.
Step 2: Select tables (in your JDBC datastore) or file patterns (in your DFS datastore) and tags you would like to be profiled.
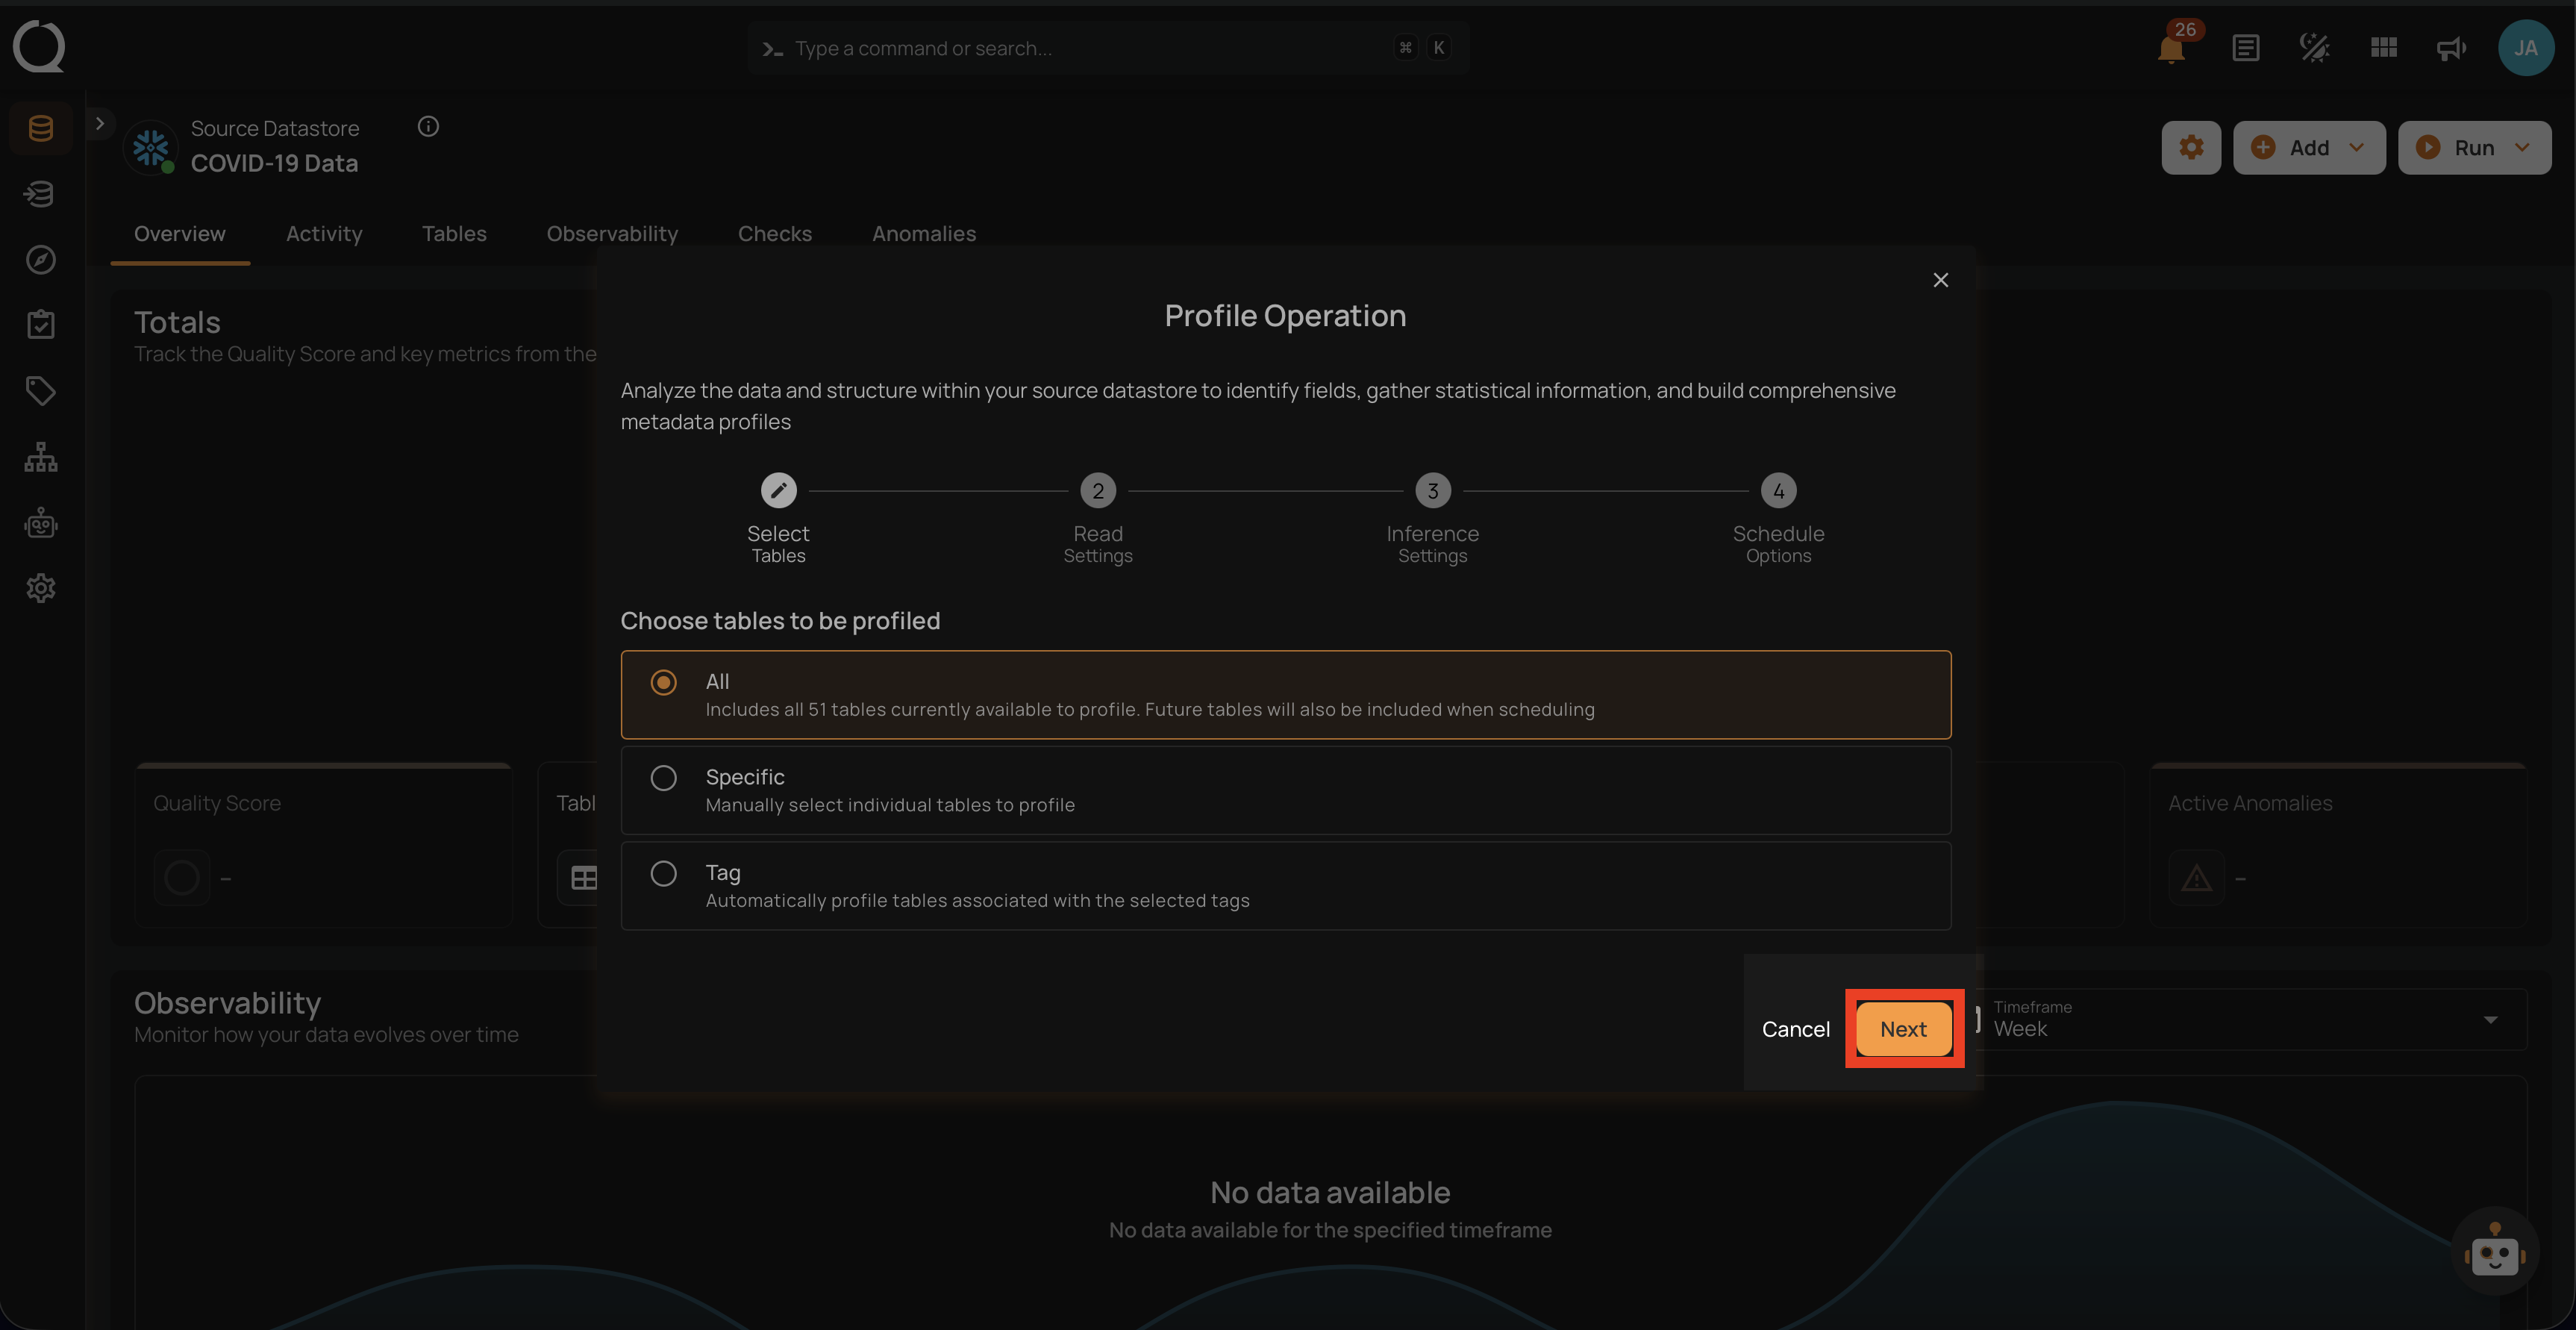
1. All Tables/File Patterns
This option includes all tables or files currently available in the datastore for profiling. Selecting this will profile every table within the source datastore without the need for further selection.
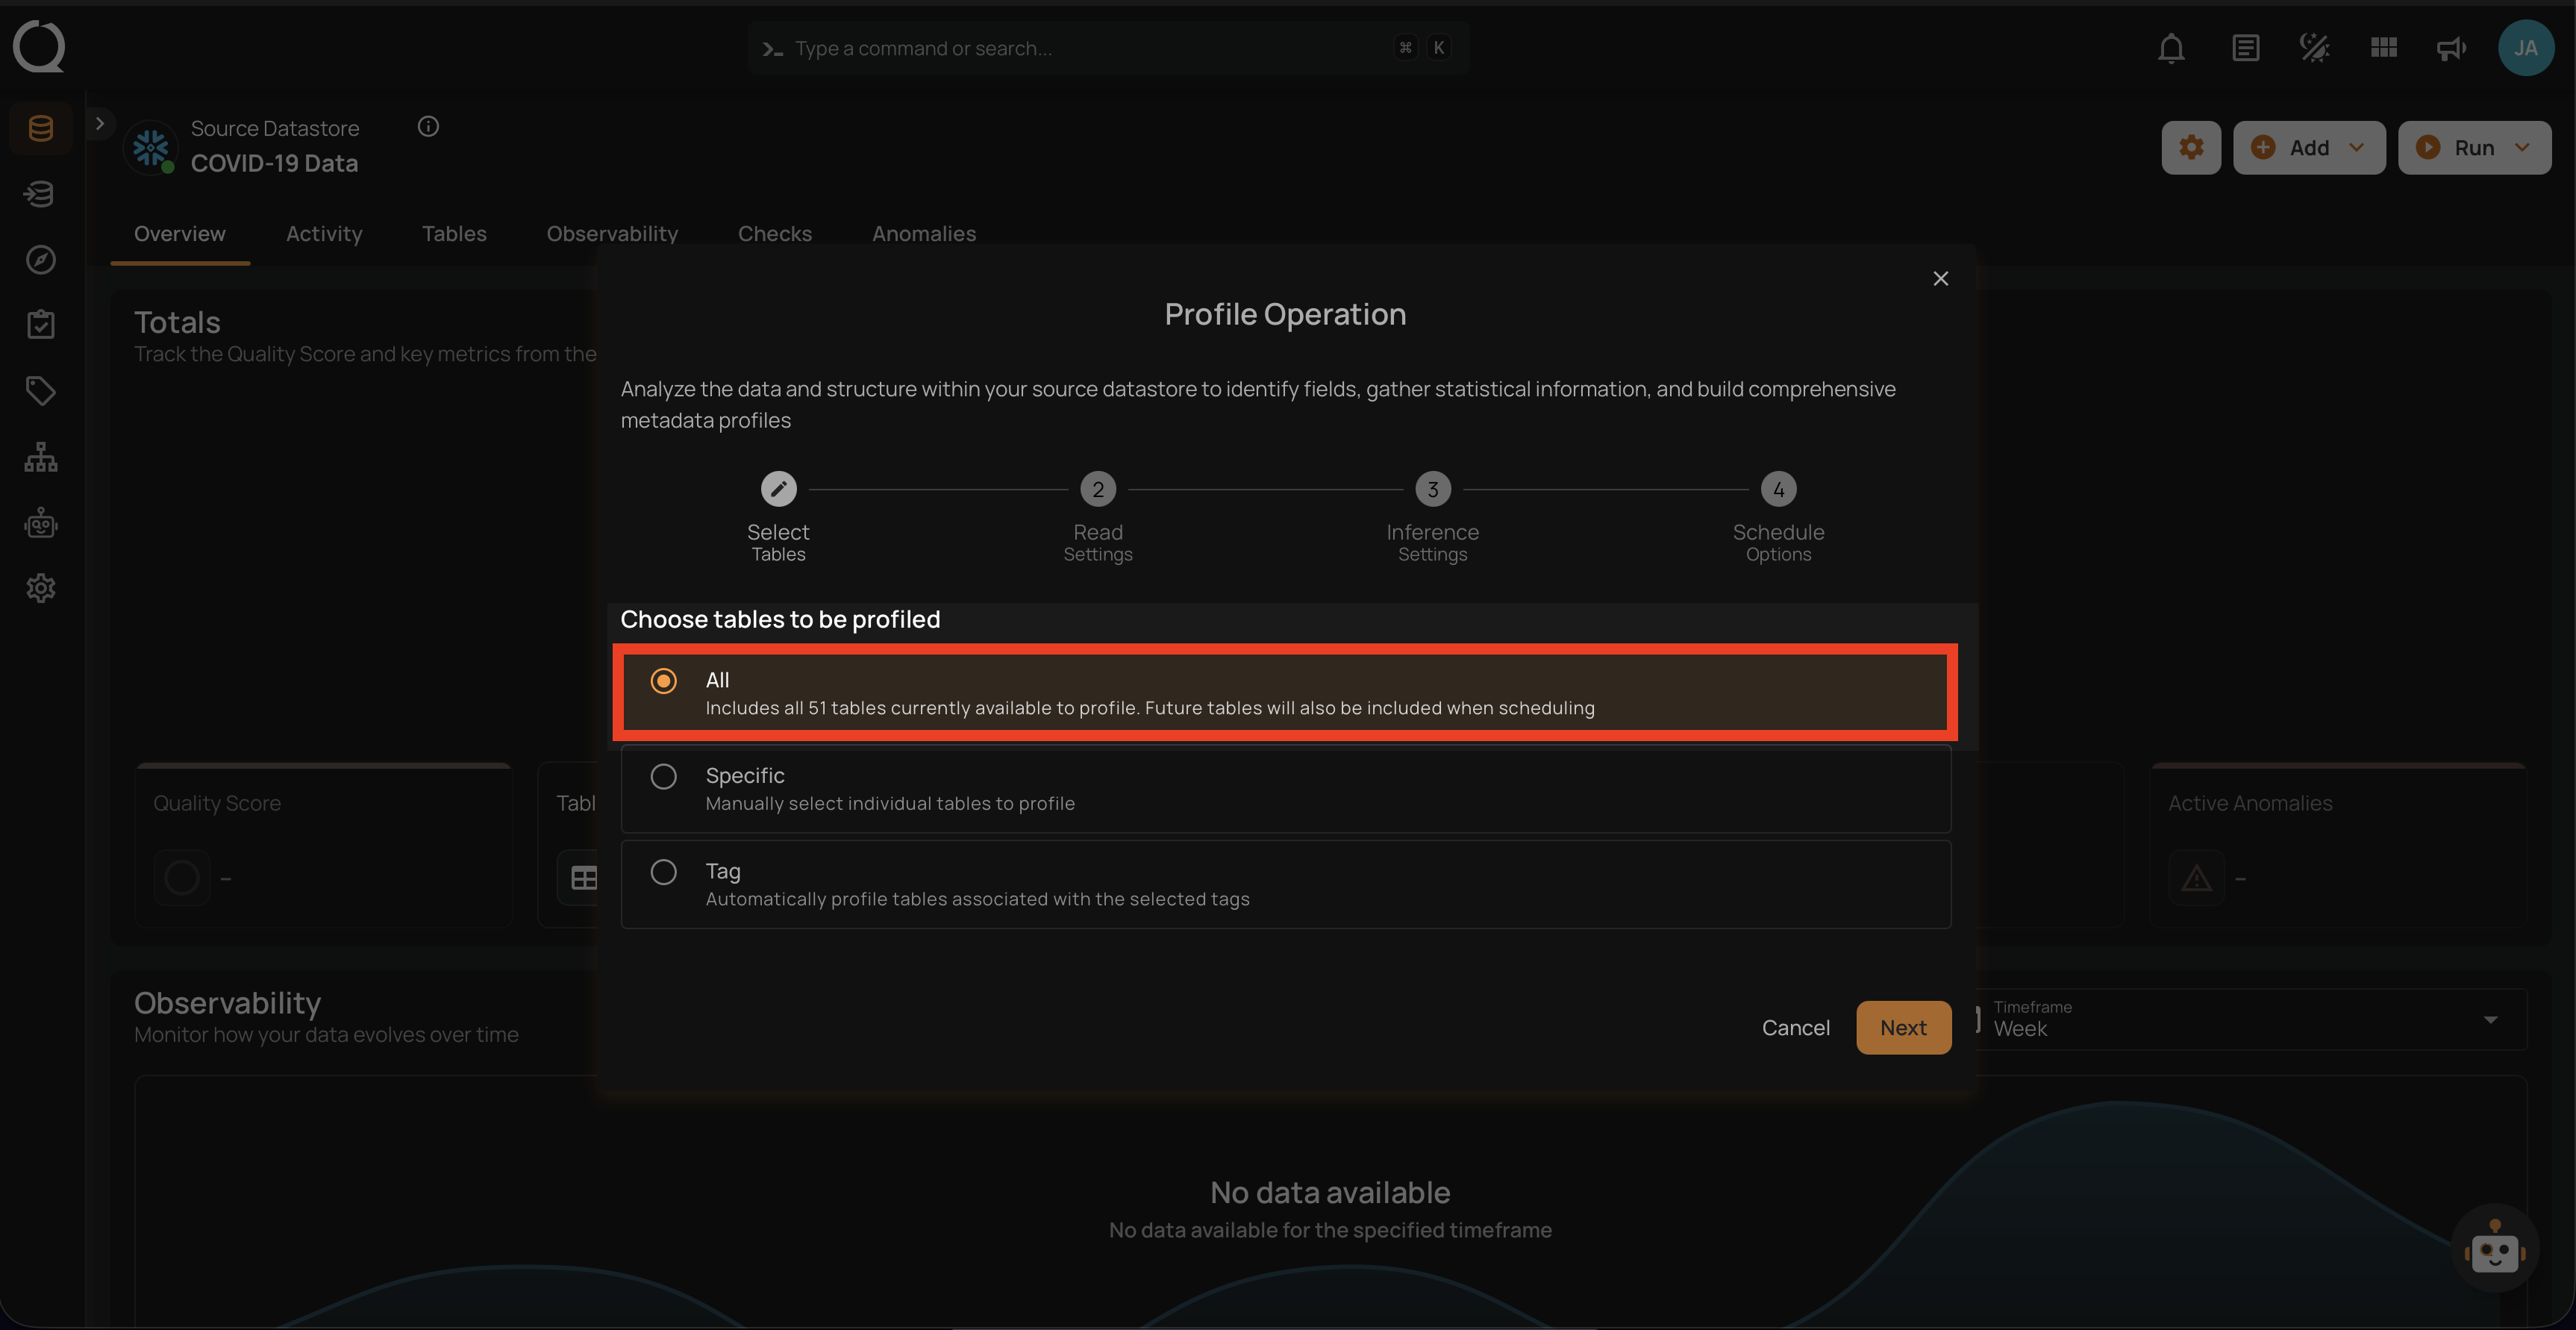
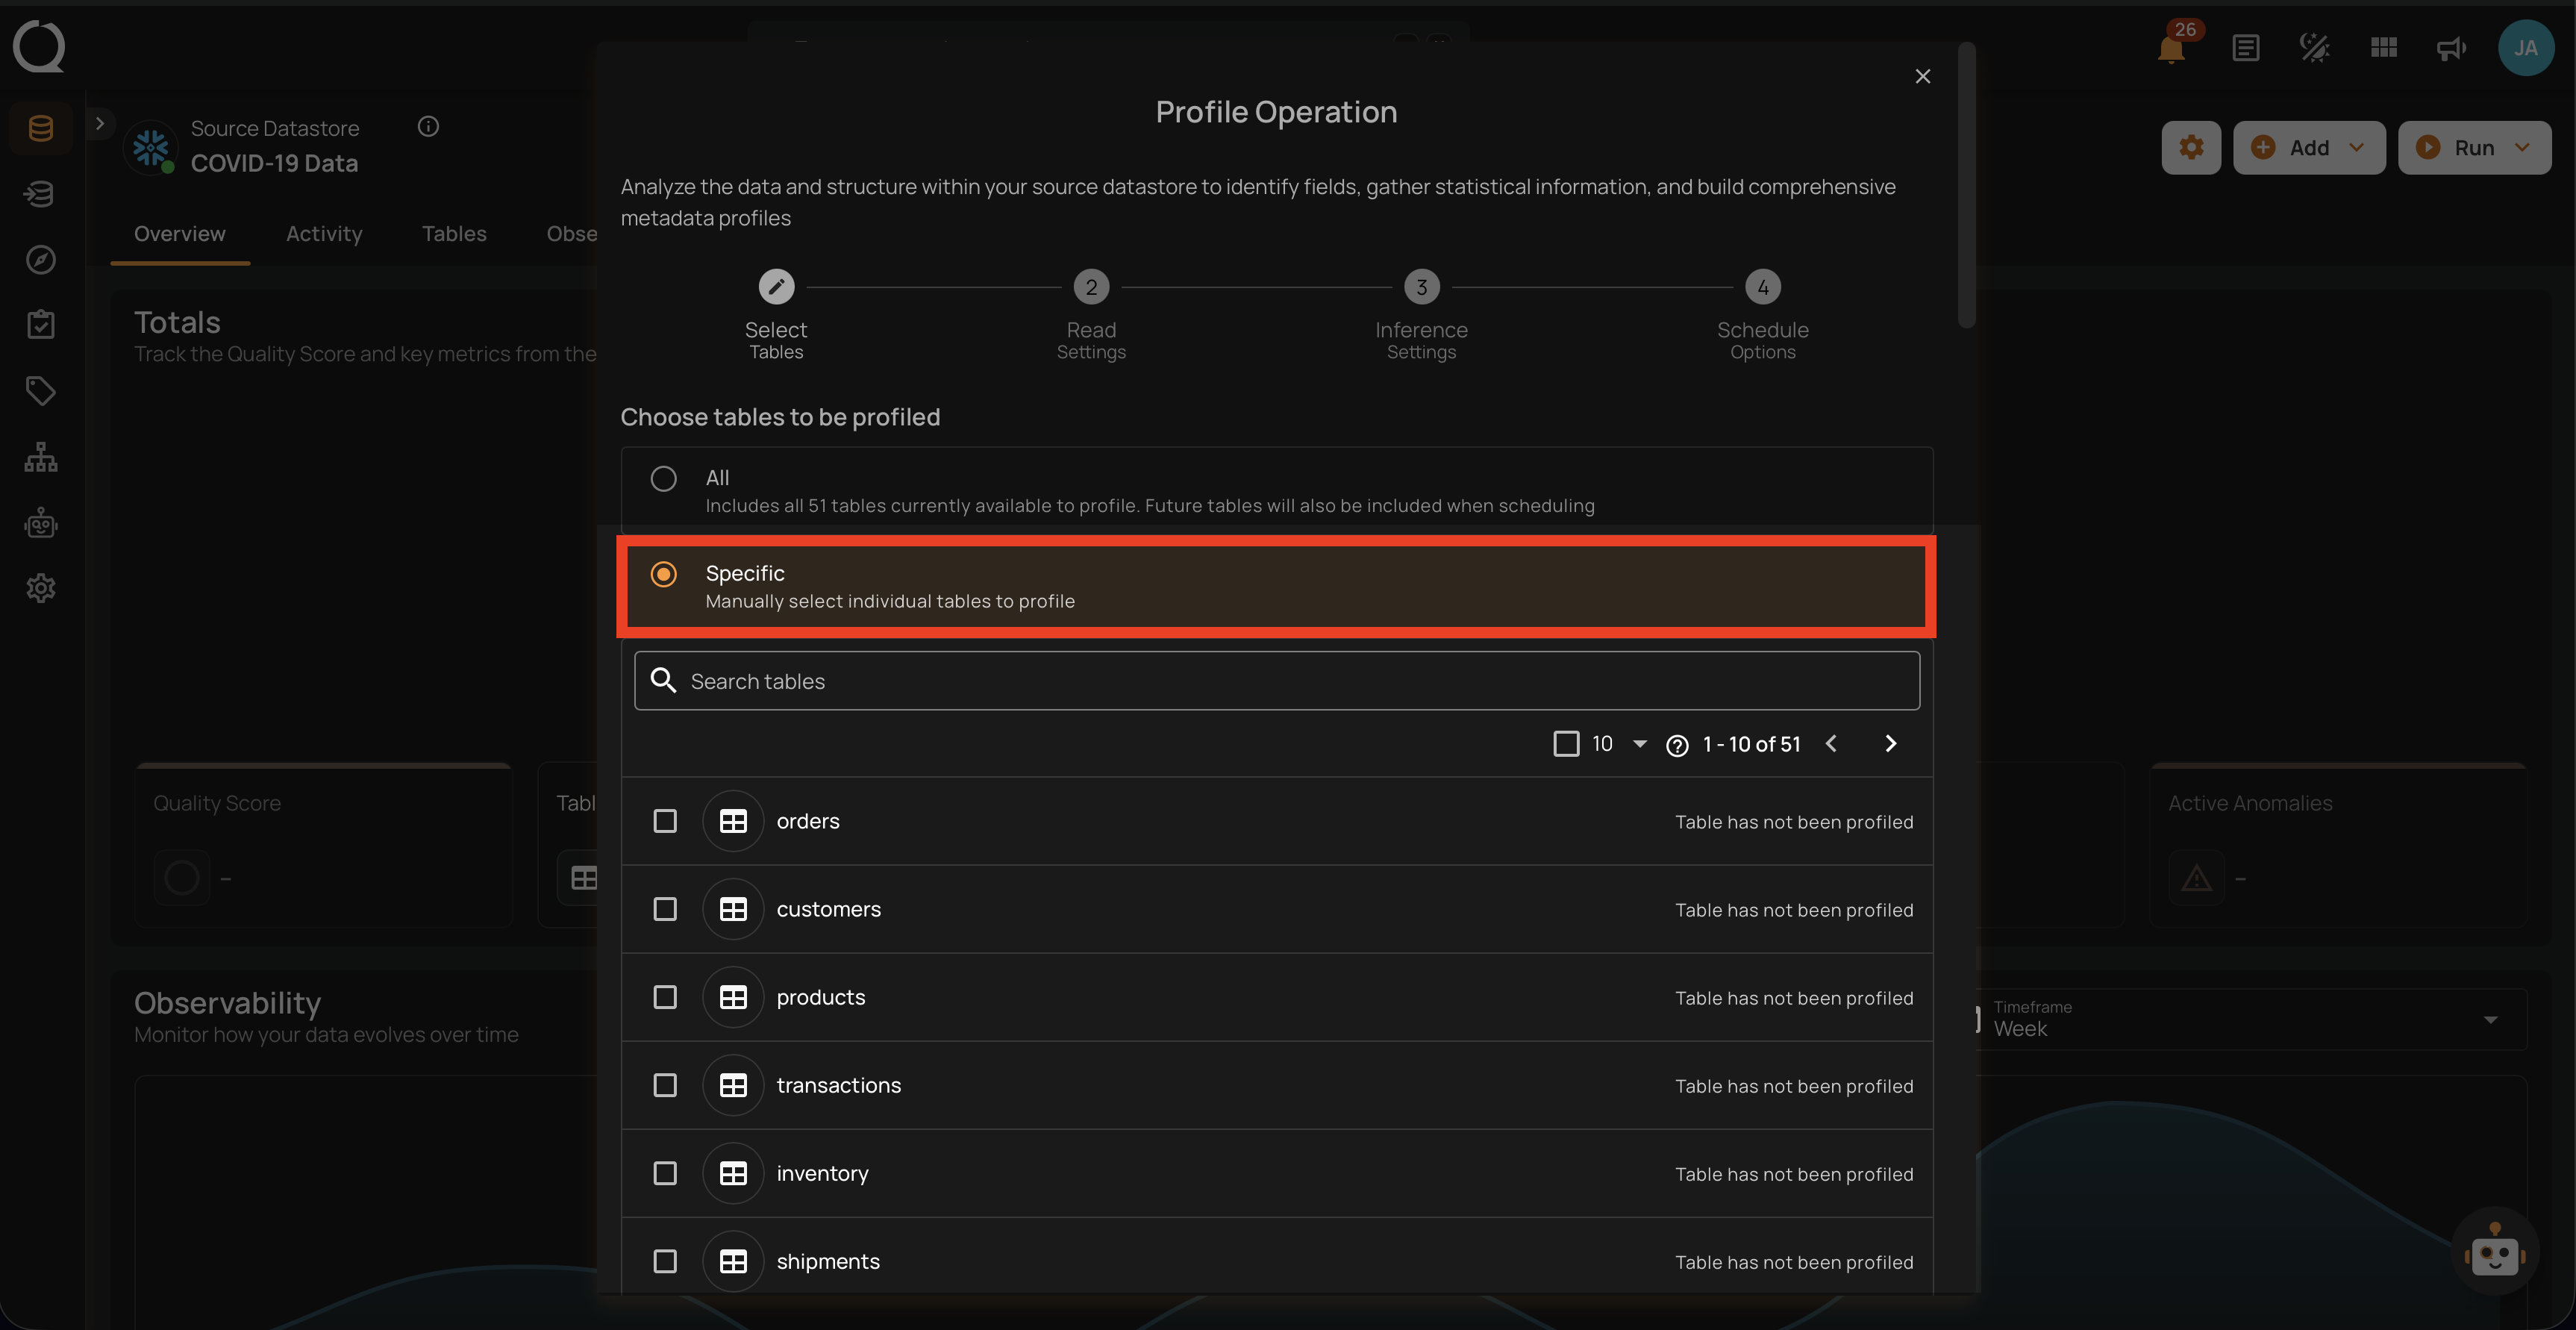
2. Specific
This option allows users to manually select individual tables or files for profiling. It provides the flexibility to focus on particular tables of interest, which can be useful if the user is only interested in a subset of the available data.
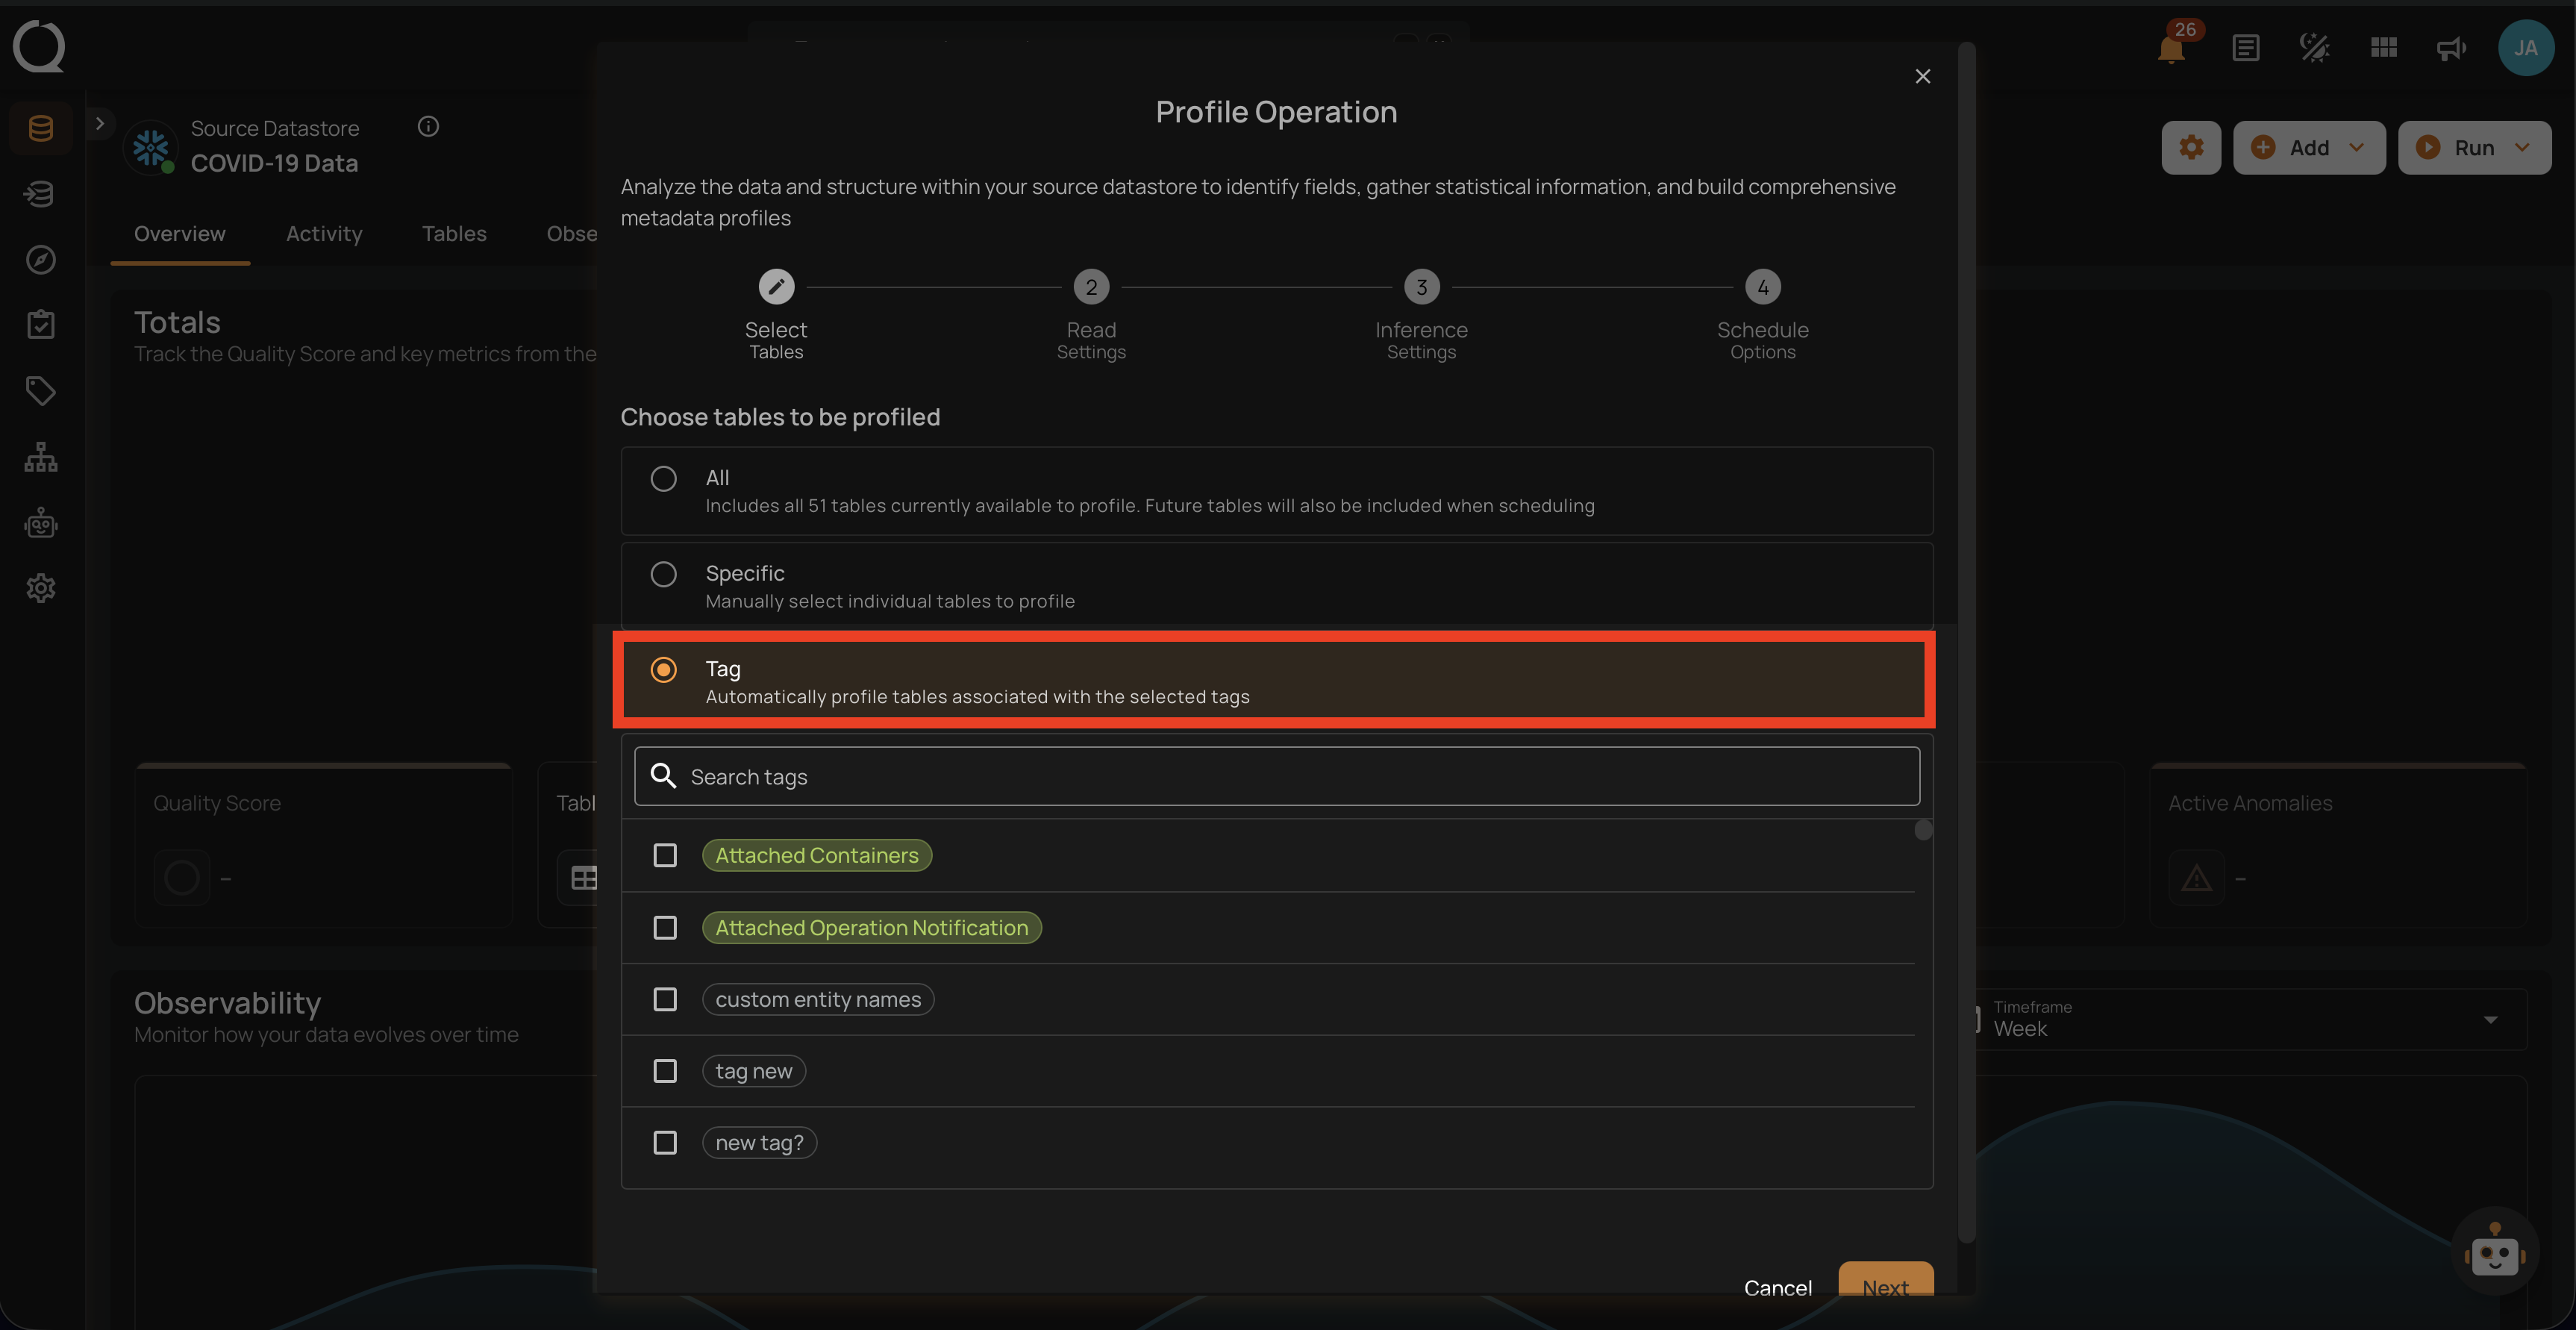
3. Tag
This option automatically profiles tables associated with selected tags. Tags are used to categorize tables, and by selecting a specific tag, all tables associated with that tag will be profiled. This option helps in managing and profiling grouped data efficiently.
Step 3: After making the relevant selections, click on the Next button to configure the Operation Settings.
Step 4: Configure the following two Read Settings:
- Starting Threshold
- Record Limit
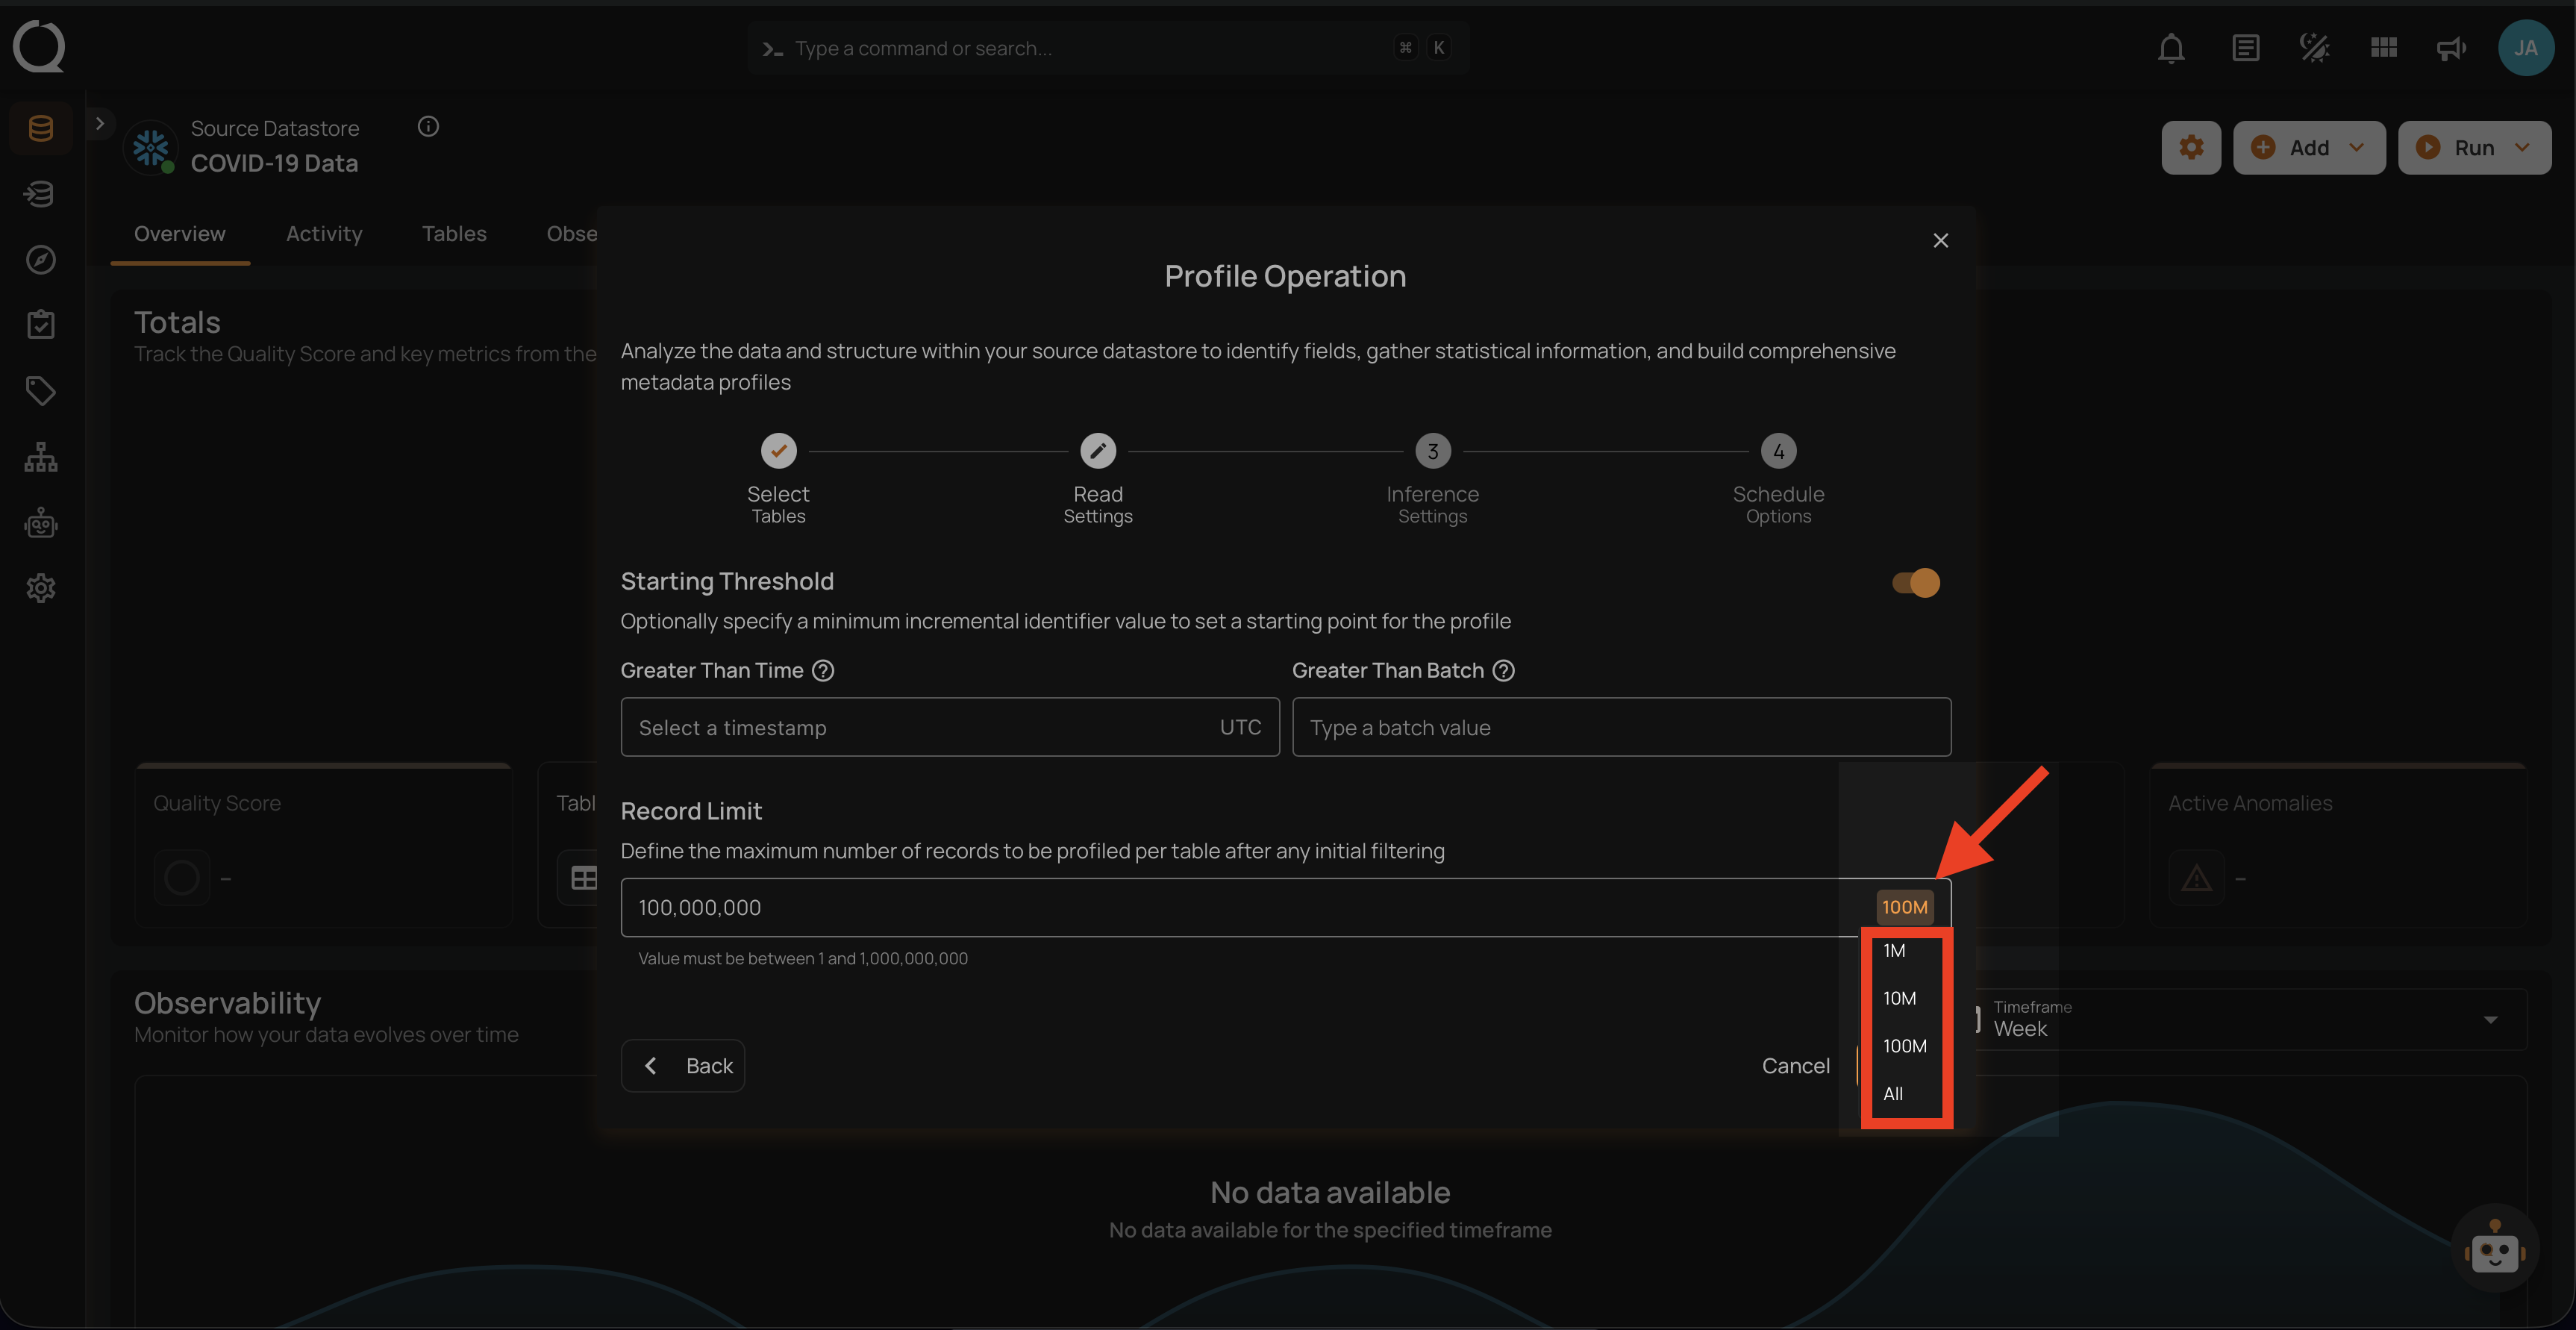
Starting Threshold
This setting allows users to specify a minimum incremental identifier value to set a starting point for the profile operation. It helps in filtering data from a specific point in time or a particular batch value.
-
Greater Than Time: Users can select a timestamp in UTC to start profiling data from a specific time onwards. This is useful for focusing on recent data or data changes since a particular time.
-
Greater Than Batch: Users can enter a batch value to start profiling from a specific batch. This option is helpful for scenarios where data is processed in batches, allowing the user to profile data from a specific batch number onwards.
Note
The starting threshold i.e. Greater Than Time and Greater Than Batch are applicable only to the tables or files with an incremental timestamp strategy.
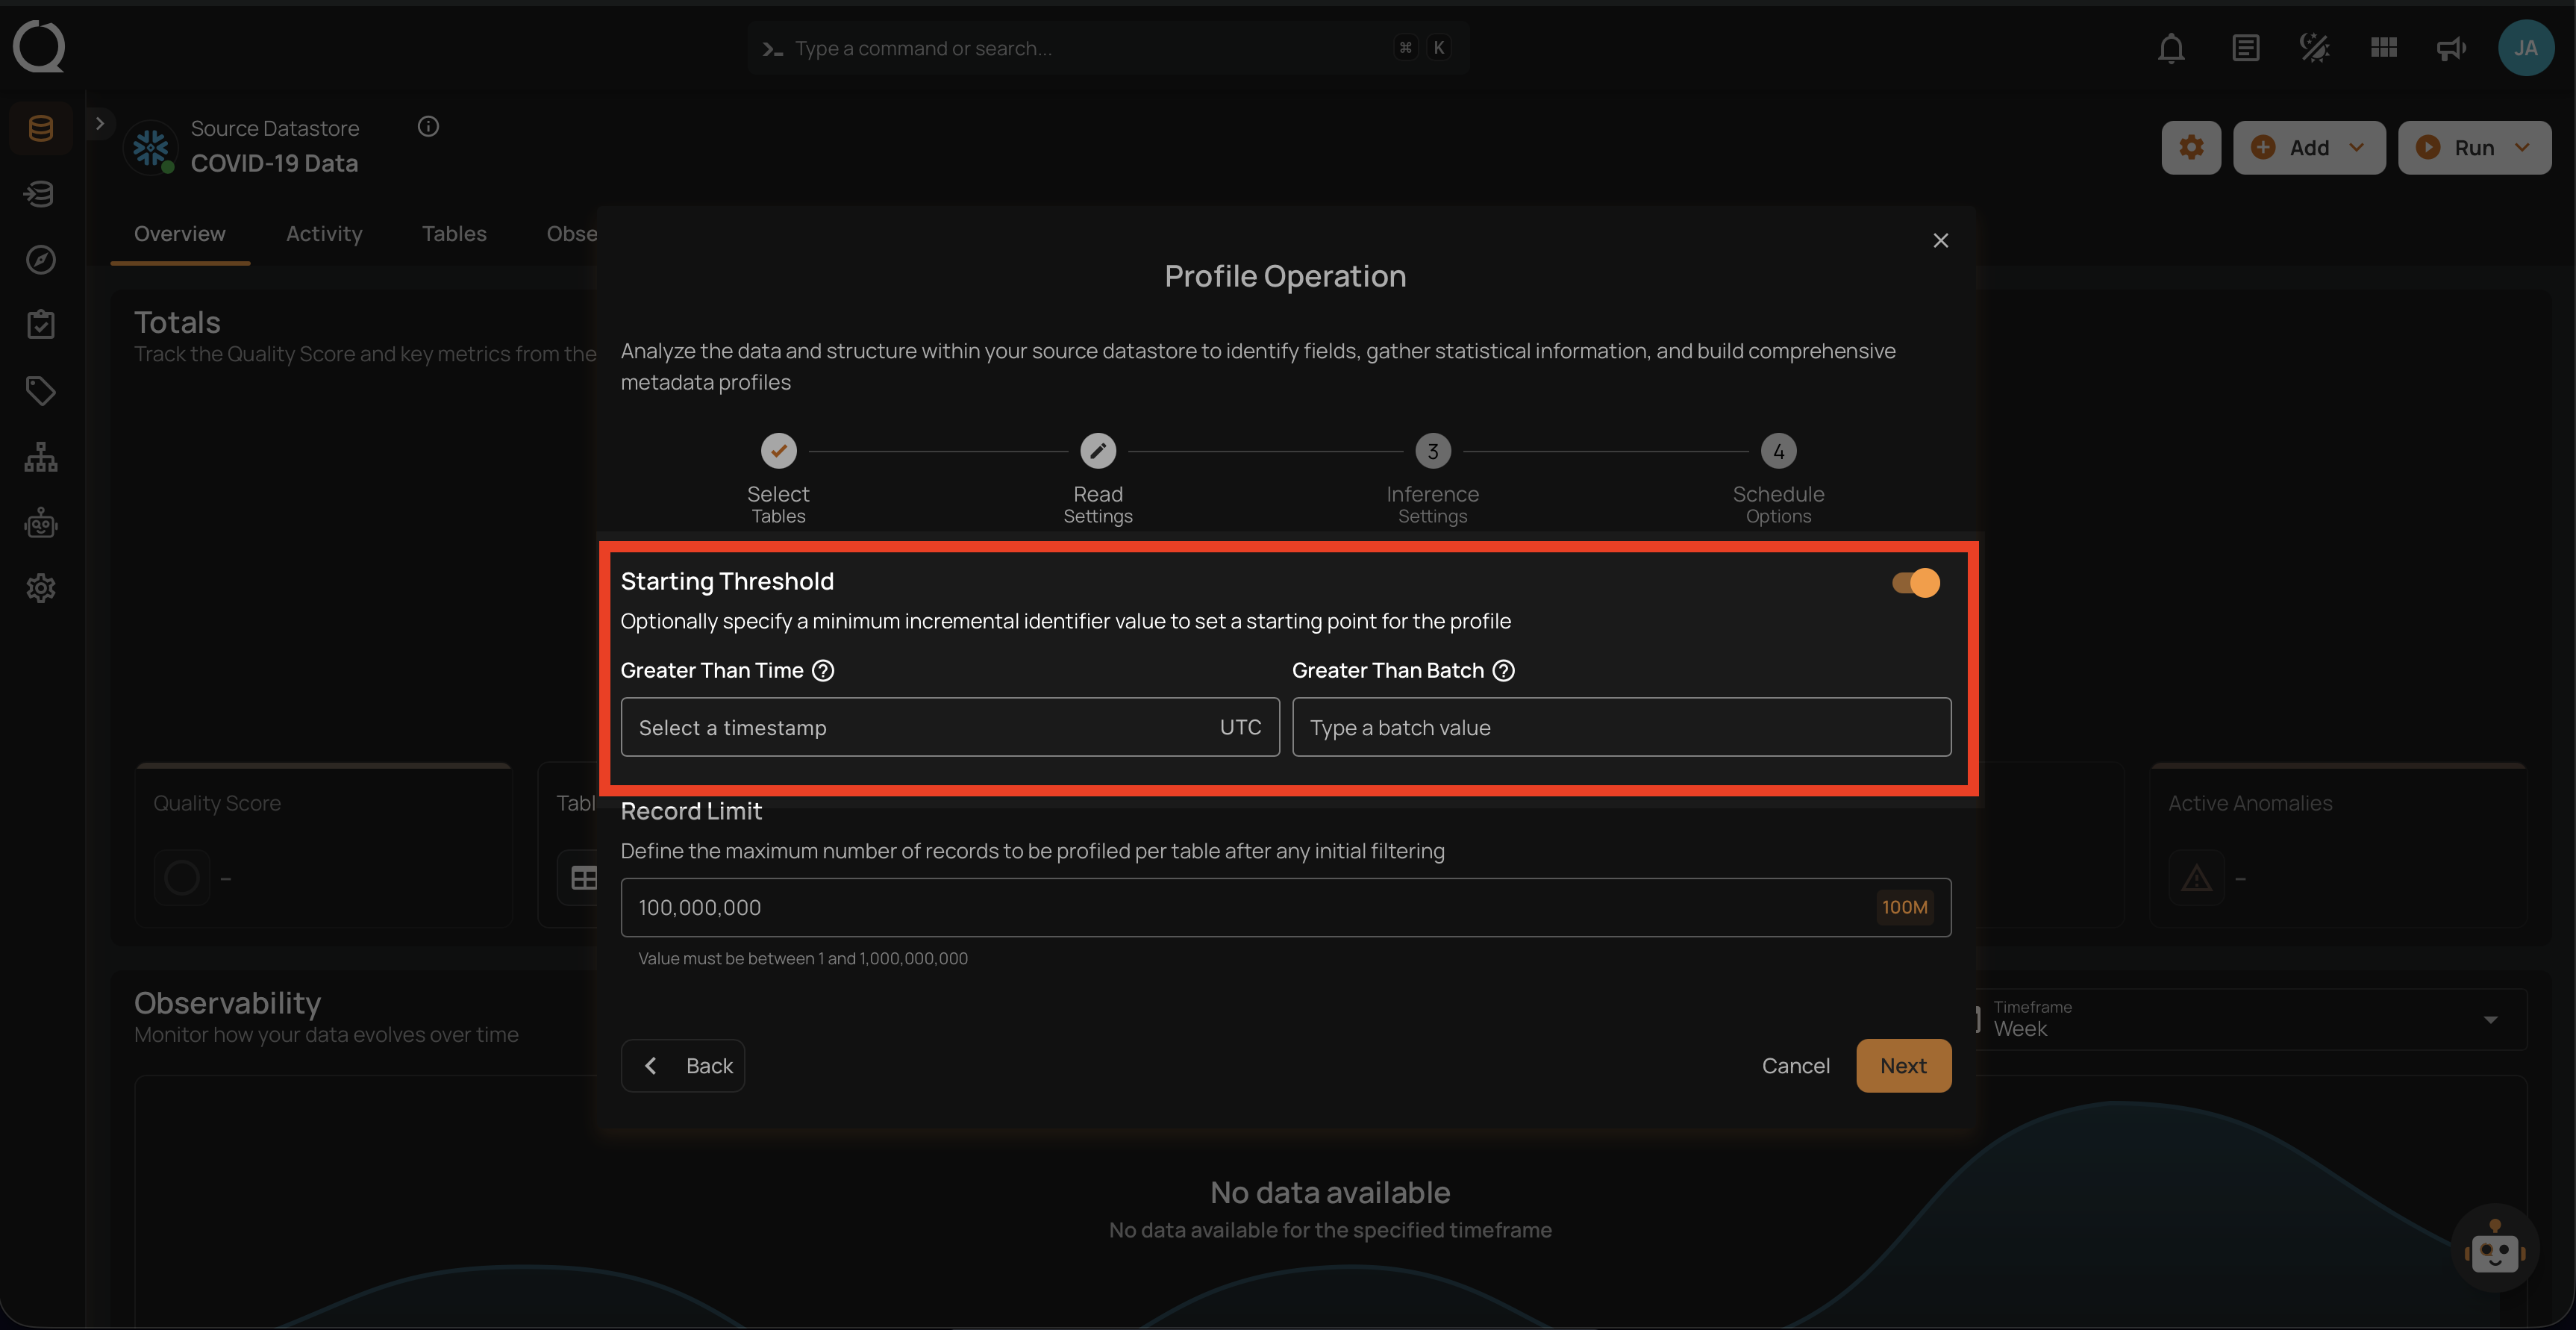
Record Limit
Define the number of records to be profiled per table: This feature allows users to manually enter a custom record limit value using a text field in the profile operation. This setting helps in controlling the scope of the profiling operation, particularly for large datasets, by capping the number of records to analyze.
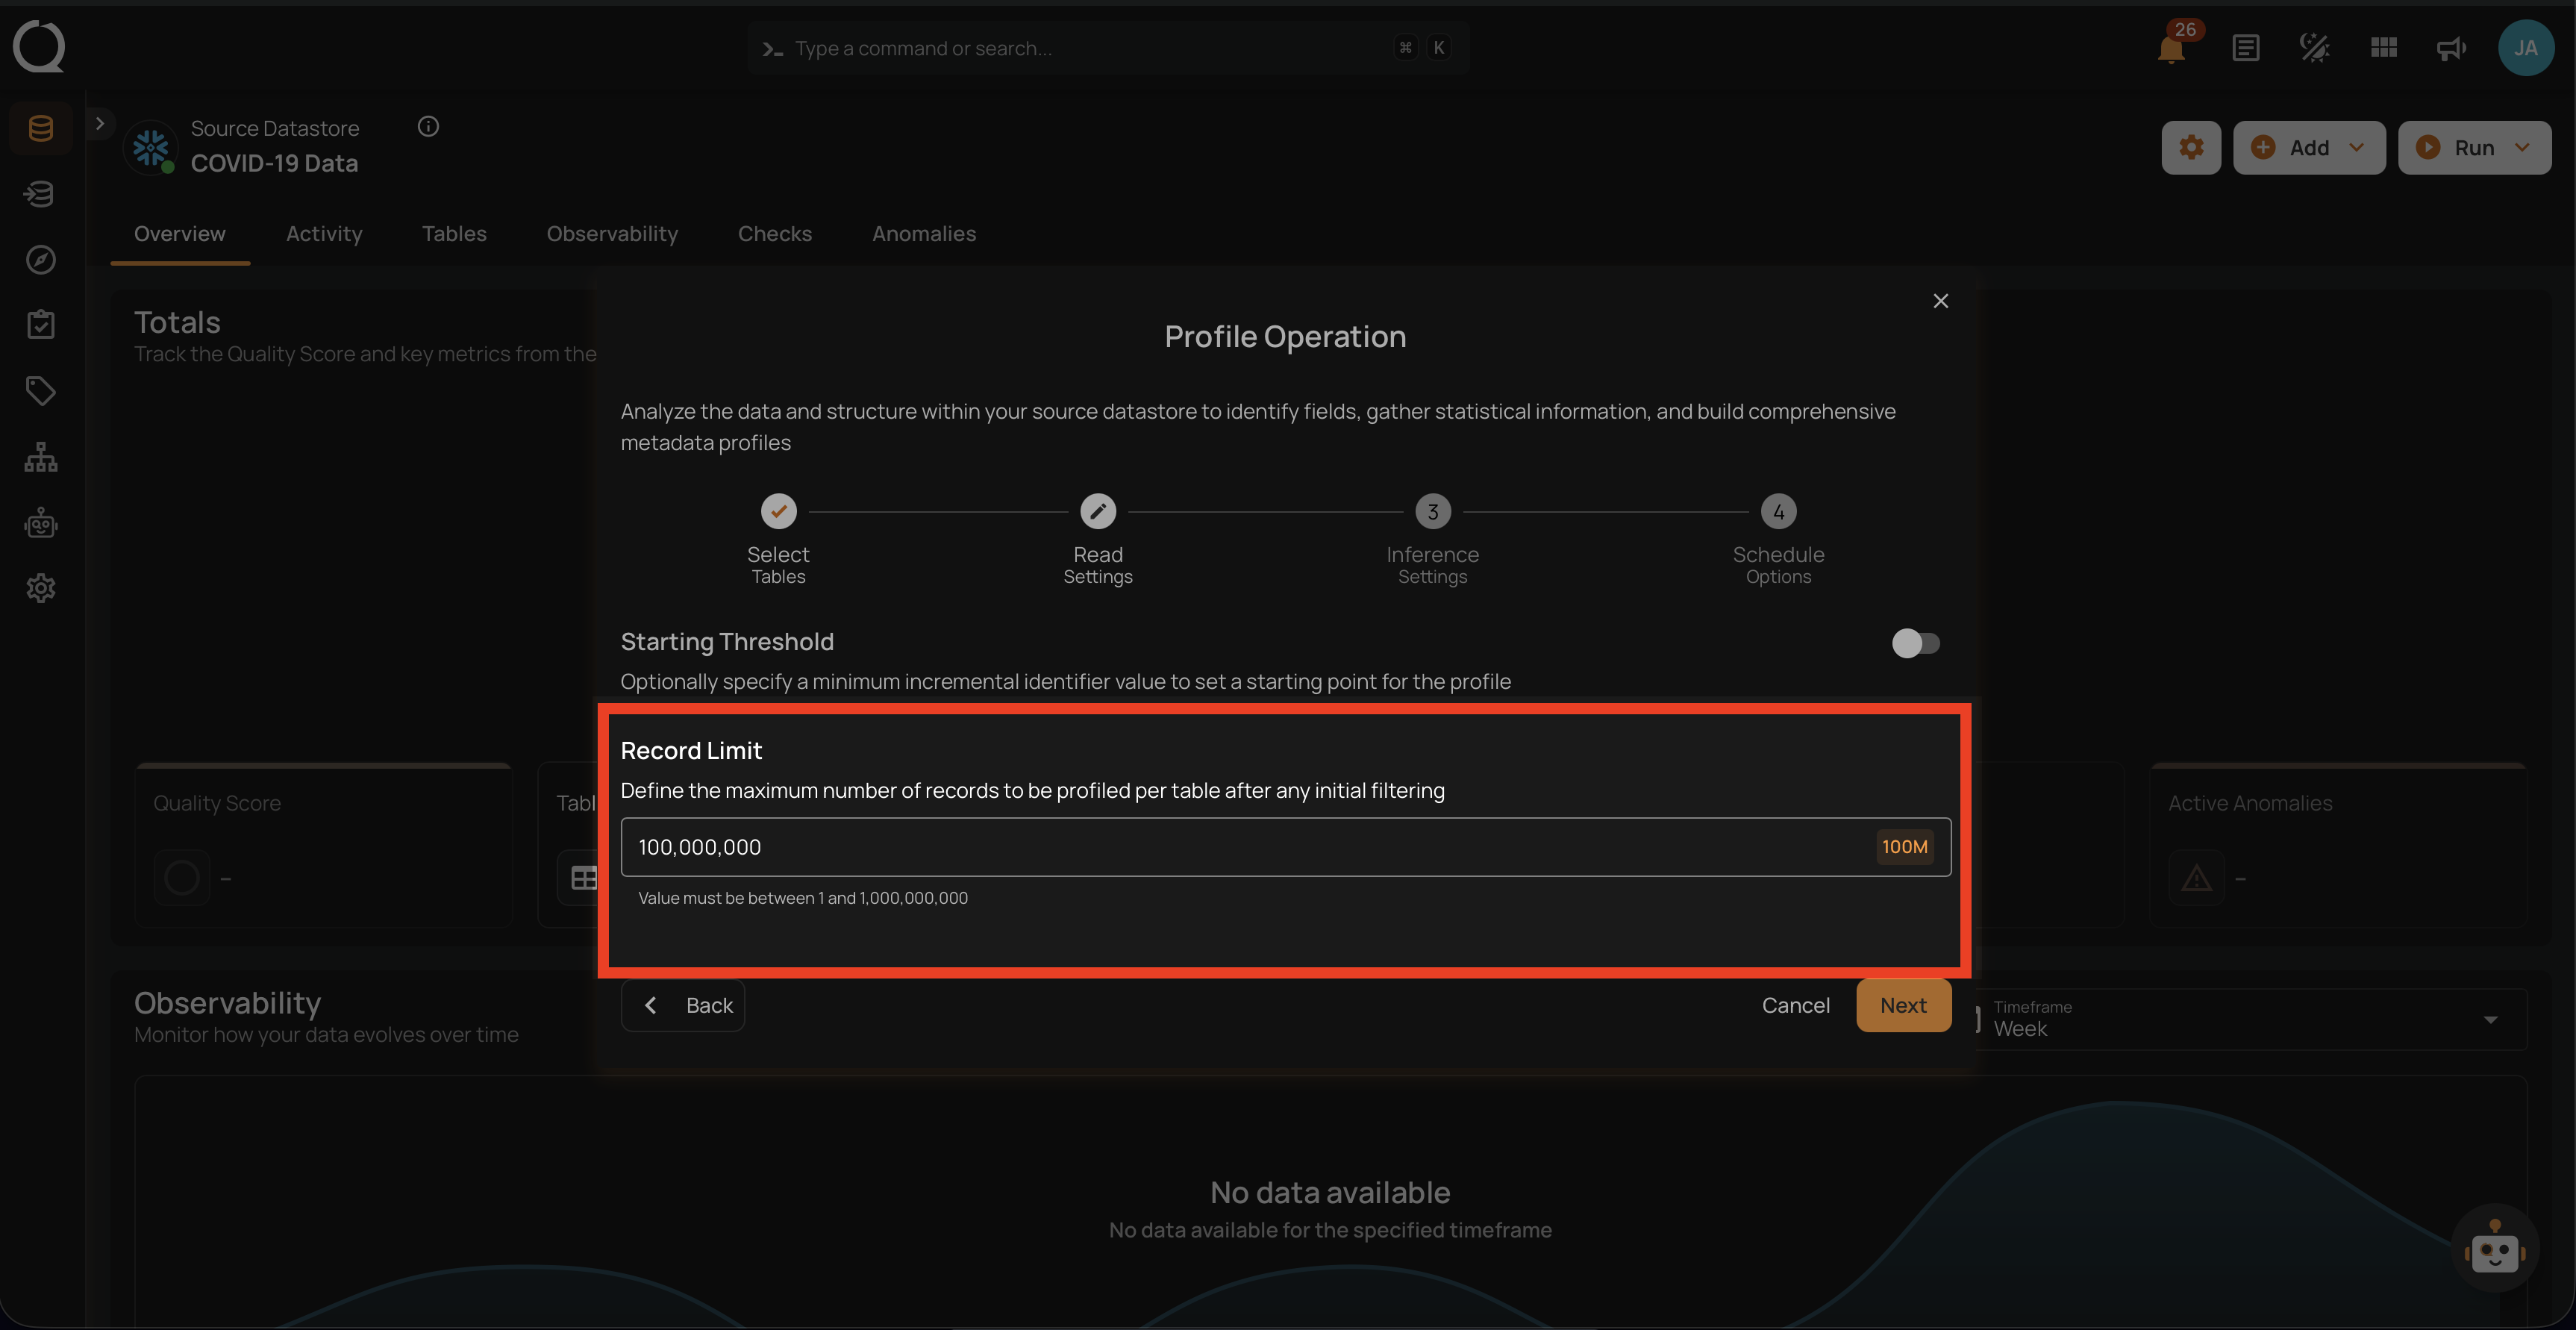
You can also use a drop-down menu to quickly select from commonly used limits such as 1M, 10M, 100M, and All.
Note
The number of records must be between 1 and 1,000,000,000.
Step 5: After making the relevant selections, click on the Next button to configure the AI Management step.
Step 6: Configure the two sections inside the AI Management step:
- Effort
- Oversight
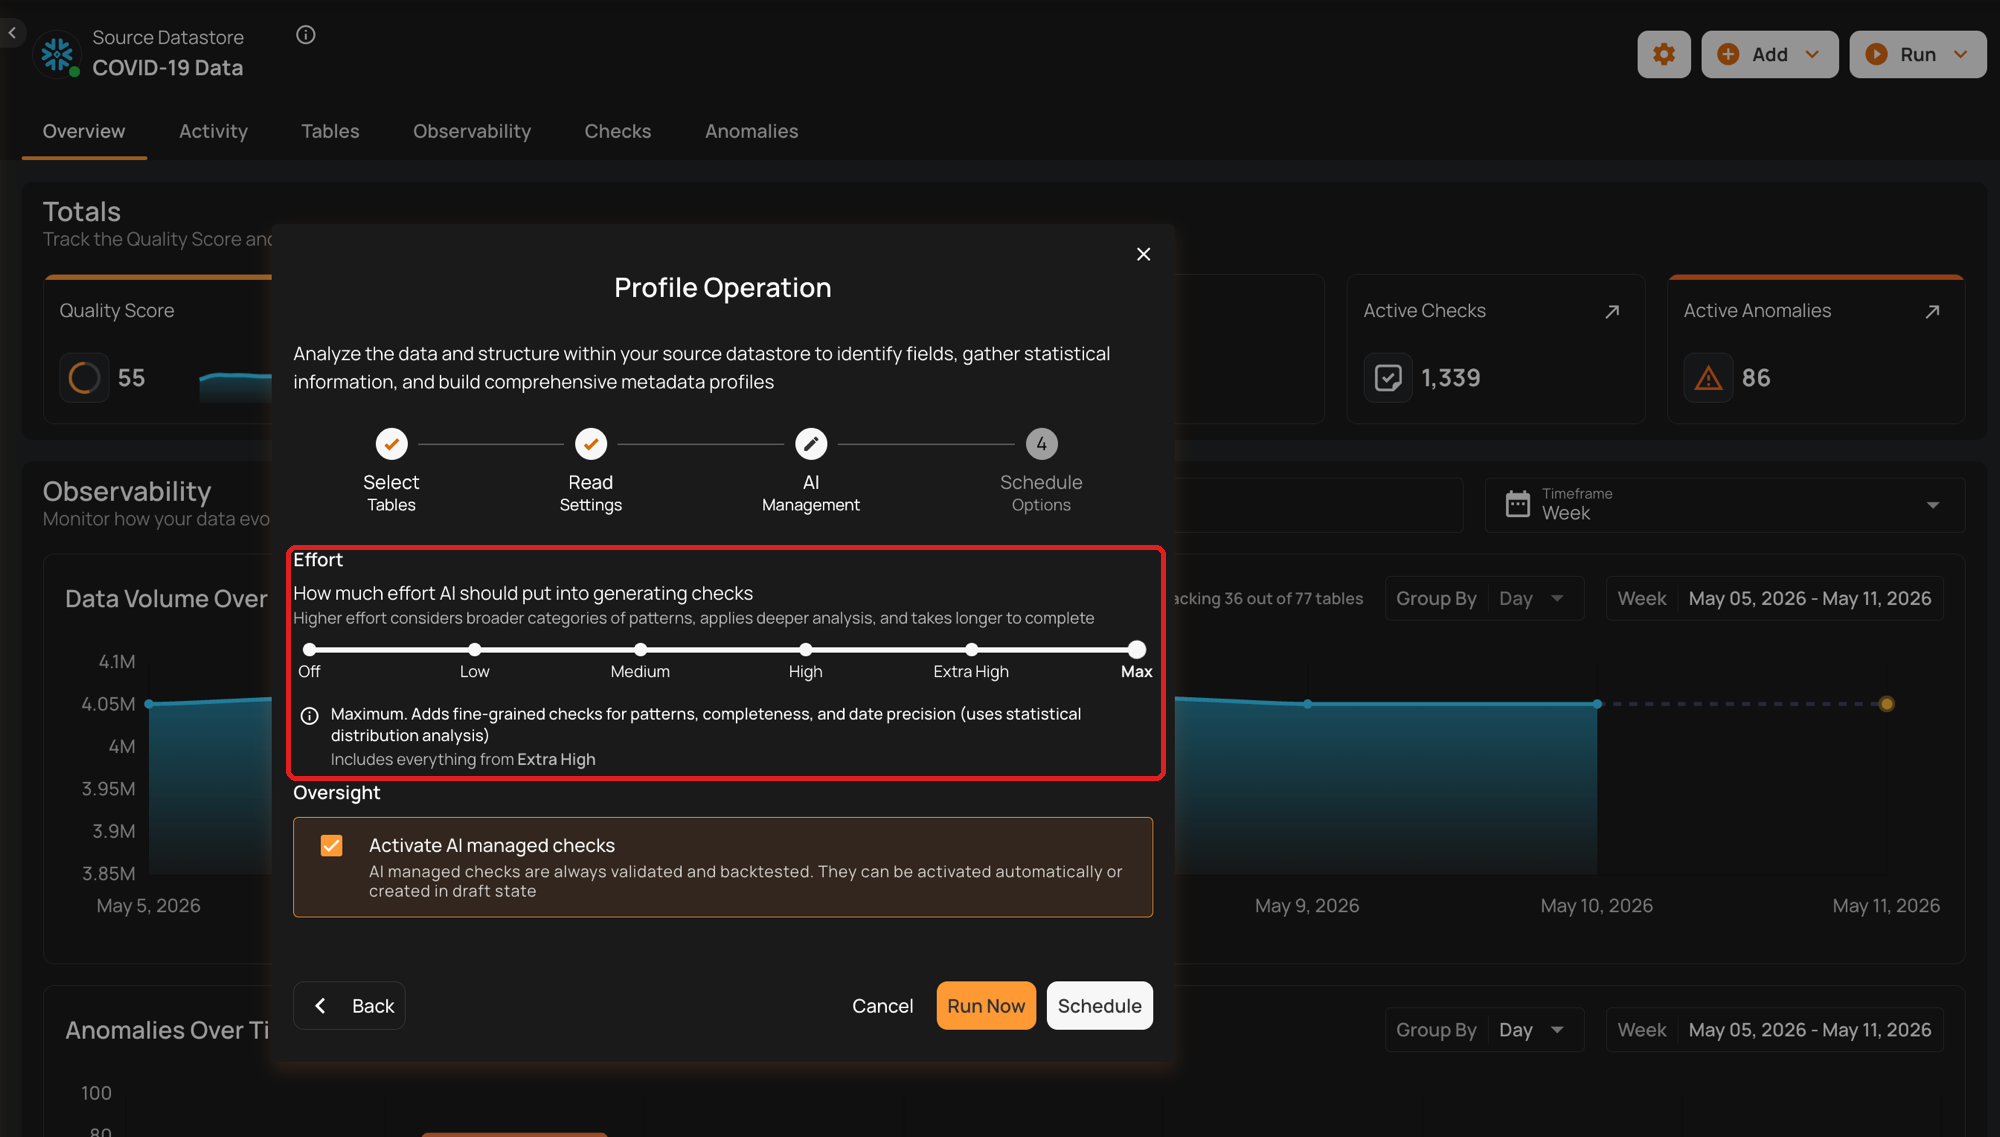
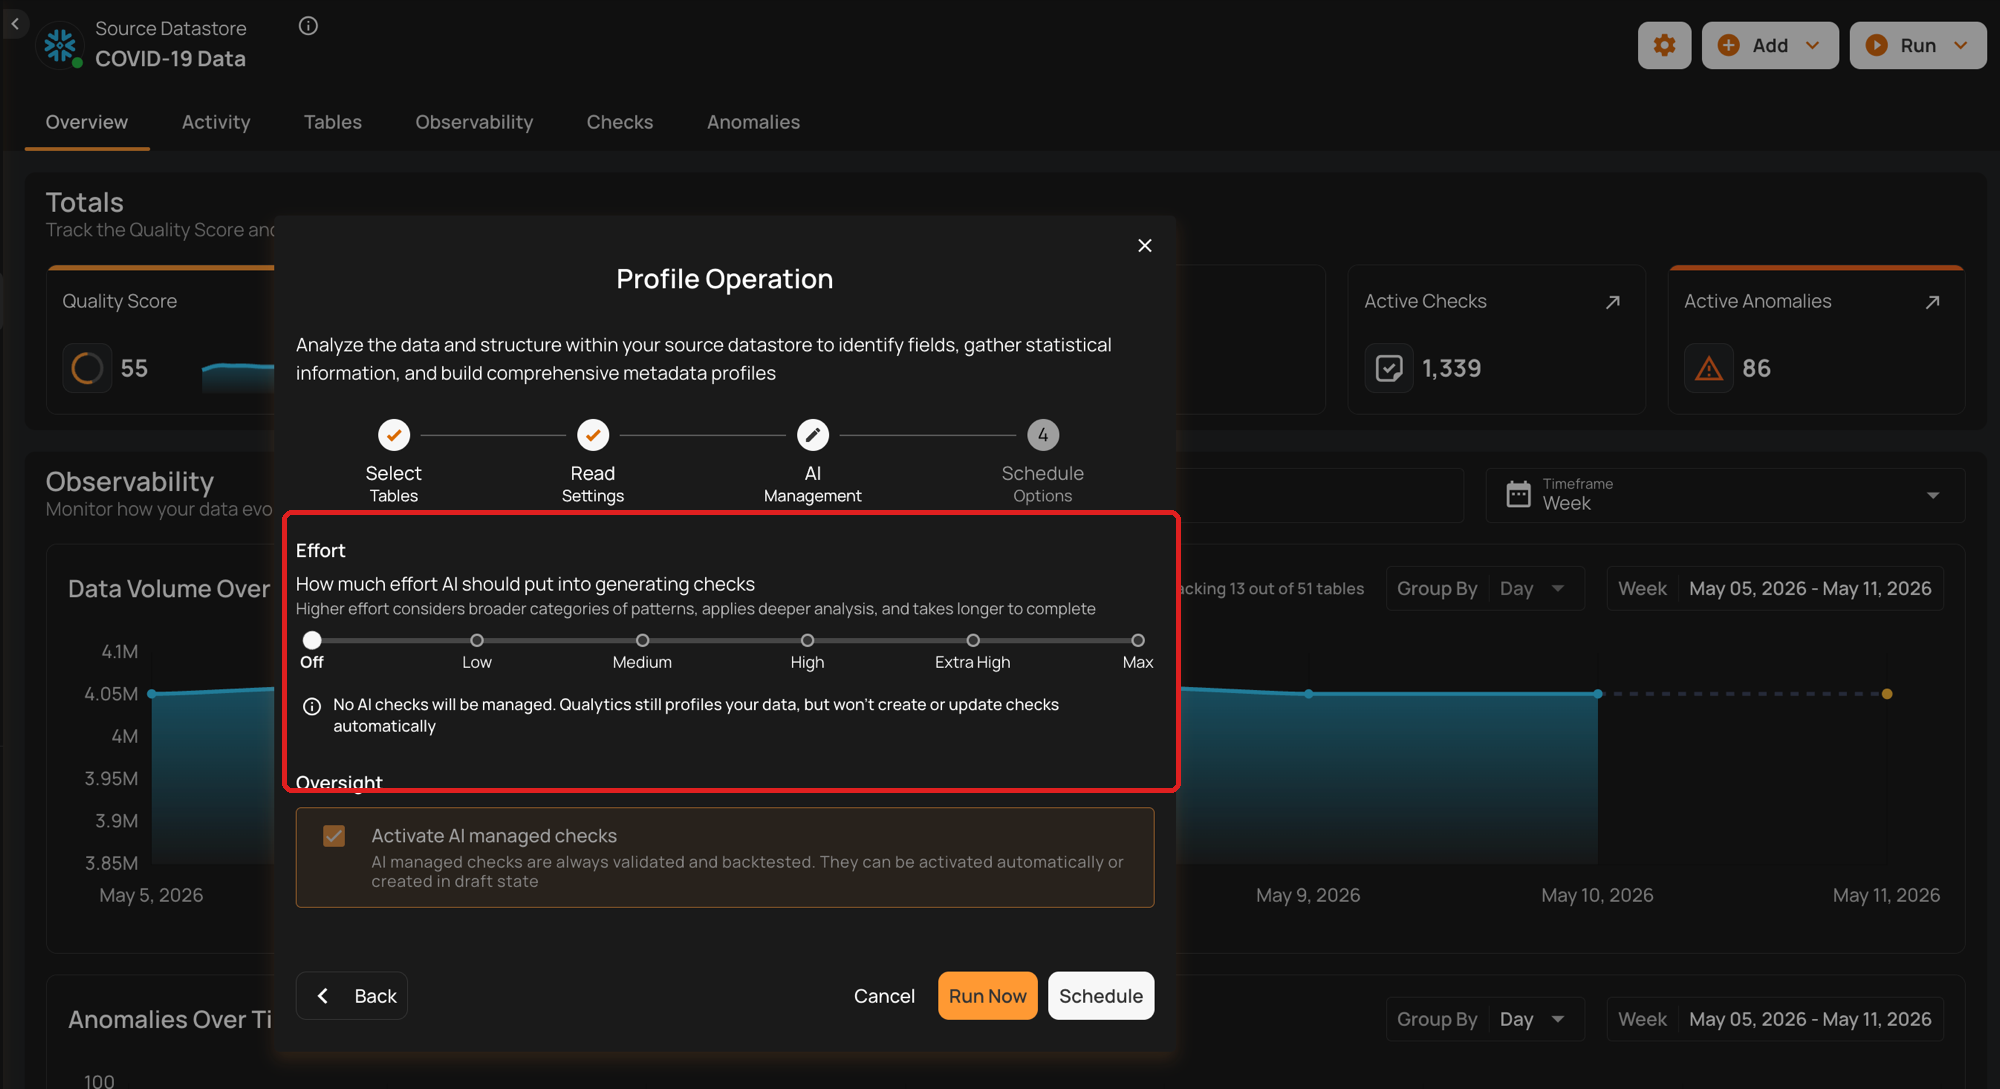
Effort
The AI Effort setting controls how much work Qualytics AI puts into generating data quality checks during profiling. Selecting a higher level expands the families of checks AI considers; selecting a lower level limits AI to faster, simpler checks (or disables AI generation entirely).
The control is a labeled scale with six clickable markers. Selecting a level shows a plain-language description of what AI does at that level.
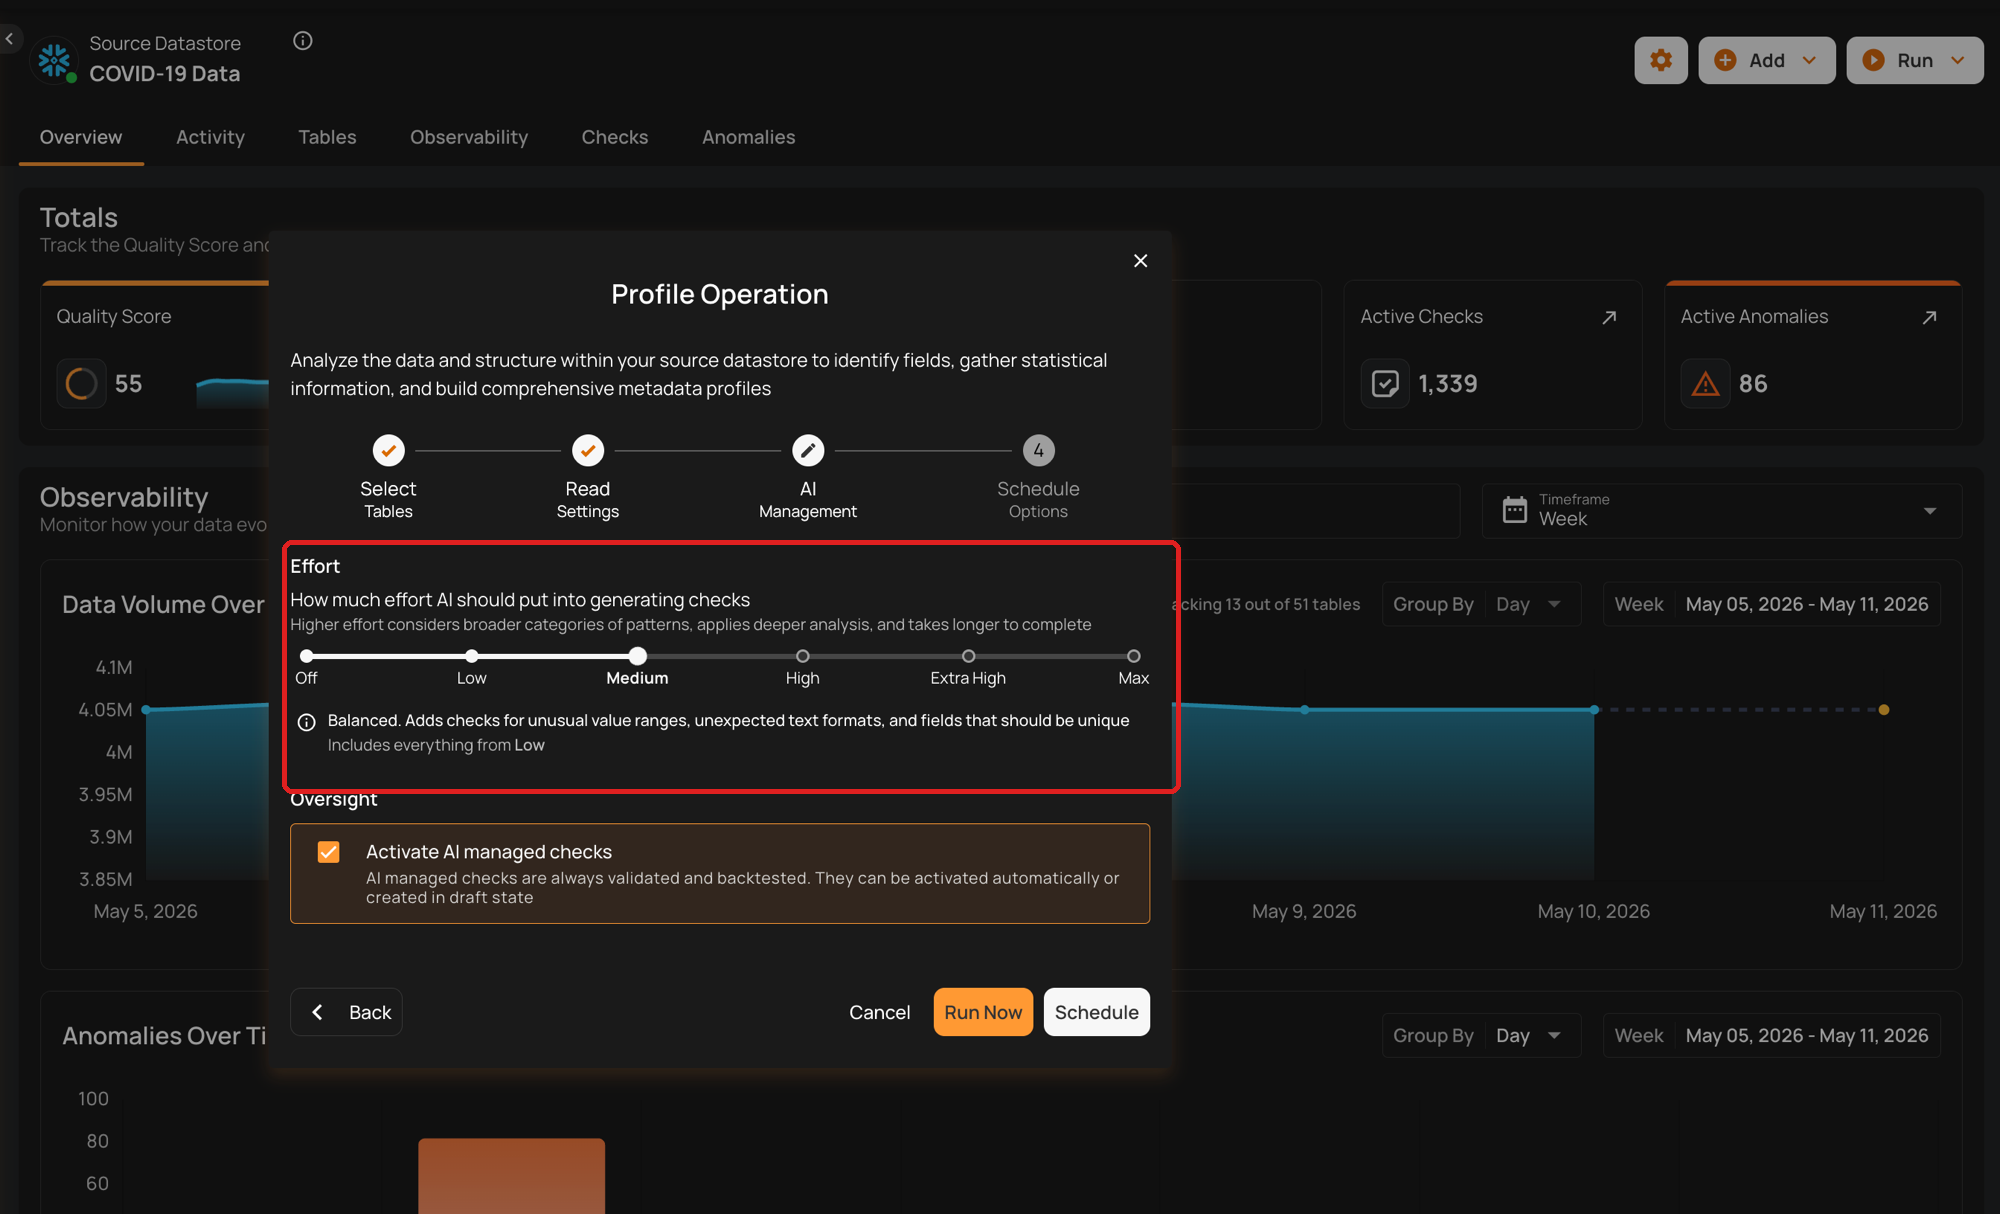
Default Configuration
By default, AI Effort is set to Medium, which balances coverage and runtime for most datasets. You can adjust the level at any time based on the depth of analysis you want AI to perform.
AI Effort Levels
The AI Effort scale has six levels. Each higher level includes all the check families from the previous levels and adds new ones, so depth and runtime grow together.
Note
Each level includes all the check families from the previous levels and adds new ones specific to that level. For example, Low focuses on basic checks; Medium adds value-range and pattern checks on top of those; Max covers all check families AI can generate.
Off
At this level, no AI Managed checks will be generated. Qualytics still profiles your data, but won't create or update checks automatically. This is suitable when you want complete control over which checks are applied, or if no AI management is needed. Ideal for scenarios where profiling should not generate any constraints and all checks will be user-authored.
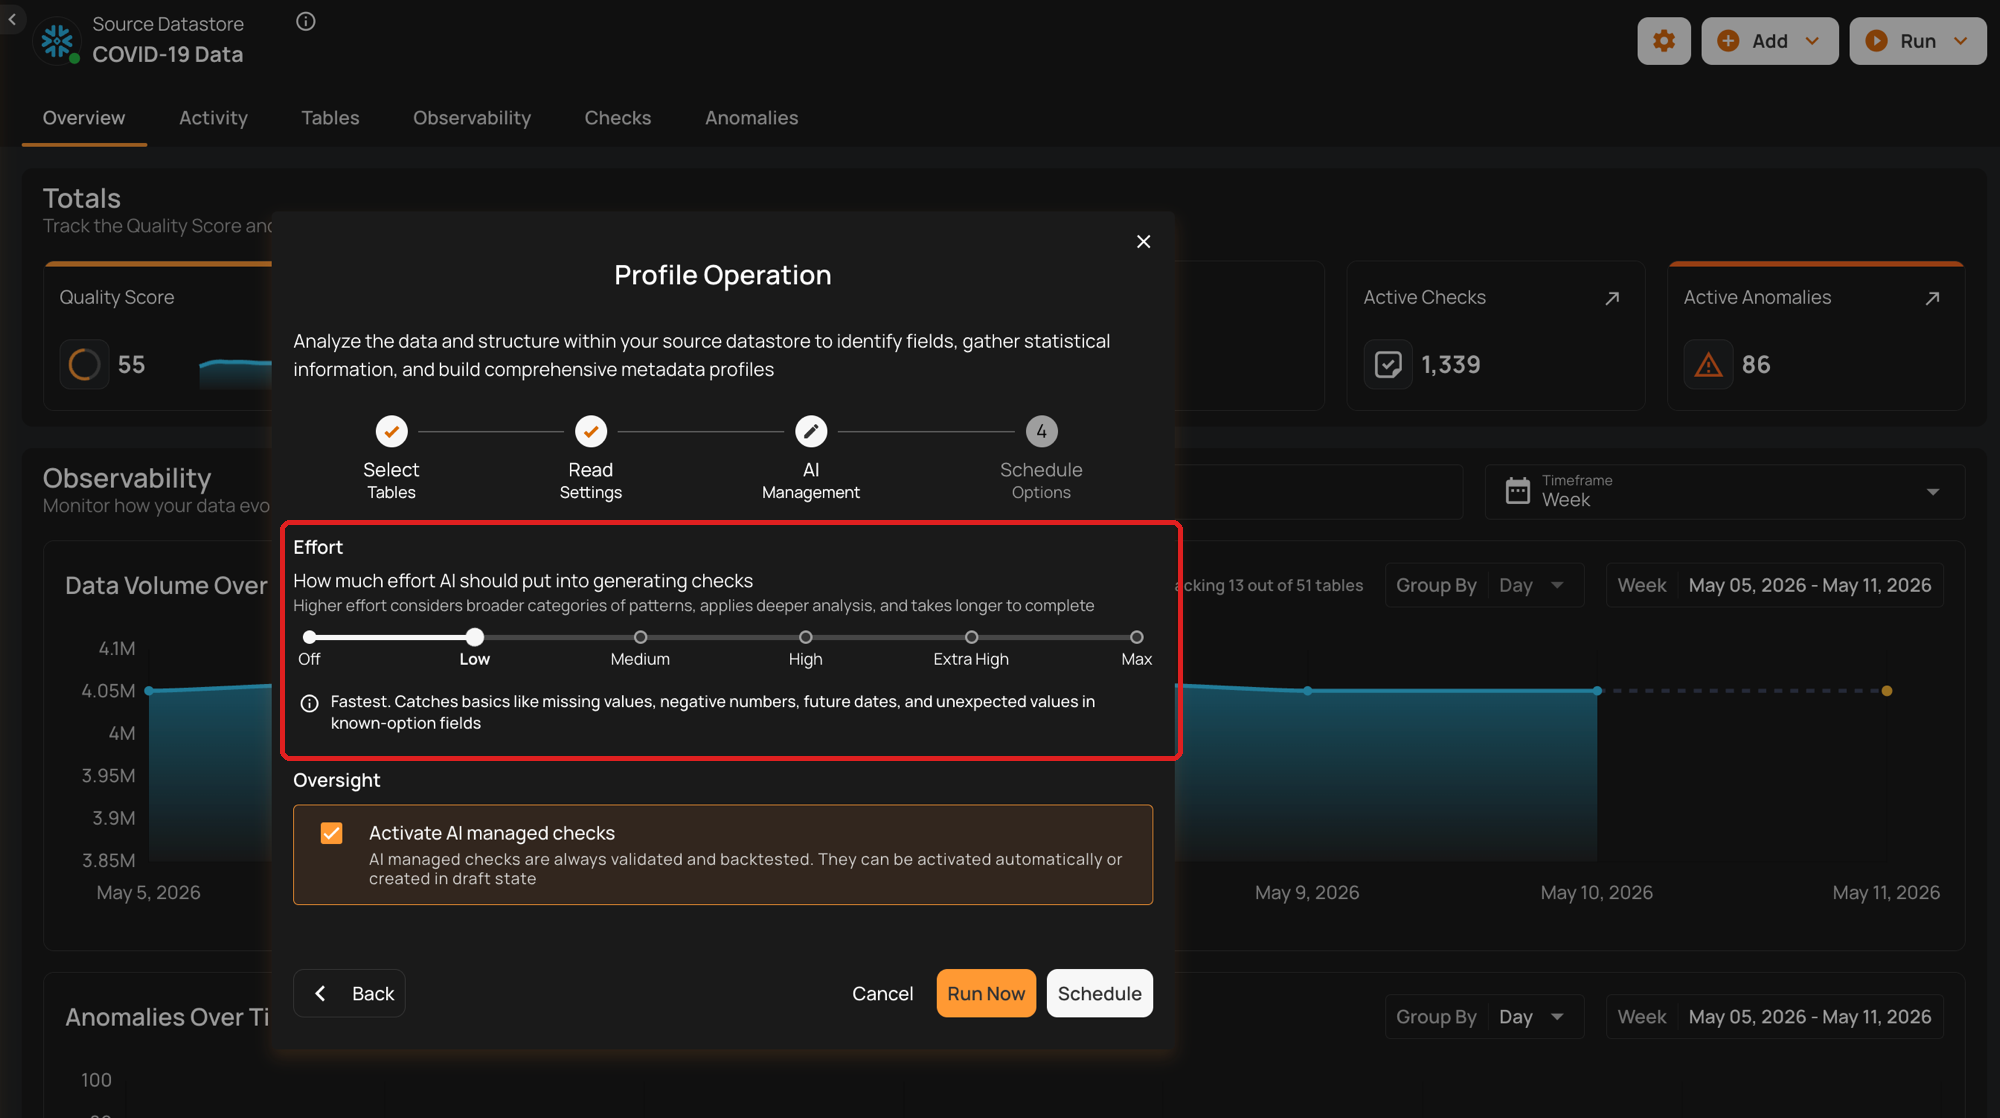
Low: Basic Data Integrity and Simple Value Threshold Checks
The fastest level. Catches basics like missing values, negative numbers, future dates, and unexpected values in known-option fields. Included check families:
-
Completeness Checks: Ensure data fields are complete if previously complete.
-
Categorical Range Checks: Validate if values fall within a predefined set of categories.
-
Non-Negative Numbers: Ensure numeric values are non-negative.
-
Non-Future Date/Time: Ensure datetime values are not set in the future.
Use Case: Suitable for datasets where basic integrity checks are sufficient.
The following table shows the AI Managed checks that Qualytics AI generates based on the user's data. At Low, five checks are created.
| AI Managed Checks | Reference |
|---|---|
| Not Null (record) | See more. |
| Any Not Null (record) | See more. |
| Expected Values (record) | See more. |
| Not Negative | See more. |
| Not Future | See more. |
Medium: Value Range and Pattern Checks
Balanced. Adds checks for unusual value ranges, unexpected text formats, and fields that should be unique. Included check families:
-
Date Range Checks: Ensure dates fall within a specified range.
-
Numeric Range Checks: Validate that numeric values are within acceptable ranges.
-
String Pattern Checks: Ensure strings match specific patterns (e.g., email formats).
-
Approximate Uniqueness: Validate uniqueness of values if they are approximately unique.
Use Case: Ideal for datasets where patterns and ranges are important for ensuring data quality.
The following table shows the additional AI Managed checks generated at this level. At Medium, four additional checks are created.
| AI Managed Checks | Reference |
|---|---|
| Between Times | See more. |
| Between | See more. |
| Matches Pattern | See more. |
| Unique | See more. |
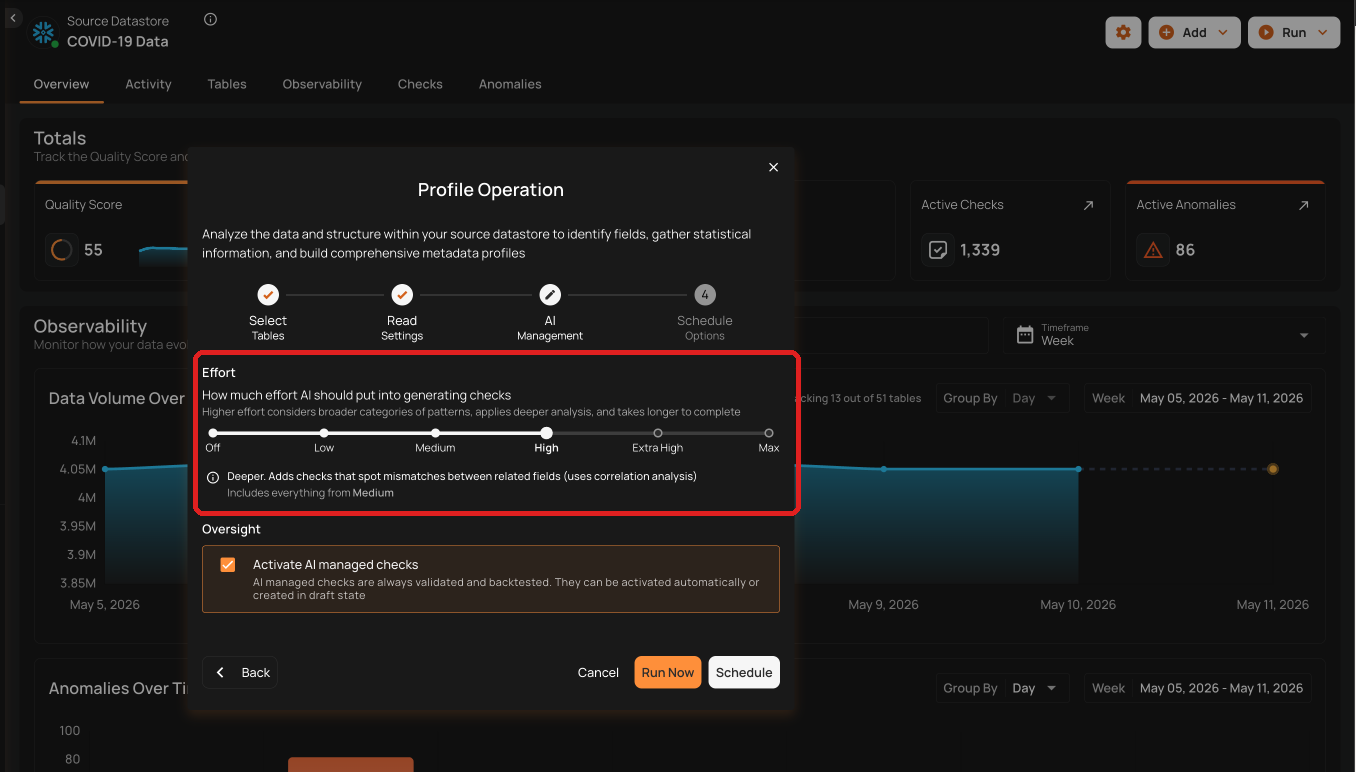
High: Time Series and Comparative Relationship Checks
Deeper. Adds checks that spot mismatches between related fields, including time-series patterns and comparative relationships between datasets. Included check families:
-
Date Granularity Checks: Ensure the granularity of date values is consistent (e.g., day, month, year).
-
Consistent Relationships: Validate that relationships between overlapping datasets are consistent.
Use Case: Suitable for scenarios where data quality depends on time-series data or when comparing data across different datasets.
The following table shows the additional AI Managed checks generated at this level. At High, eight additional checks are created.
| AI Managed Checks | Reference |
|---|---|
| Time Distribution Size | See more. |
| After Date Time | See more. |
| Before Date Time | See more. |
| Greater Than | See more. |
| Greater Than Field | See more. |
| Less Than | See more. |
| Less Than Field | See more. |
| Equal To Field | See more. |
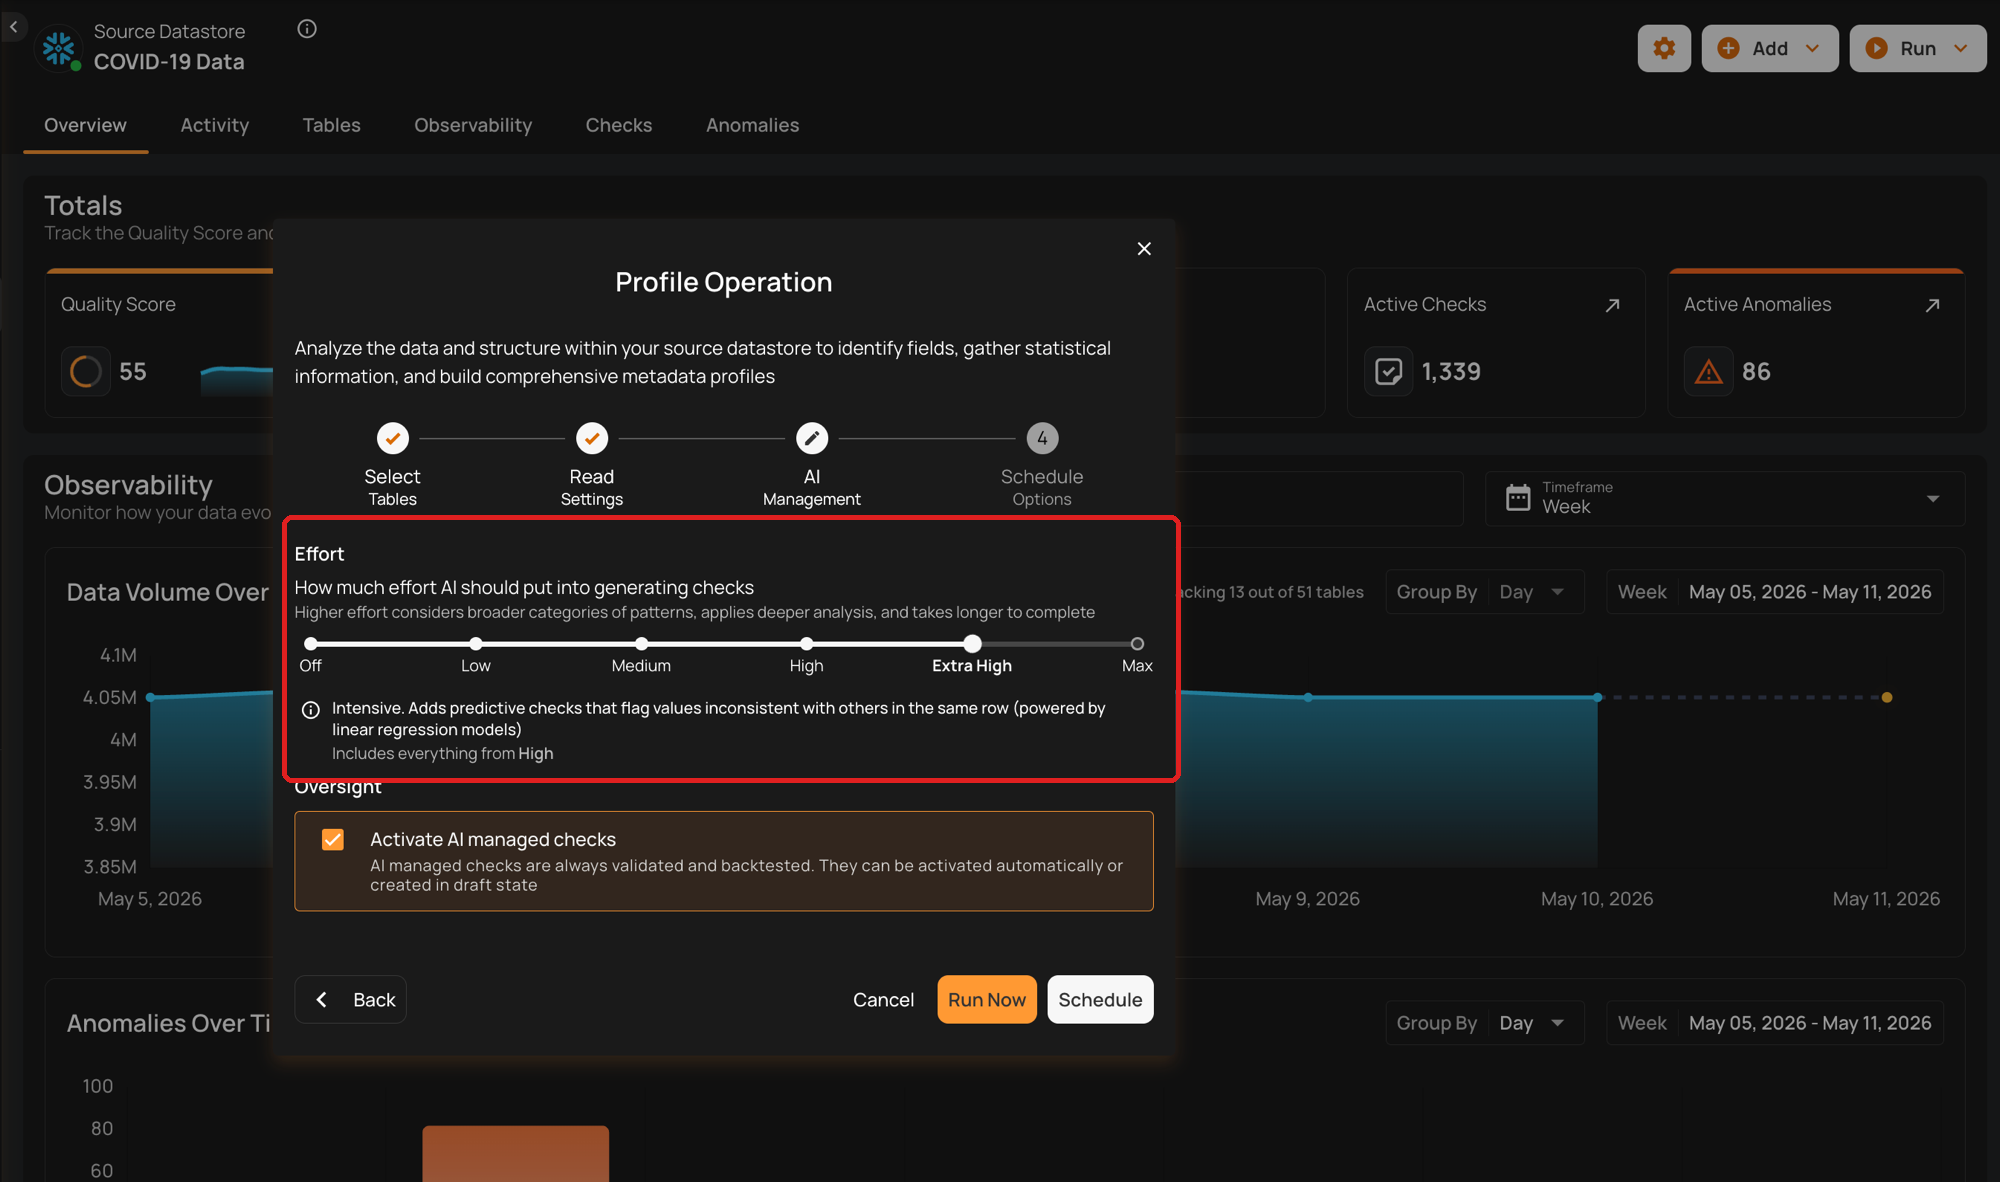
Extra High: Linear Regression and Cross-Datastore Relationship Checks
Intensive. Adds predictive checks that flag values inconsistent with others in the same row (powered by linear regression models) and validate relationships across different data stores. Included check families:
-
Linear Regression Checks: Validate data using regression models to identify trends and outliers.
-
Cross-Datastore Relationships: Ensure that data relationships are maintained across different data sources.
Use Case: Best for complex datasets where advanced analytical checks are necessary.
The following table shows the additional AI Managed checks generated at this level. At Extra High, three additional checks are created.
| AI Managed Checks | Reference |
|---|---|
| Data Diff | See more. |
| Exists In | See more. |
| Predicted By | See more. |
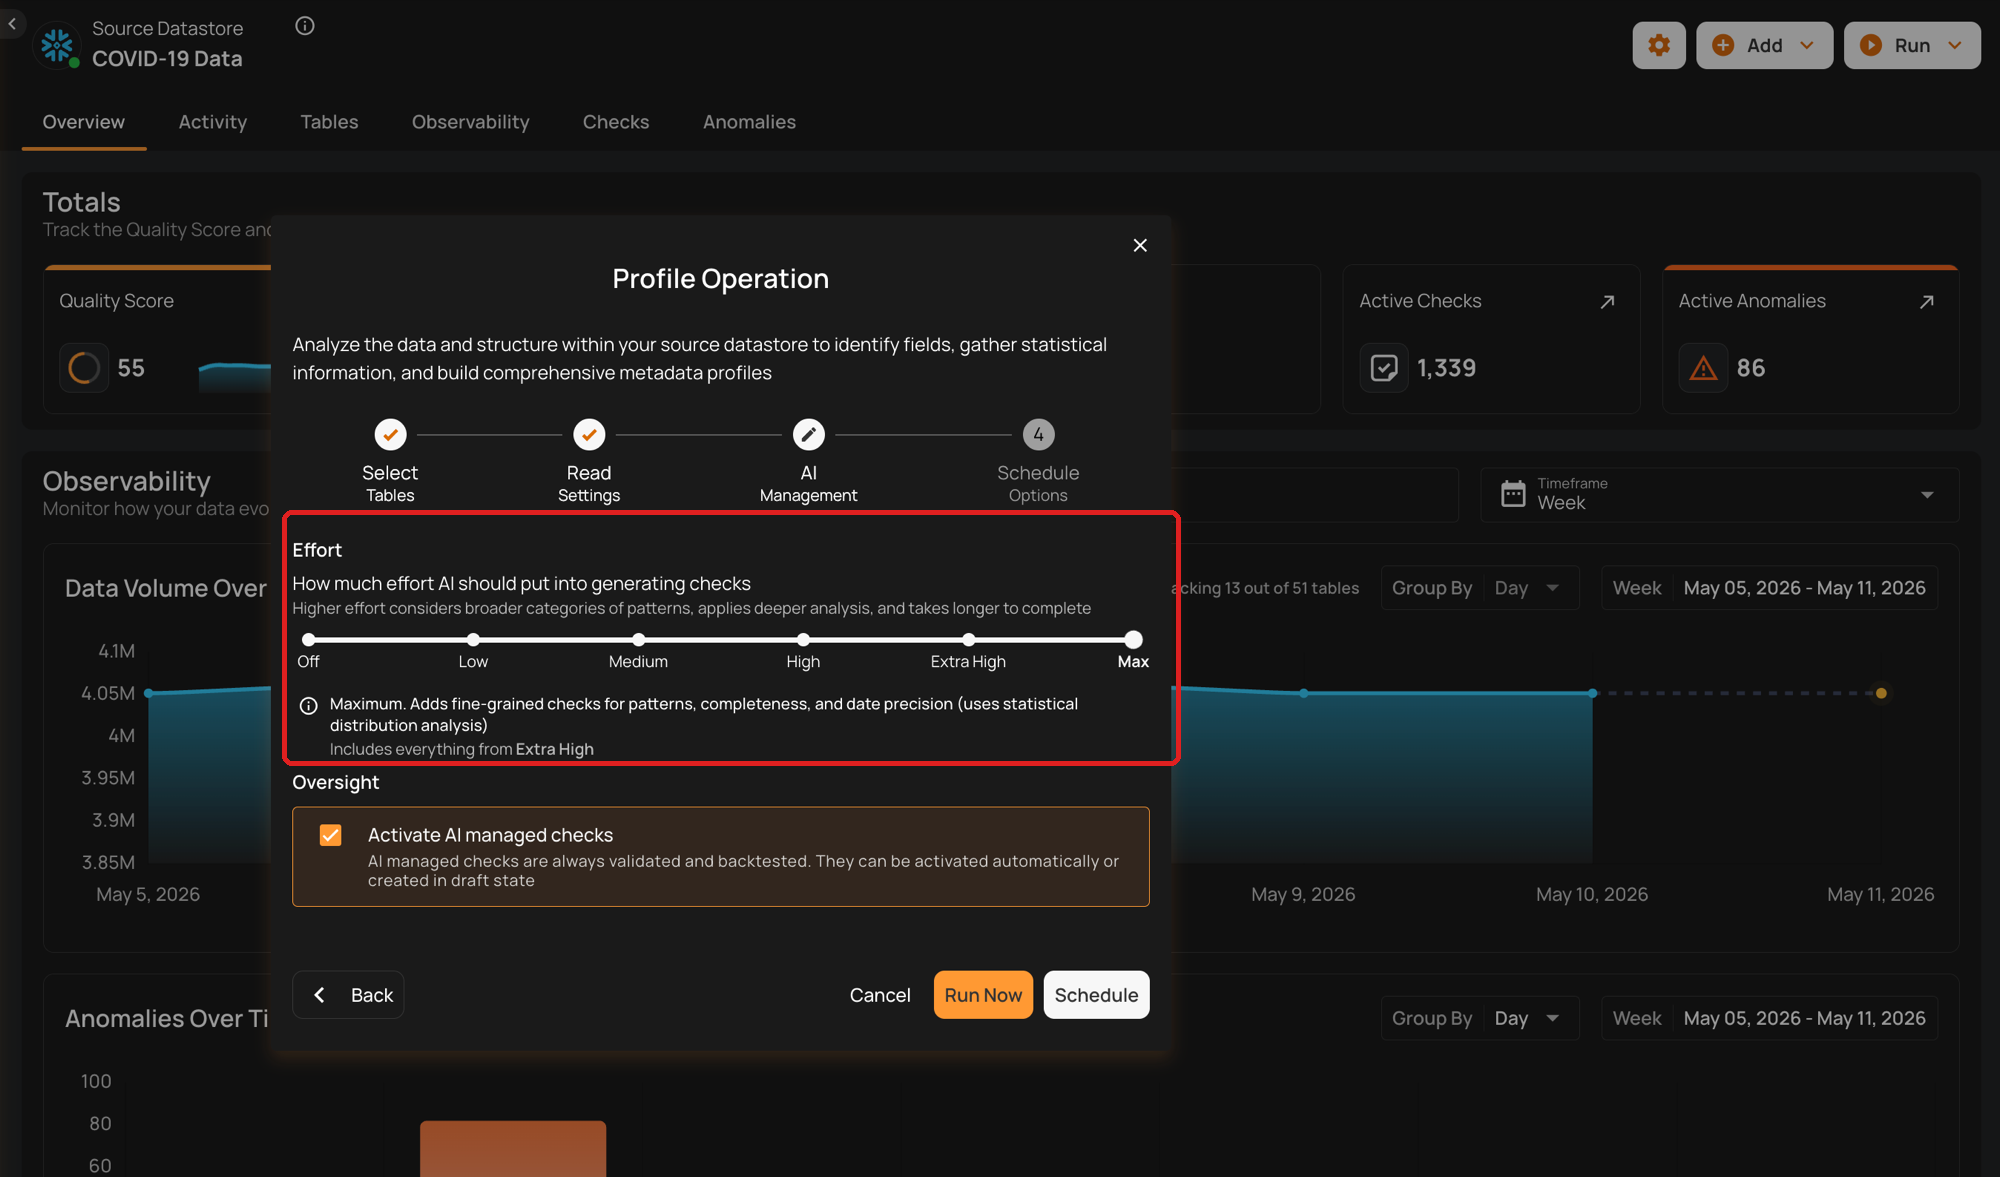
Max: Shape Checks
Maximum. Adds fine-grained checks for patterns, completeness, and date precision (uses statistical distribution analysis), validating the shape of distribution patterns that appear in your data. Included check families:
- Shape Checks: Checks that define an expectation for some percentage of your data less than 100%. The property “coverage” holds the percentage of your data for which the expressed check should be true.
Use Case: Ideal for scenarios where each incremental set of scanned data should exhibit the same distributions of values as the training set. For example, a transactions table is configured for a weekly incremental scan after each week’s data is loaded. A shape check could define that 80% of all transactions are expected to be performed using “cash” or “credit”.
The following table shows the additional AI Managed checks generated at this level. At Max, three additional checks are created.
| AI Managed Checks | Reference |
|---|---|
| Expected Values (Shape) | See more. |
| Matches Pattern (Shape) | See more. |
| Not Null (Shape) | See more. |
Warning
On each profile run (when AI Effort ≠ Off), Qualytics AI regenerates a fresh set of AI Managed checks based on the current data and effort level. Any AI Managed check from a previous run that isn't regenerated is automatically discarded — for example, when you lower AI Effort, checks from the families that are no longer evaluated will be removed.
Three kinds of AI Managed checks are preserved across profile runs:
- Checks you've edited — your overrides are always honored.
- Volumetric checks — retained regardless of regeneration.
- Checks proven useful by your feedback — once you mark an anomaly produced by a check as Resolved, the check's inference confidence is boosted, which protects it from being discarded on later runs.
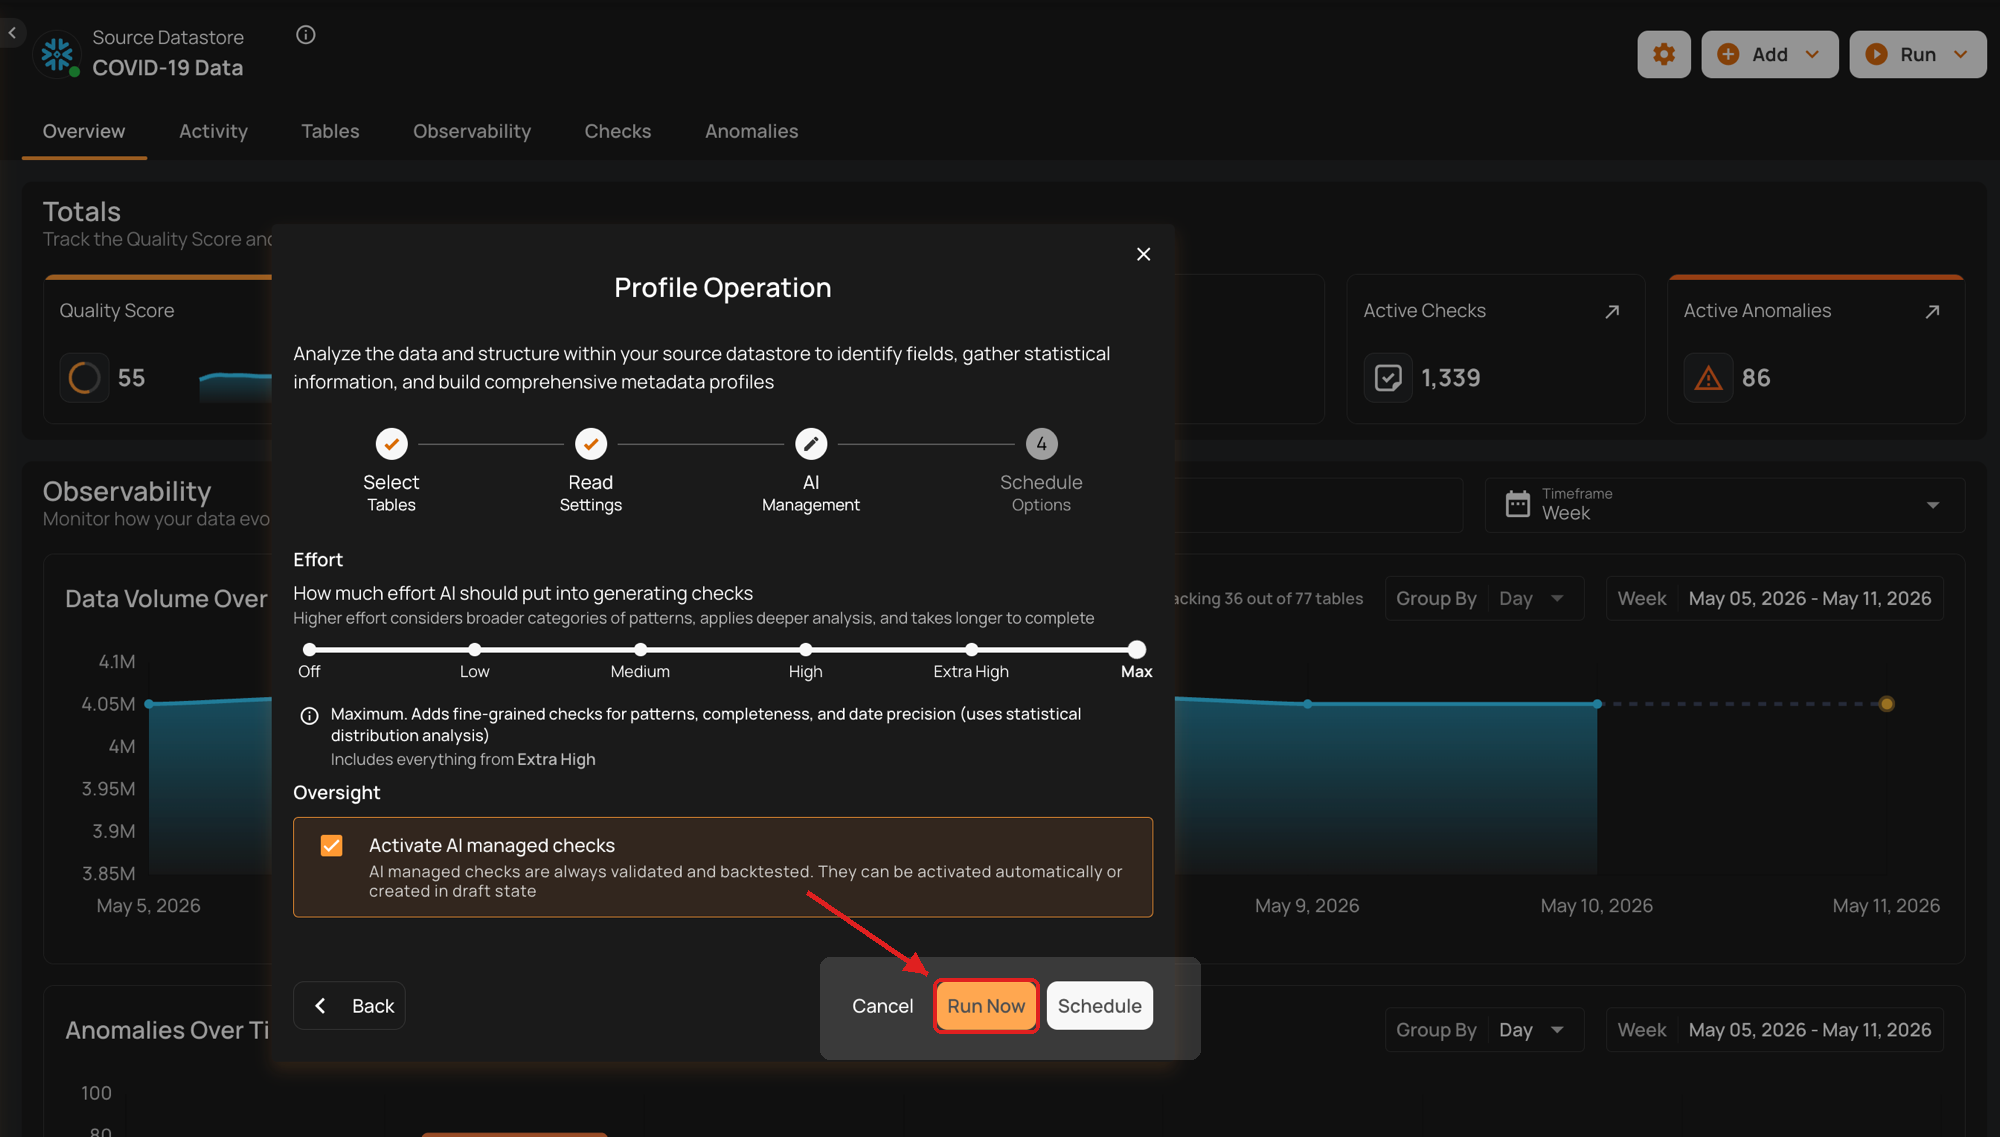
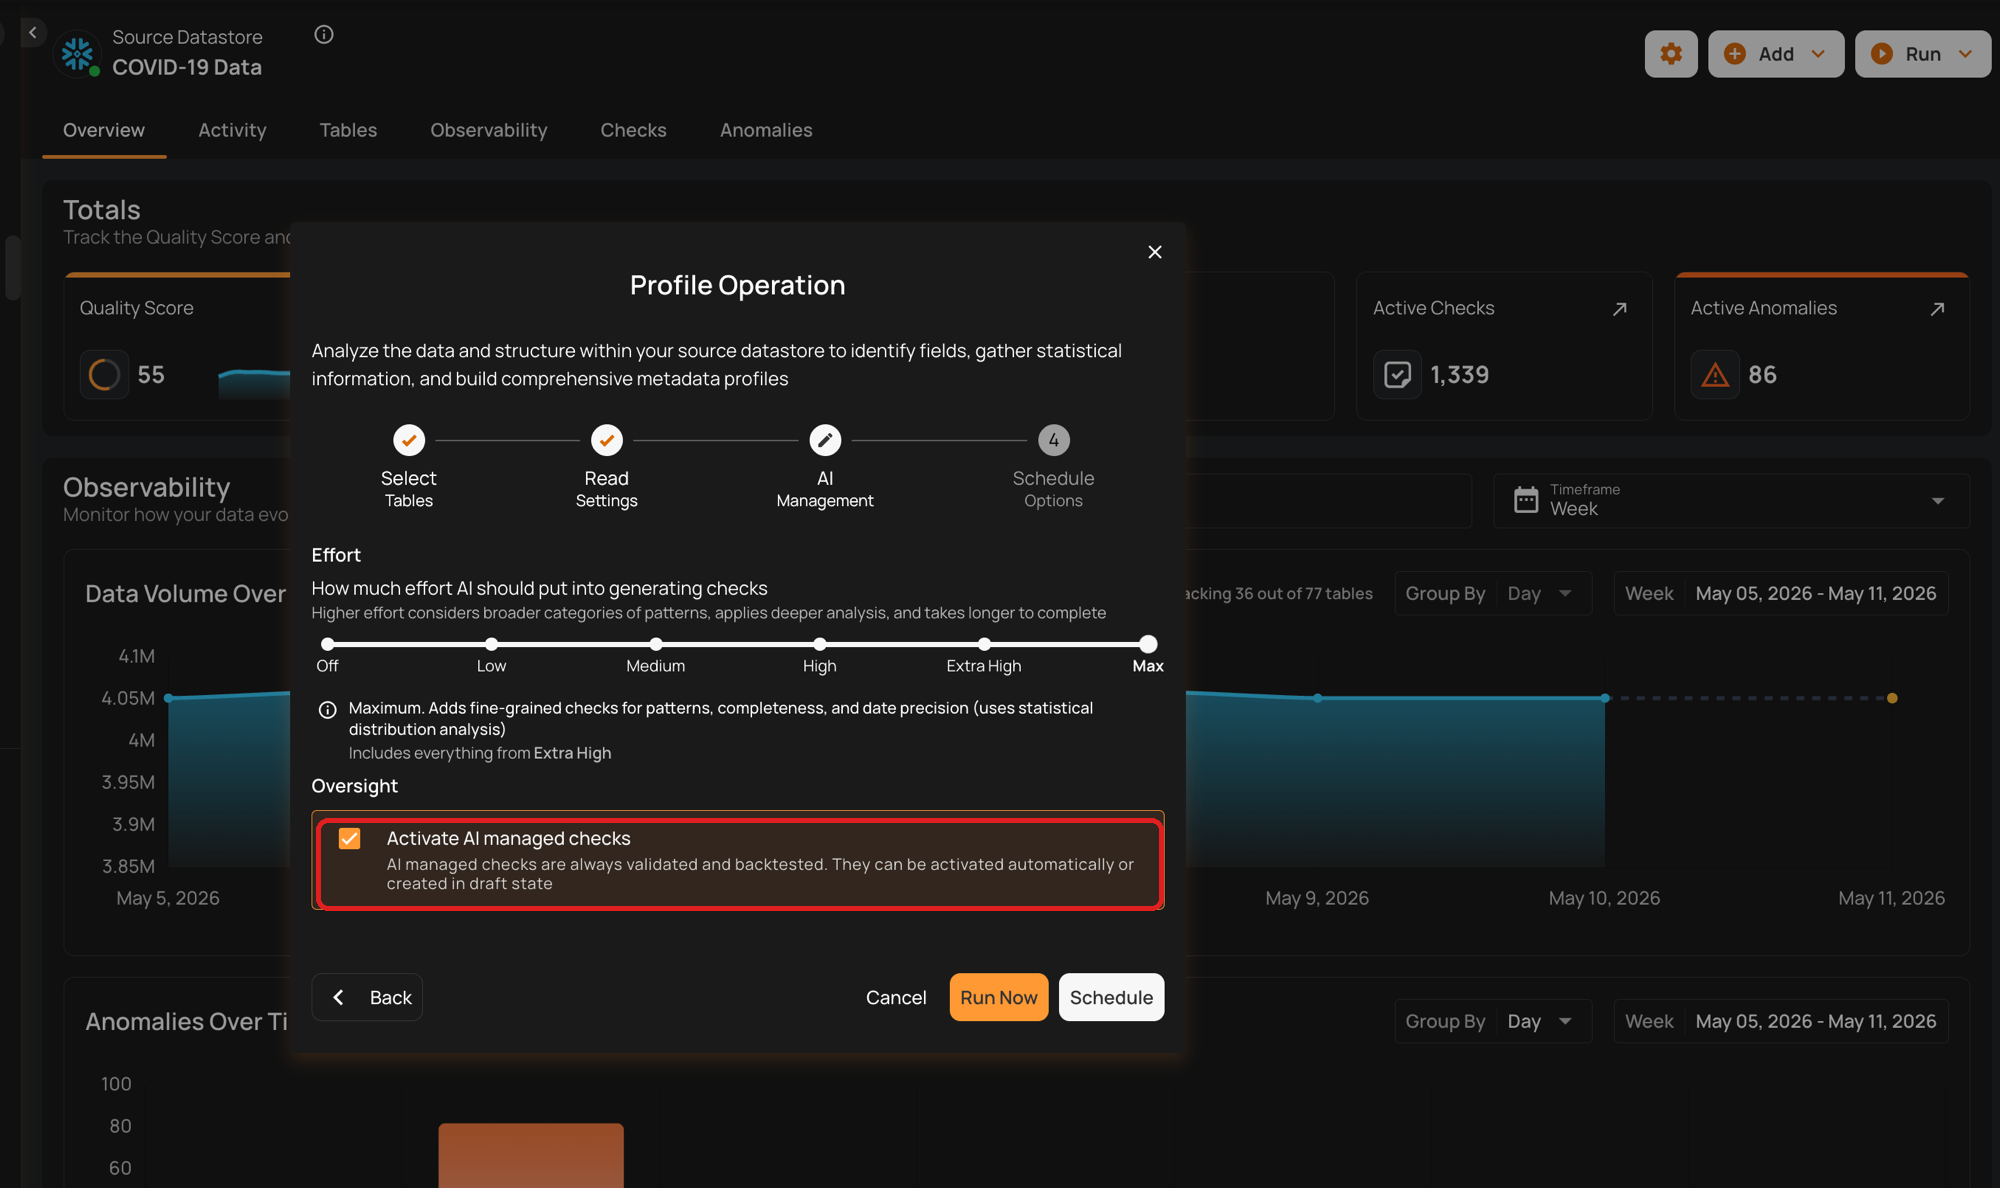
Oversight
Use the Activate AI managed checks toggle to control the initial status of newly generated AI Managed checks:
- Toggle ON — checks are created in Active status.
- Toggle OFF — checks are created in Draft status, so you can review and activate them manually.
Note
AI Managed checks are always validated and backtested. They can be activated automatically or created in draft state.
User Overrides on AI Managed Checks
When you edit an AI Managed check's assertion (for example, adjusting its filter or coverage), the platform records the override and continues to honor it on subsequent profile operations — AI will not overwrite your adjustments. Once you take ownership, future profile runs treat the check as authored and skip re-generating it.
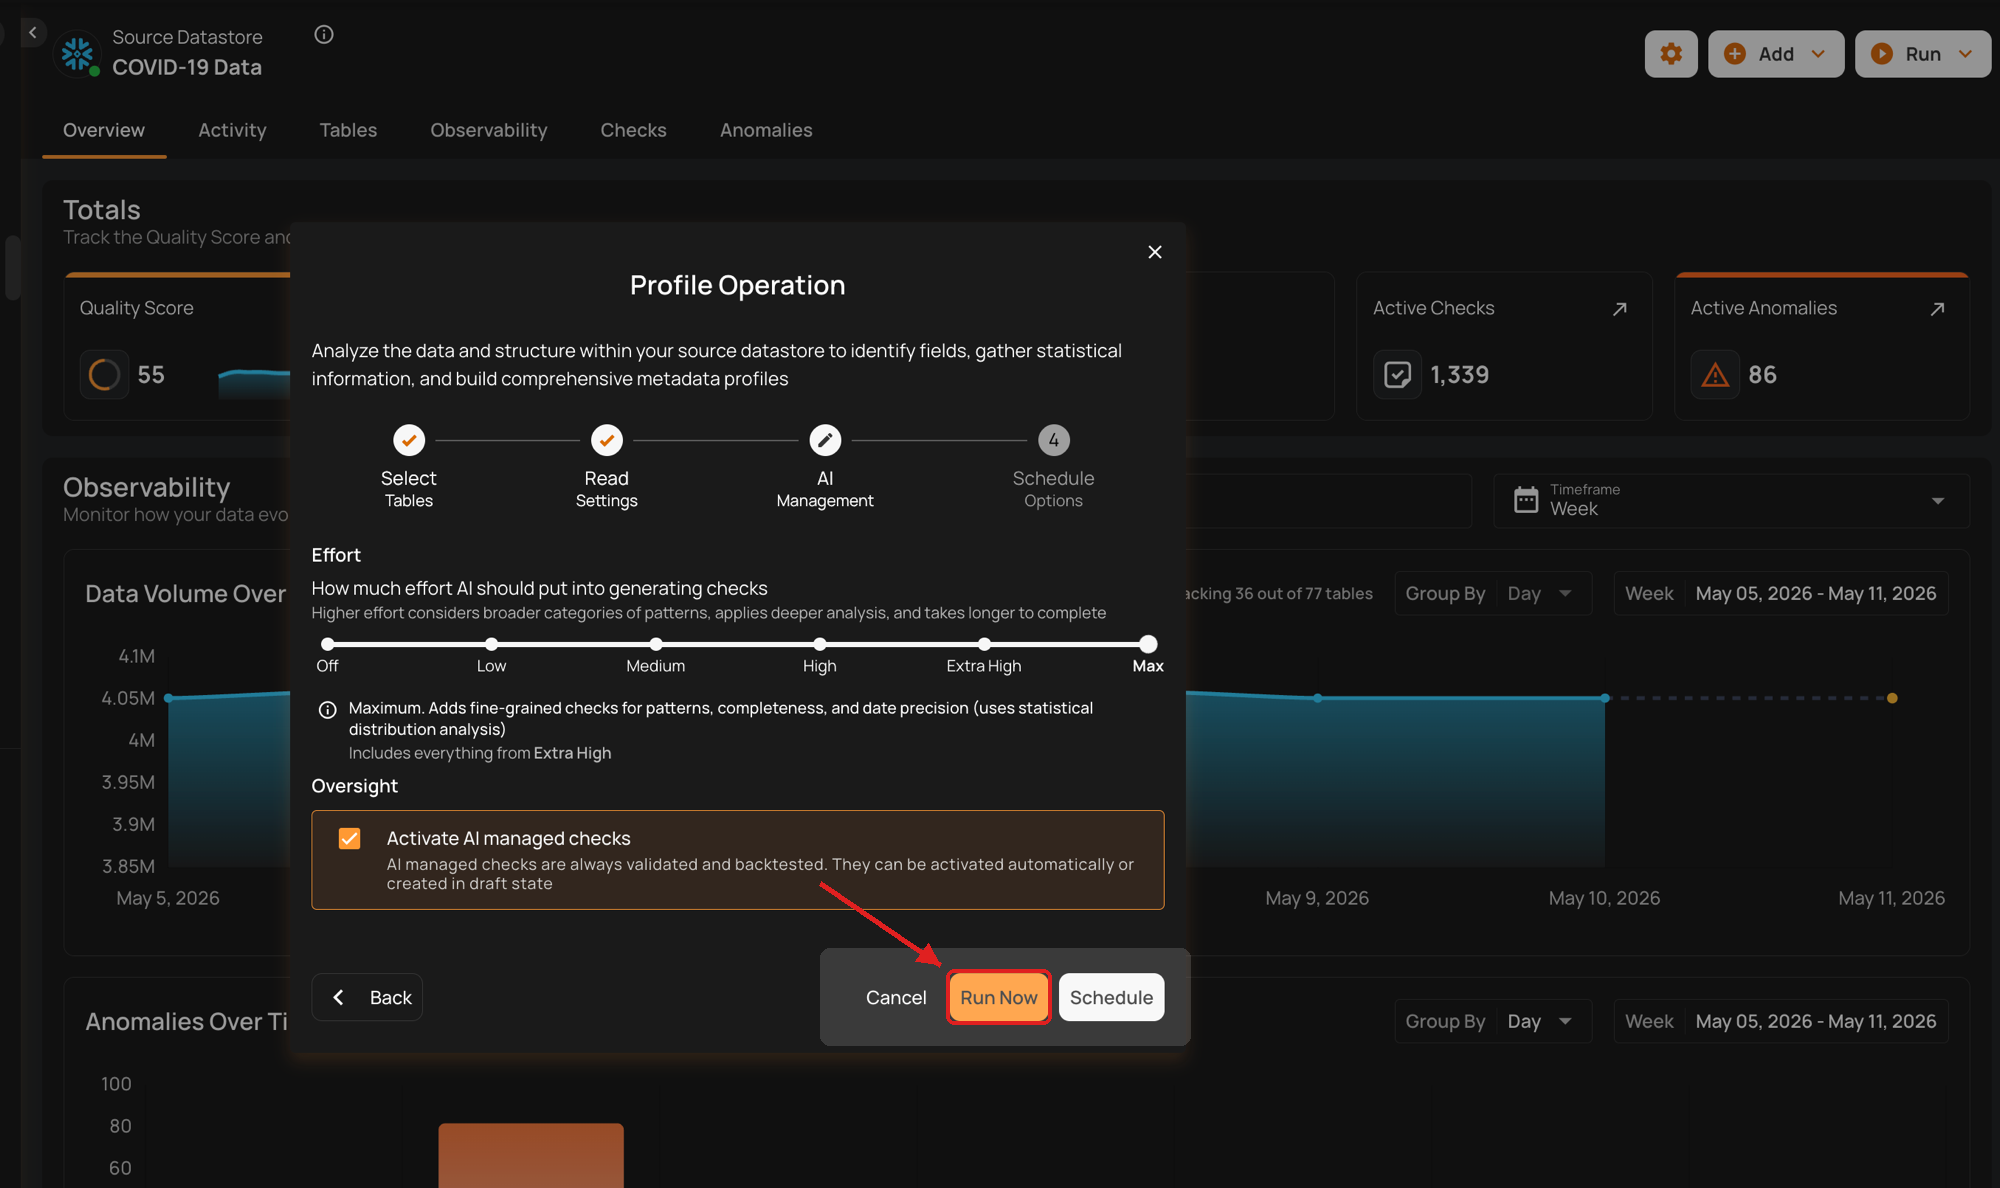
Run Instantly
Click on the Run Now button, and perform the profile operation immediately.
Schedule
Timezone-aware scheduling
Schedules can run in any IANA timezone (for example, America/New_York, Europe/Paris, Asia/Tokyo), and Daylight Saving Time transitions are handled automatically. UTC is the default for new and existing schedules. The configured timezone is shown on the schedule card as an abbreviation, such as Schedule (UTC) by default or Schedule (EST) after selecting another timezone.
Deactivating a schedule keeps its cron expression
When you deactivate a schedule, its cron expression is kept. Reactivating it later resumes the same schedule without setting it up again.
If a schedule was deactivated before May 7, 2026 and doesn't run after you reactivate it, re-enter its cron expression once to restore it. Schedules deactivated on or after that date keep working normally.
Step 1: Click on the Schedule button to configure the available schedule options in the profile operation.

Step 2: Choose the Timezone for this schedule. UTC is selected by default. To run in a different timezone, type to search by city, region, or abbreviation and pick an IANA timezone from the list. The selected timezone applies to every tab below, and the banner above the tabs shows the current time in that timezone.
Step 3: Set the scheduling preferences for the profile operation.
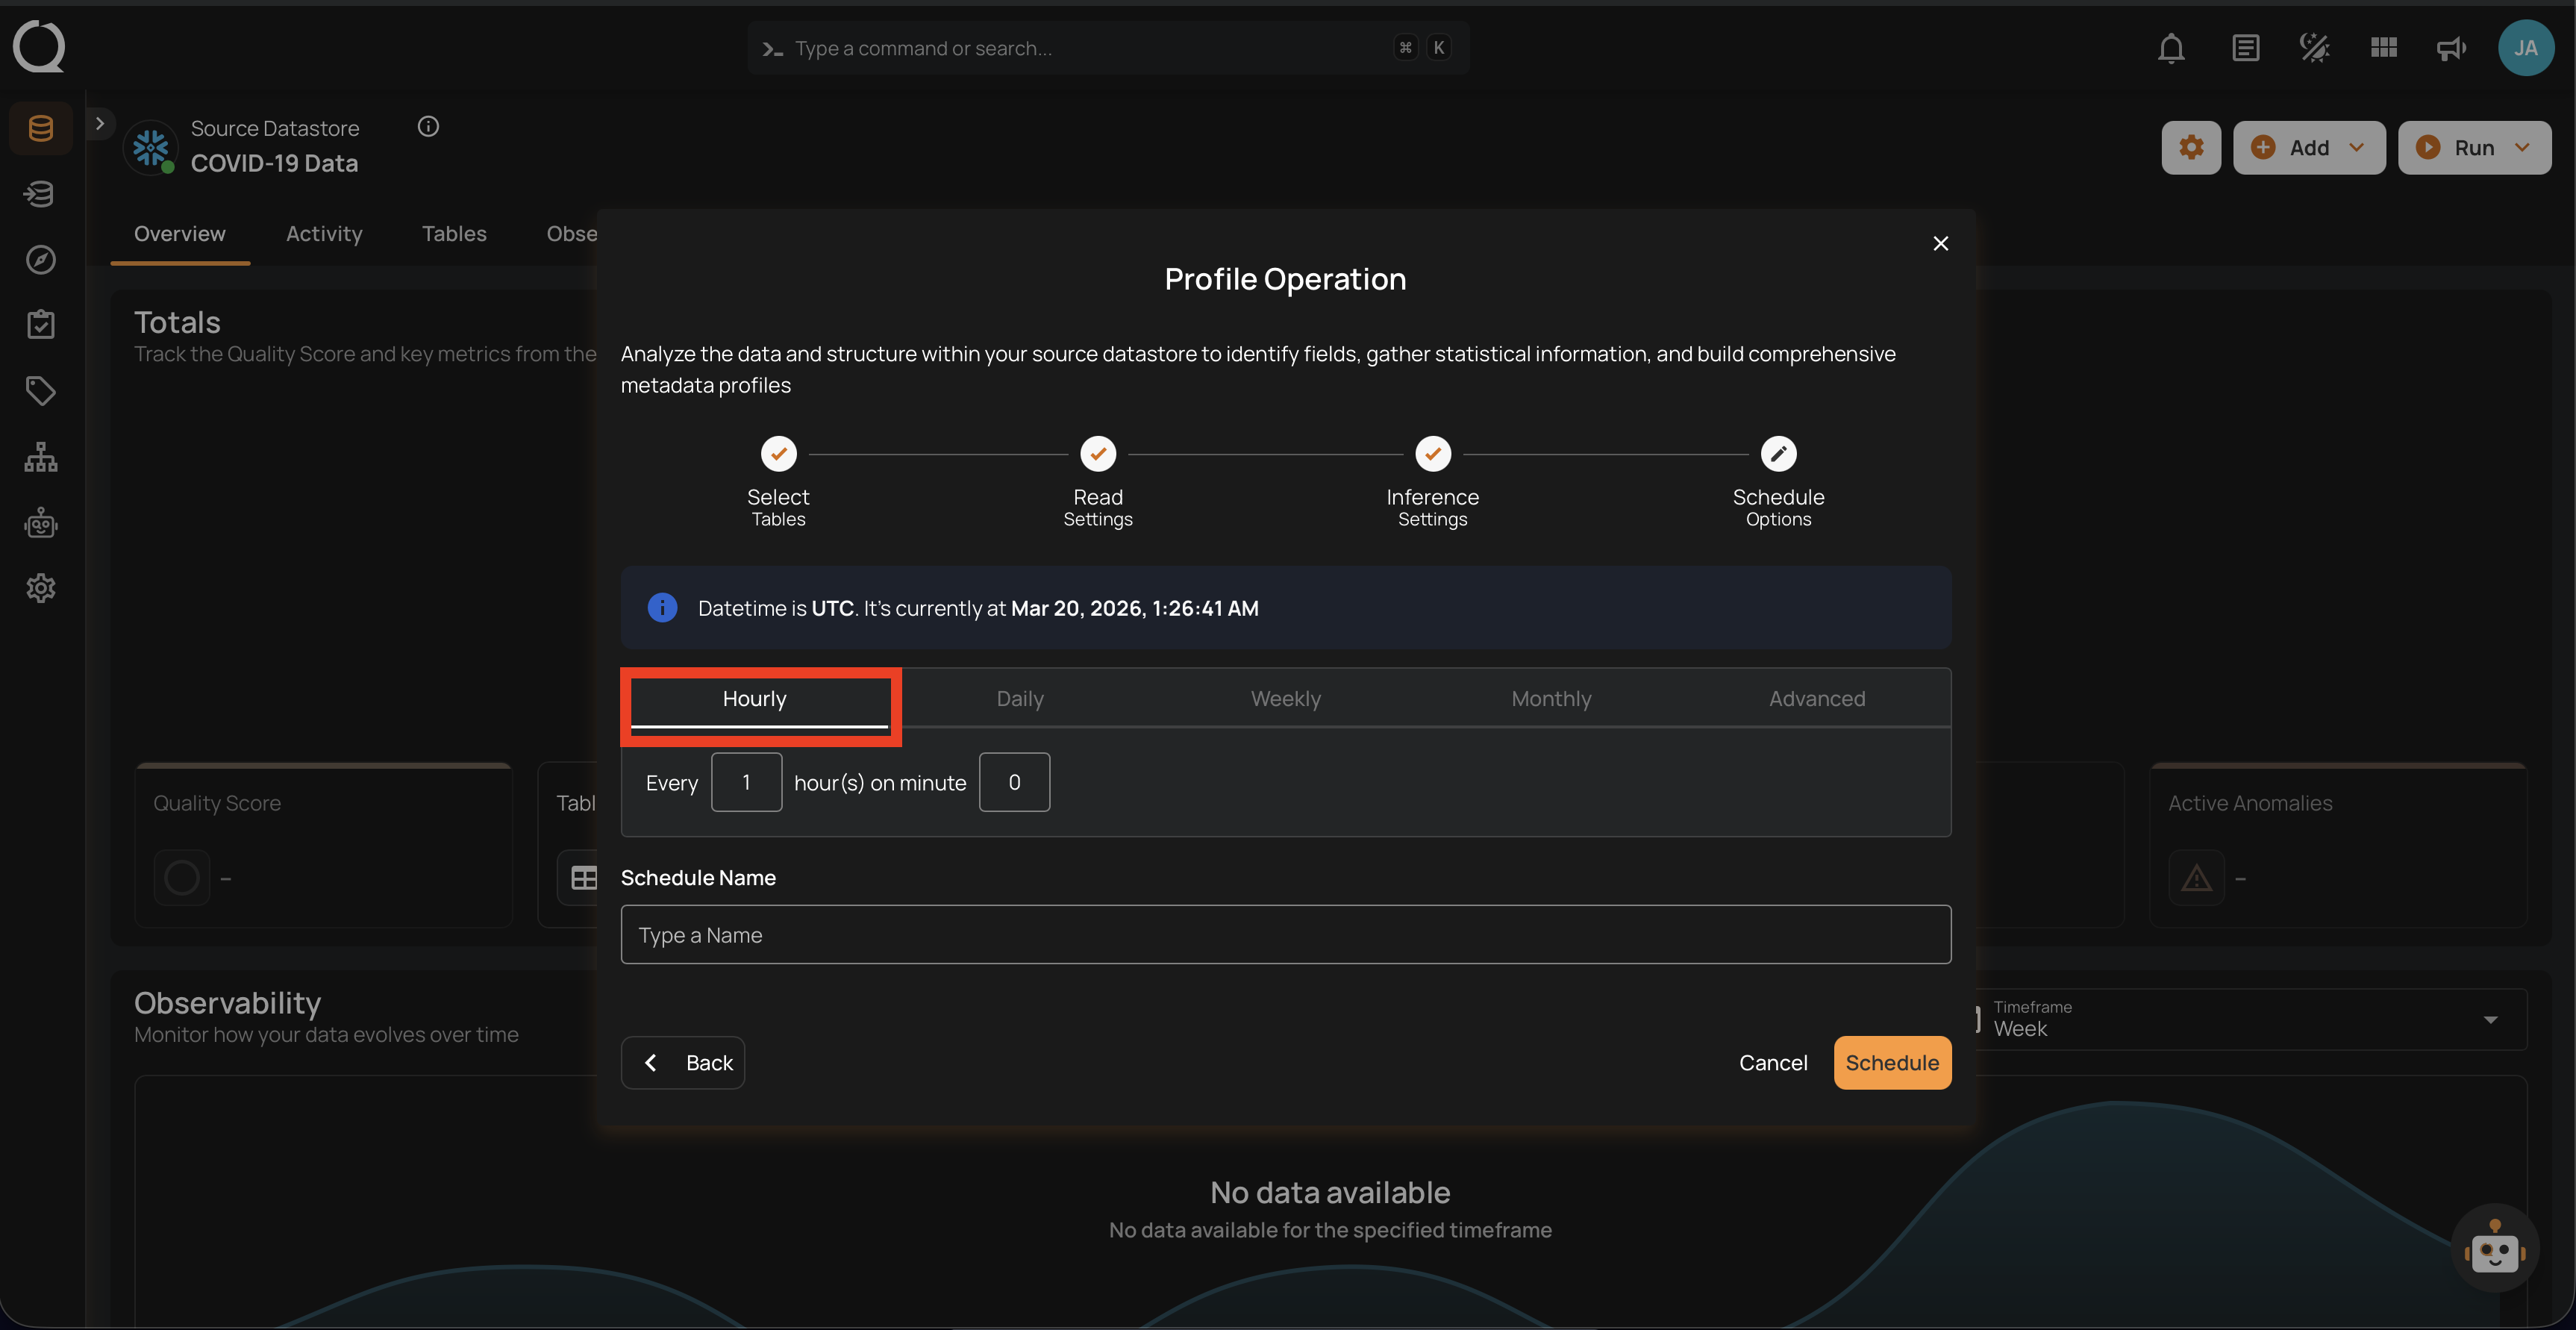
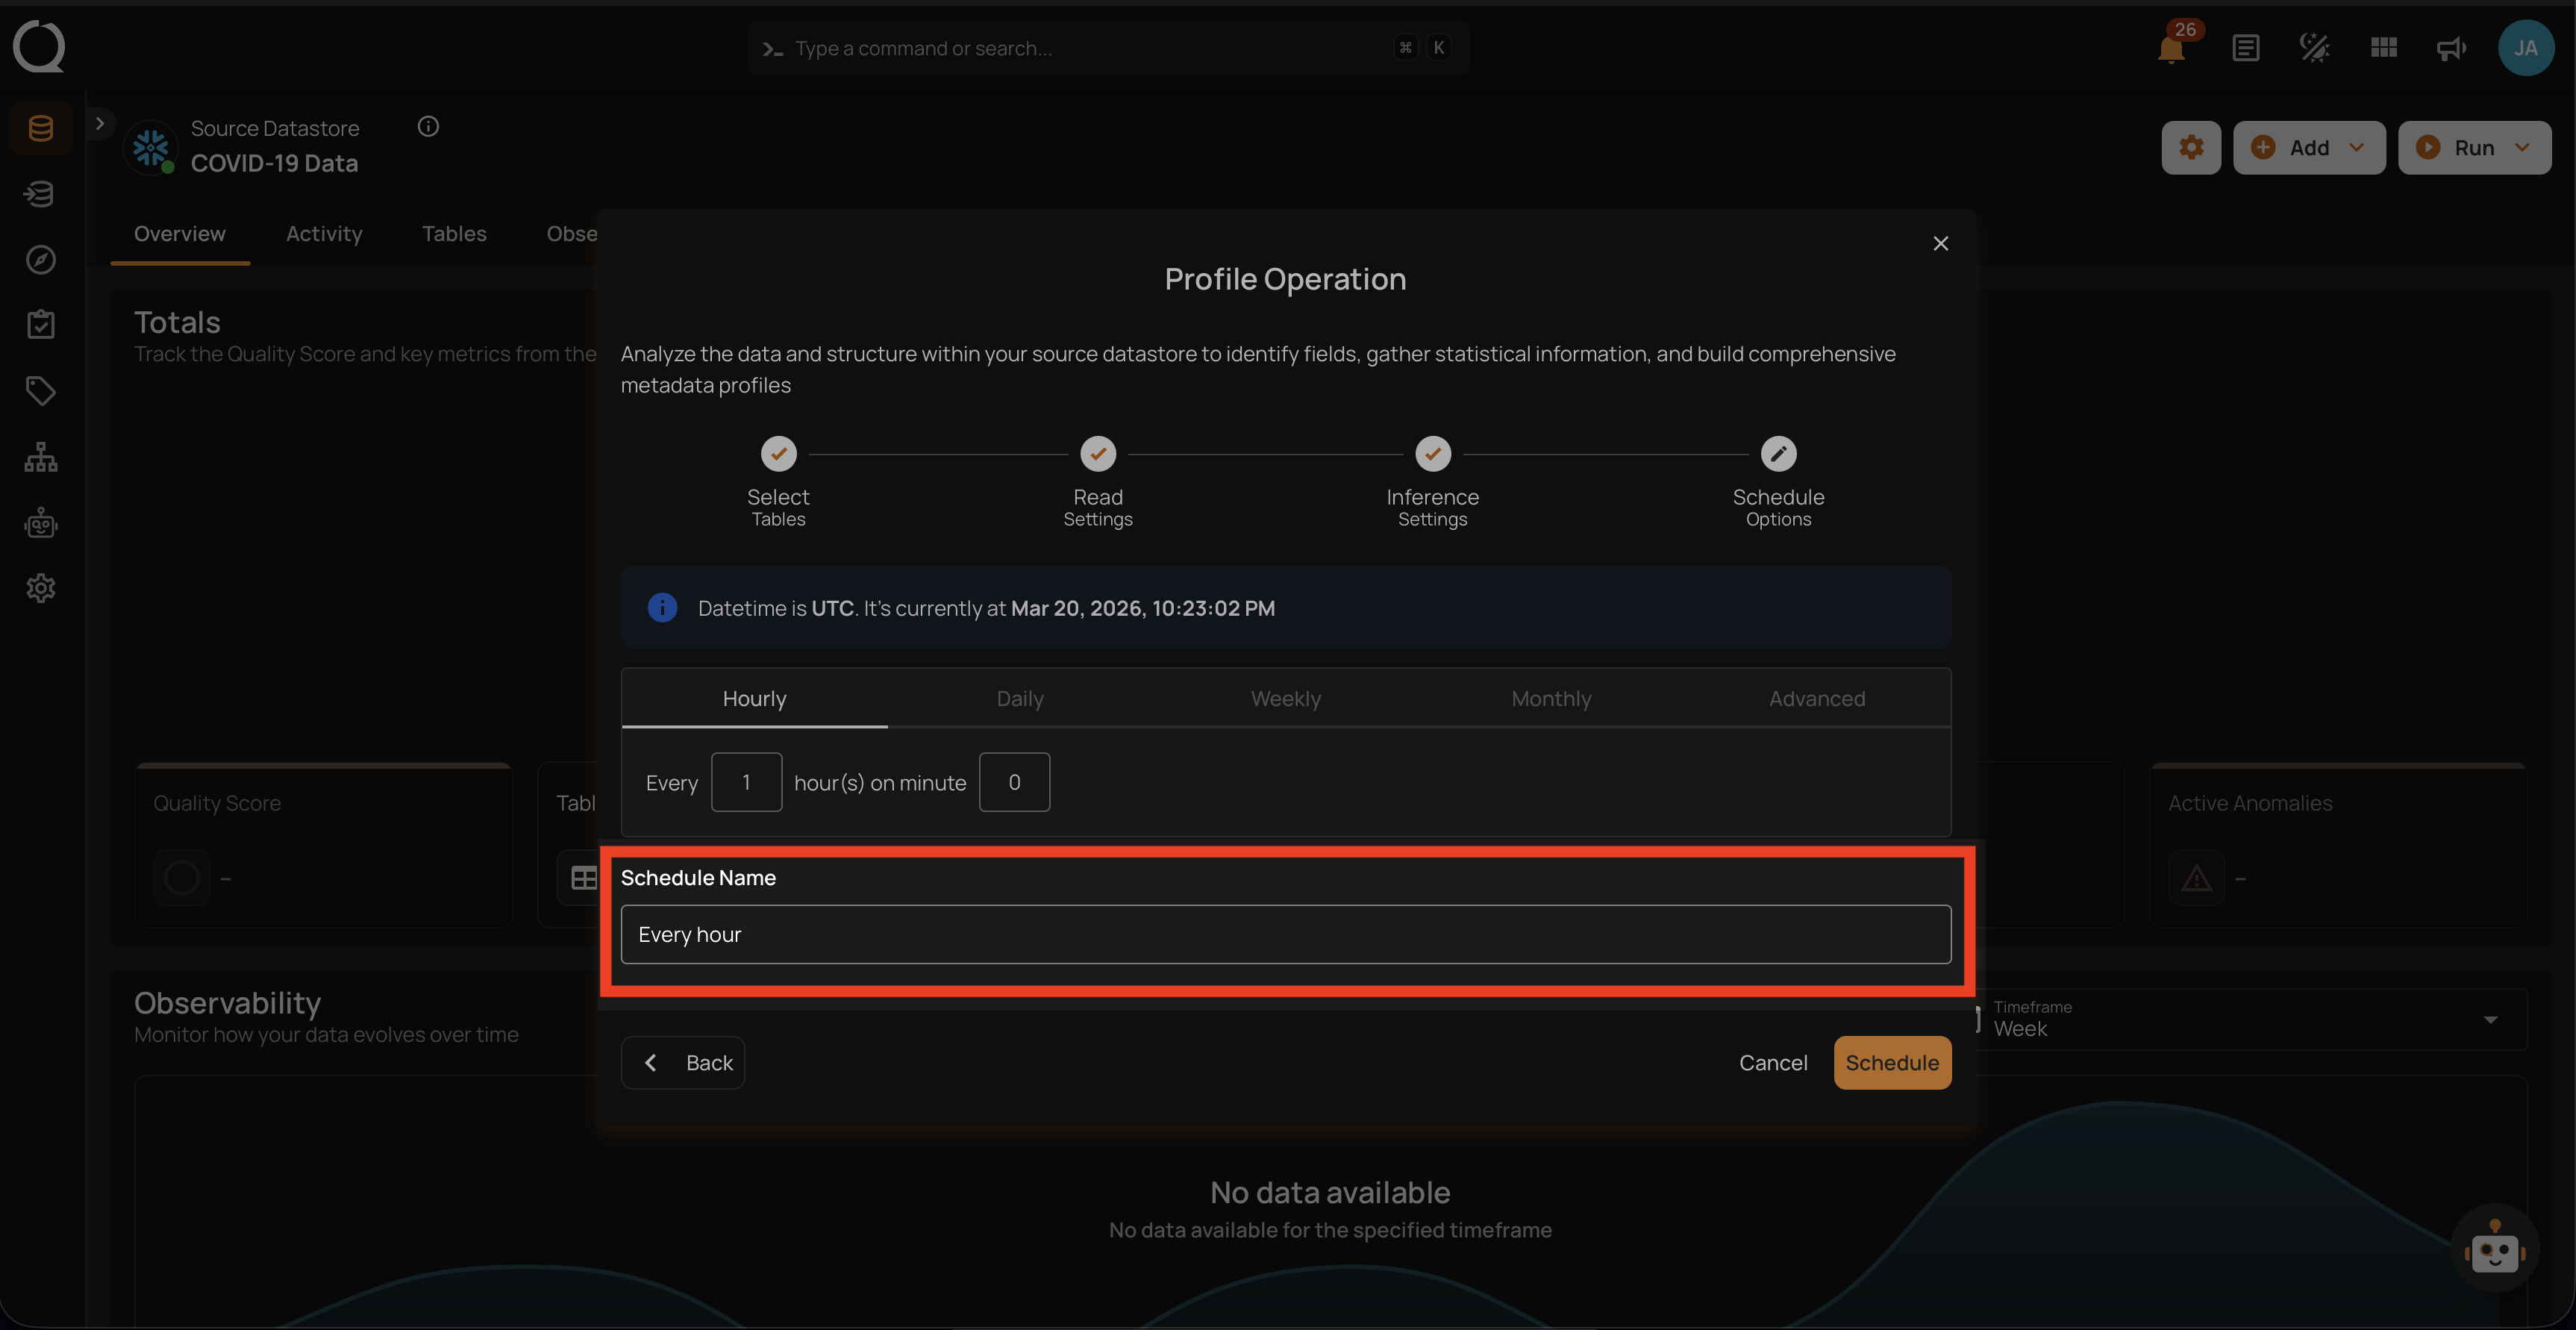
1. Hourly: This option allows you to schedule the profile operation to run every hour at a specified minute. You can define the frequency in hours and the exact minute within the hour the profiling should start. Example: If set to "Every 1 hour(s) on minute 0," the profile operation will run every hour at the top of the hour (e.g., 1:00, 2:00, 3:00).
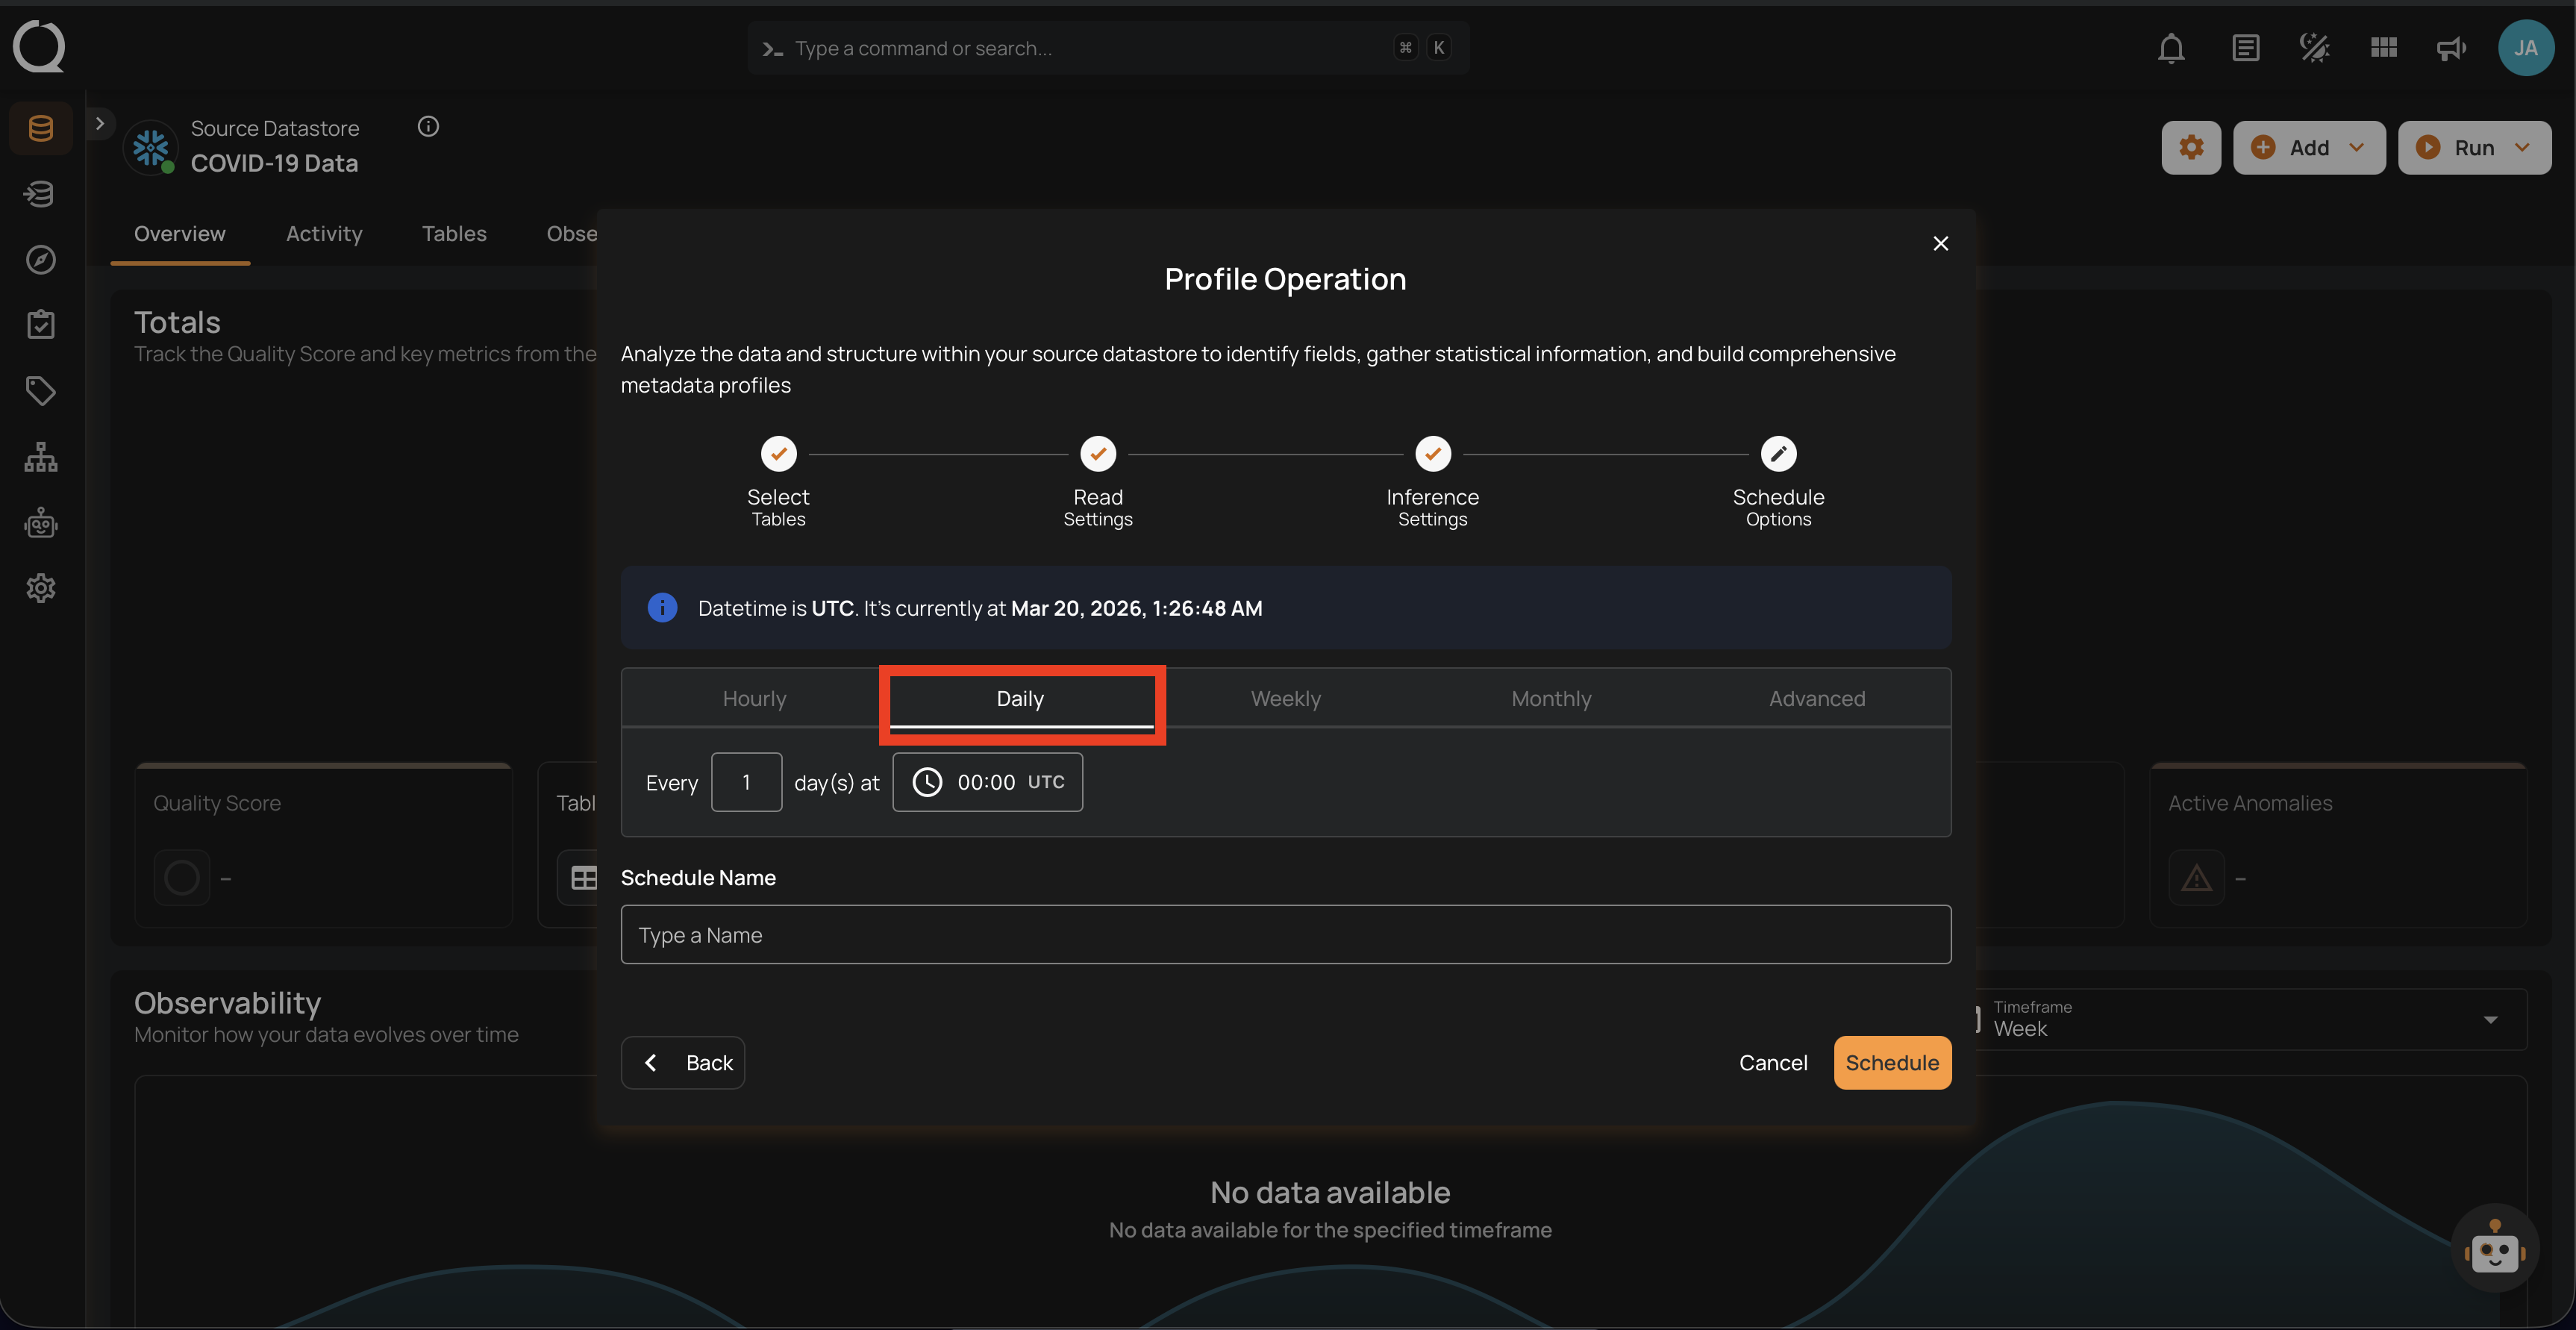
2. Daily: This option schedules the profile operation to run once every day at a specific time. You specify the number of days between operations and the exact time of day in the selected timezone. Example: If set to "Every 1 day(s) at 00:00" with the timezone set to UTC, the profile operation will run every day at midnight UTC.
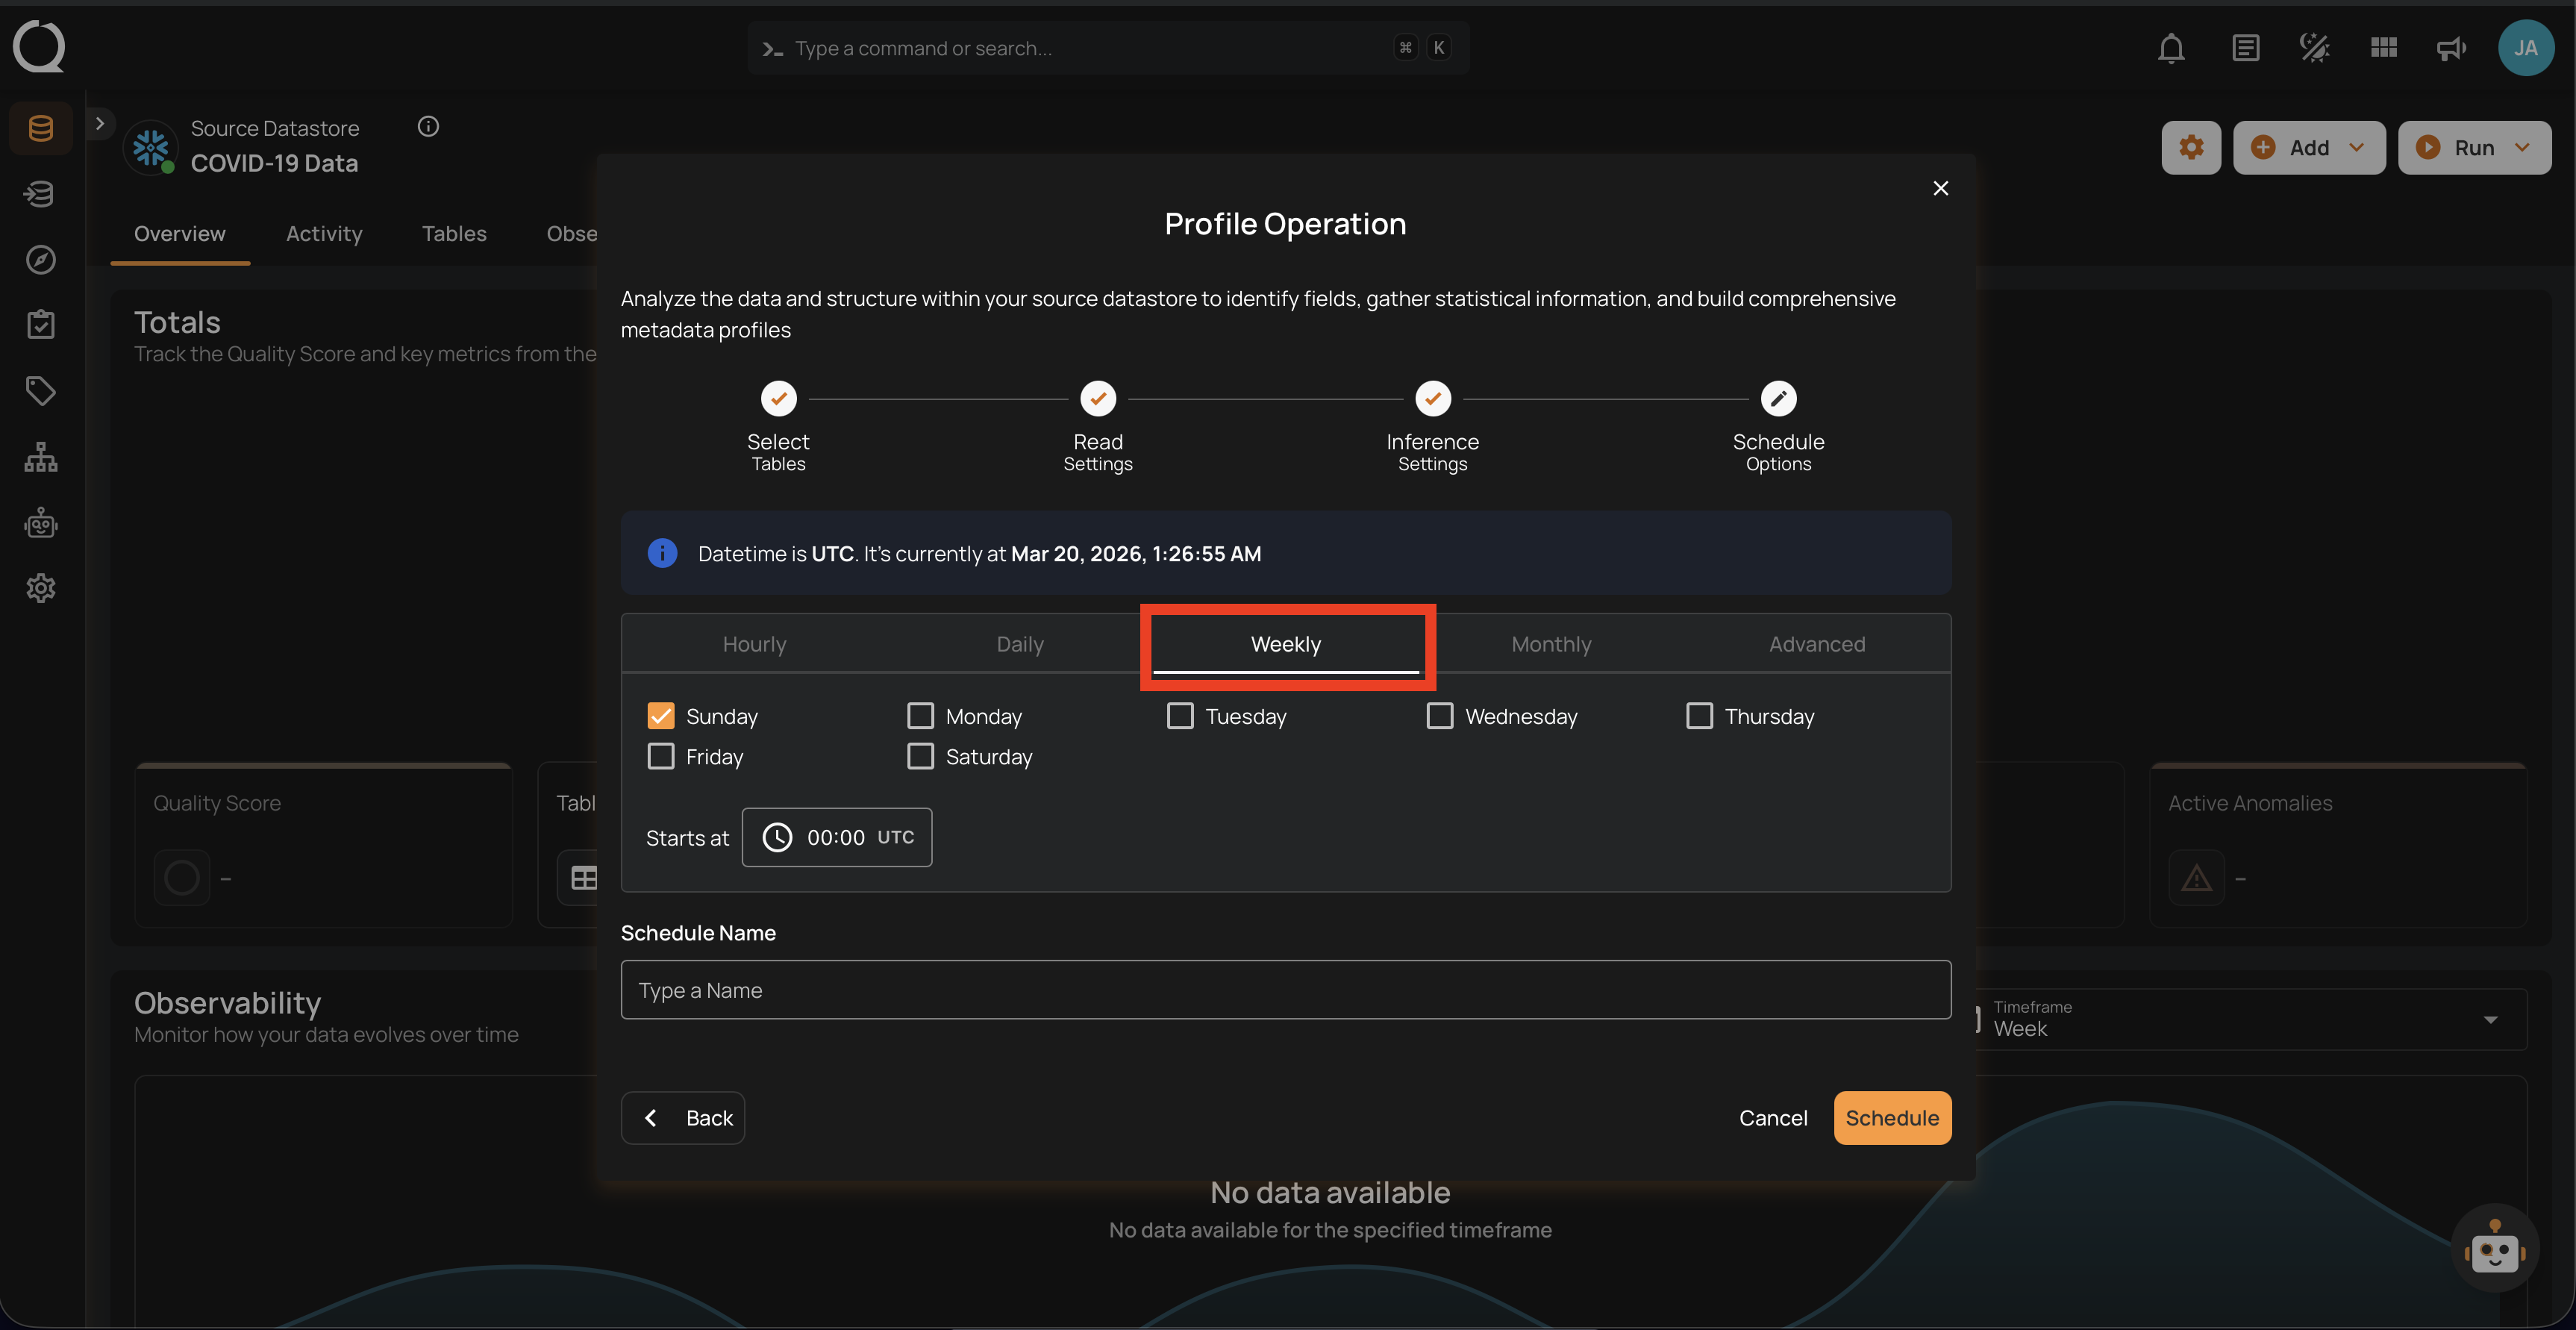
3. Weekly: This option schedules the profile operation to run on specific days of the week at a set time. You select the days of the week and the exact time of day in the selected timezone for the profile operation to run. Example: If configured to run on "Sunday" and "Friday" at 00:00 with the timezone set to UTC, the profile operation will execute at midnight UTC on these days.
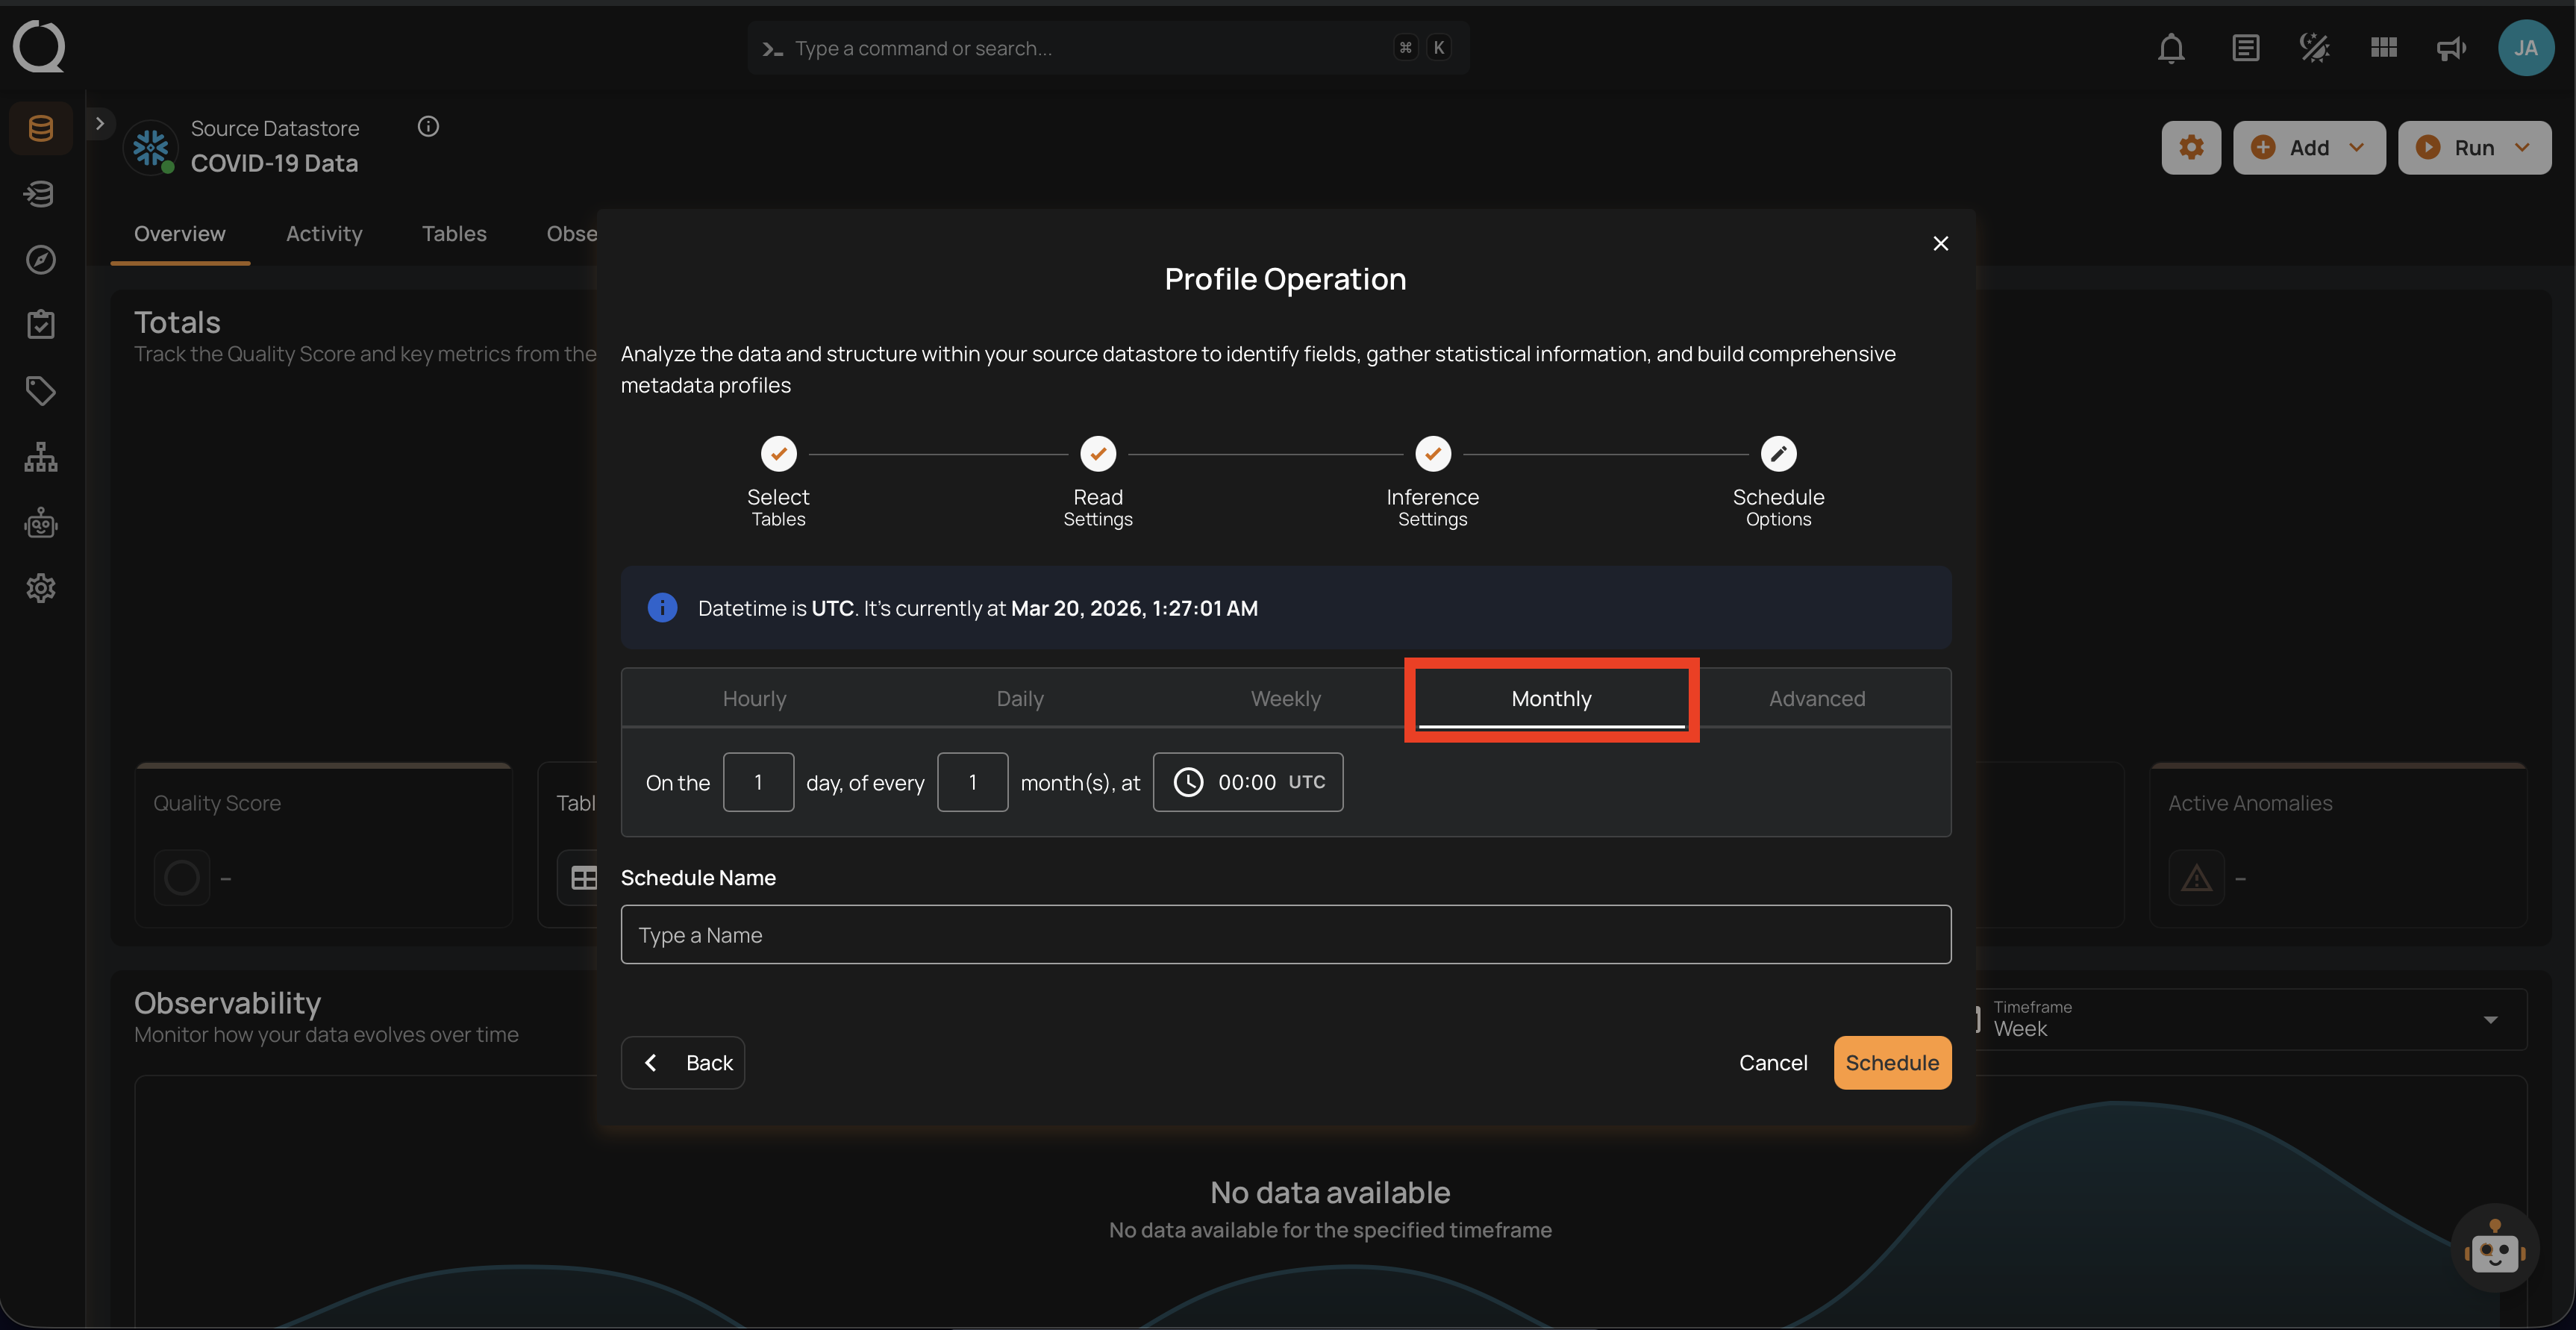
4. Monthly: This option schedules the profile operation to run once a month on a specific day at a set time. You specify the day of the month and the time of day in the selected timezone. If set to "On the 1st day of every 1 month(s), at 00:00" with the timezone set to UTC, the profile operation will run on the first day of each month at midnight UTC.
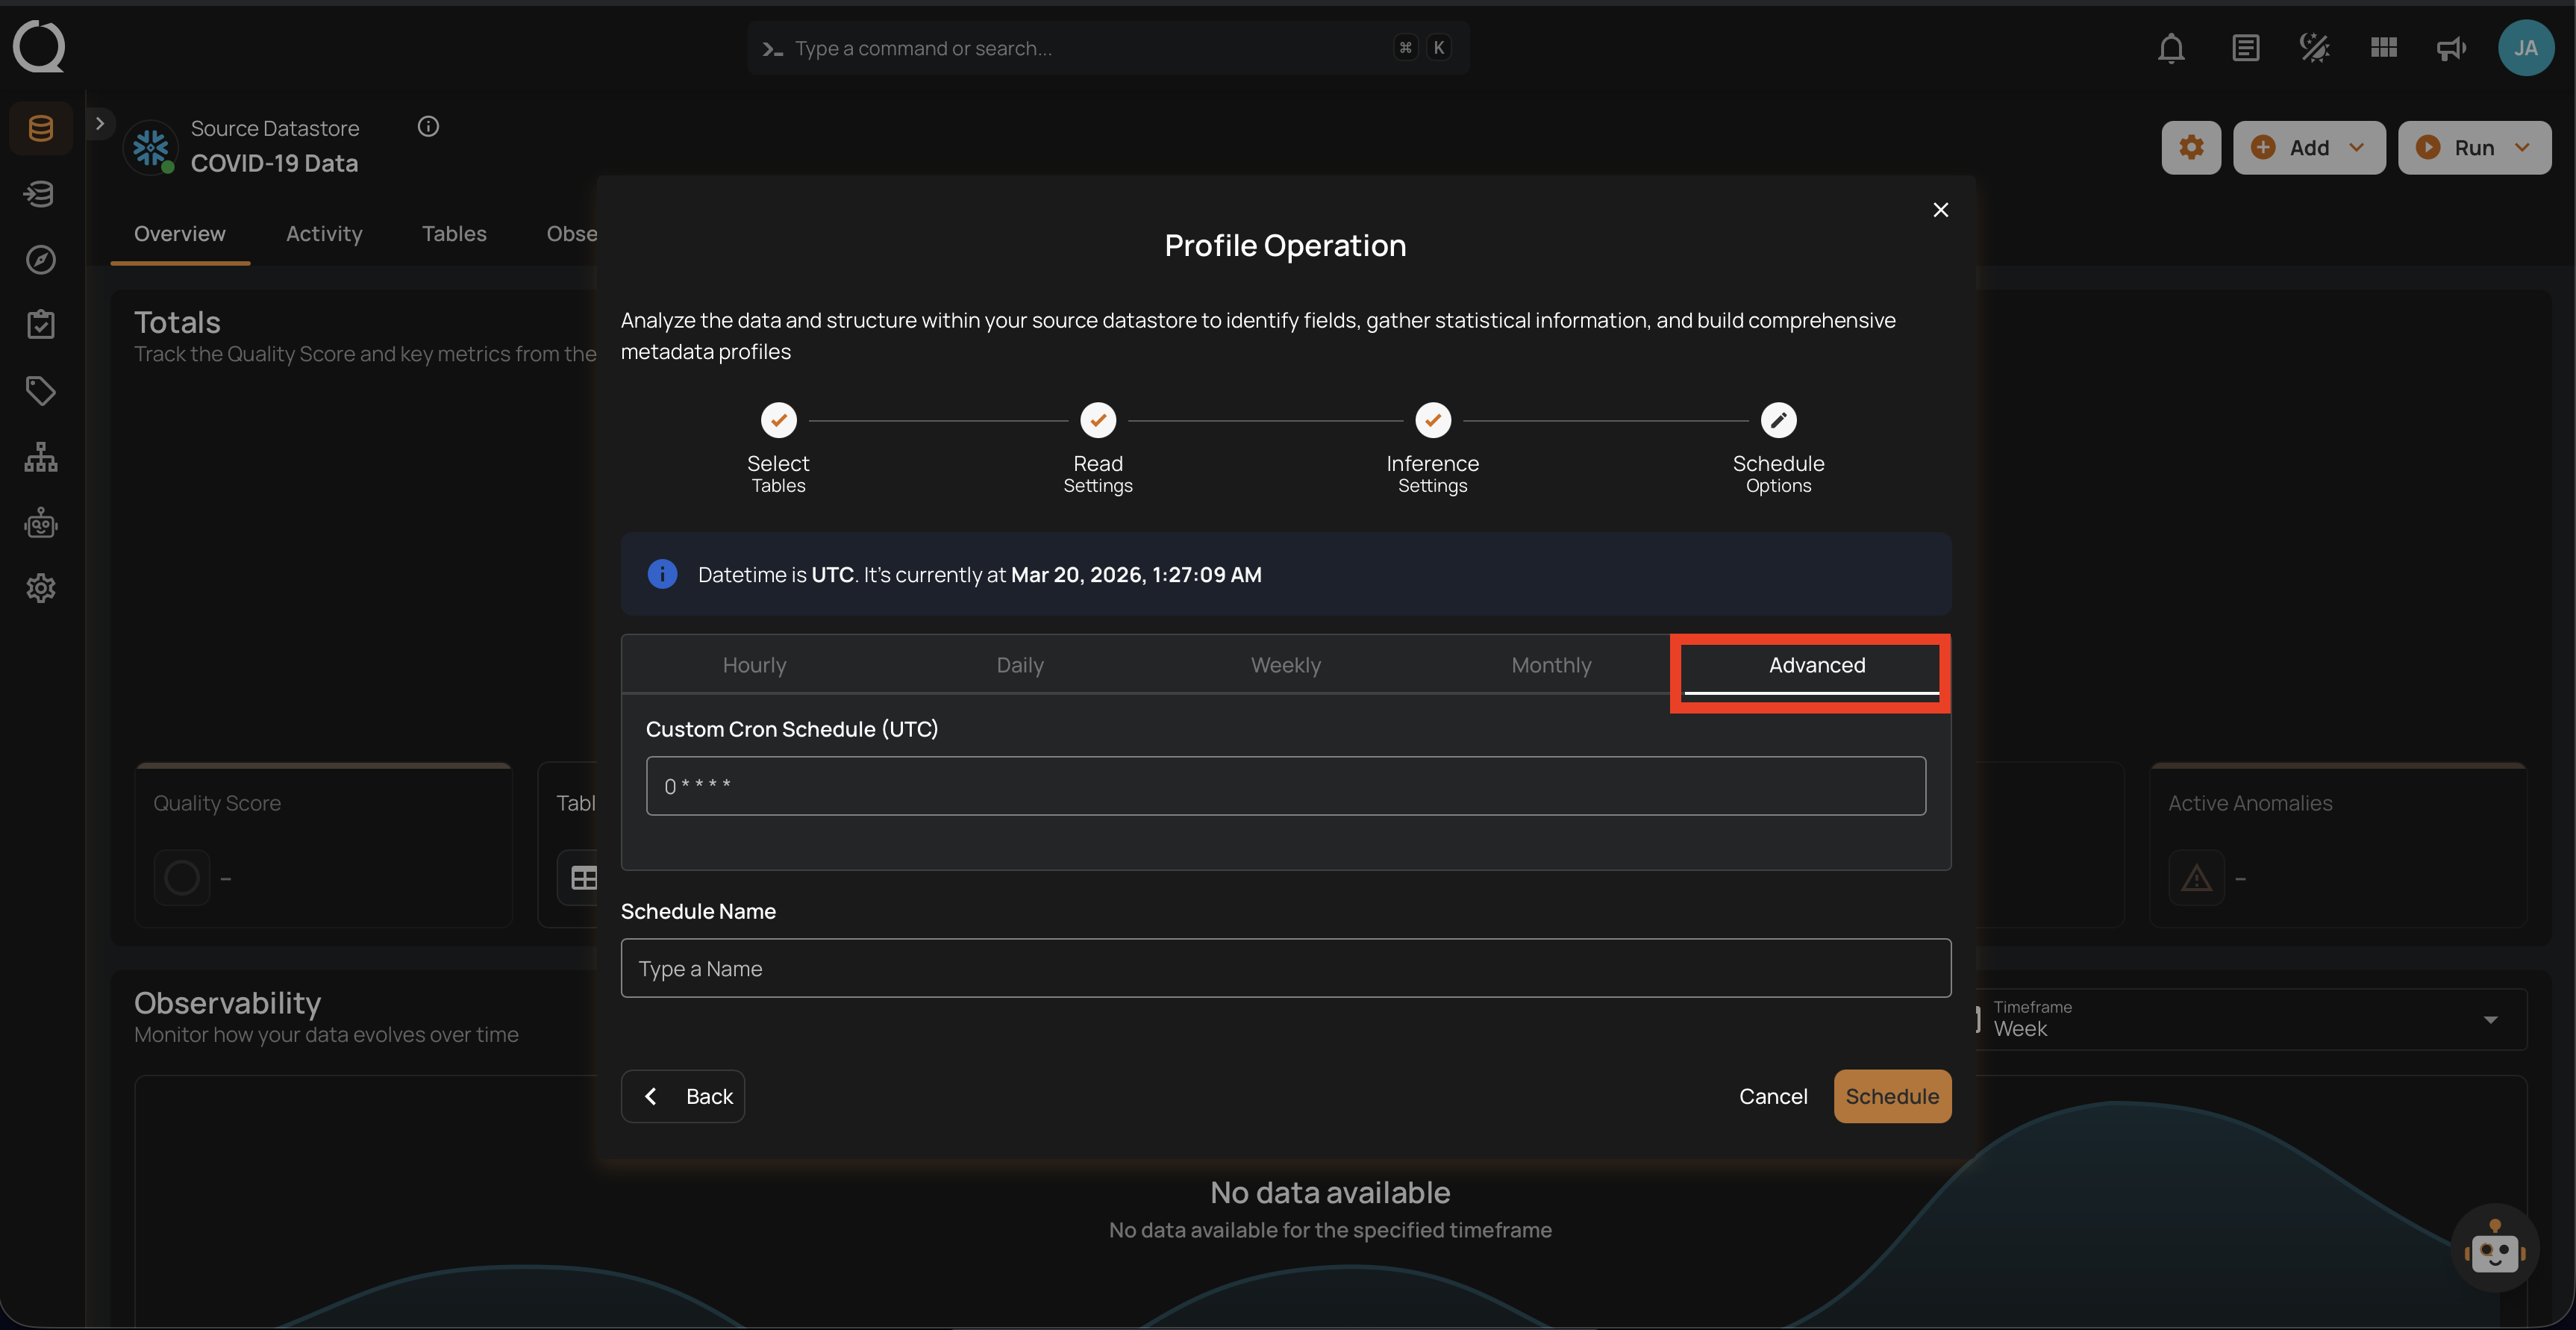
5. Advanced: The advanced section for scheduling operations allows users to set up more complex and custom scheduling using Cron expressions. This option is particularly useful for defining specific times and intervals for profile operations with precision.
Cron expressions are a powerful and flexible way to schedule tasks. They use a syntax that specifies the exact timing of the task based on five fields:
- Minute (0 - 59)
- Hour (0 - 23)
- Day of the month (1 - 31)
- Month (1 - 12)
- Day of the week (0 - 6) (Sunday to Saturday)
Each field can be defined using specific values, ranges, or special characters to create the desired schedule.
Example: For instance, the Cron expression 0 0 * * * schedules the profile operation to run at midnight (00:00) every day. Here’s a breakdown of this expression:
- 0 (Minute) - The task will run at the 0th minute.
- 0 (Hour) - The task will run at the 0th hour (midnight).
- *(Day of the month) - The task will run every day of the month.
- *(Month) - The task will run every month.
- *(Day of the week) - The task will run every day of the week.
Users can define other specific schedules by adjusting the Cron expression. For example:
- 0 12 * * 1-5 - Runs at 12:00 PM from Monday to Friday.
- 30 14 1 * * - Runs at 2:30 PM on the first day of every month.
- 0 22 * * 6 - Runs at 10:00 PM every Saturday.
To define a custom schedule, enter the appropriate Cron expression in the Custom Cron Schedule field before specifying the schedule name. The field label shows the abbreviation for the currently selected timezone (for example, Custom Cron Schedule (UTC) or Custom Cron Schedule (EST)), and the cron fields are interpreted in that timezone.
Step 4: Define the Schedule Name to identify the scheduled operation at the running time.
Step 5: Click on the Schedule button to activate your profile operation schedule.
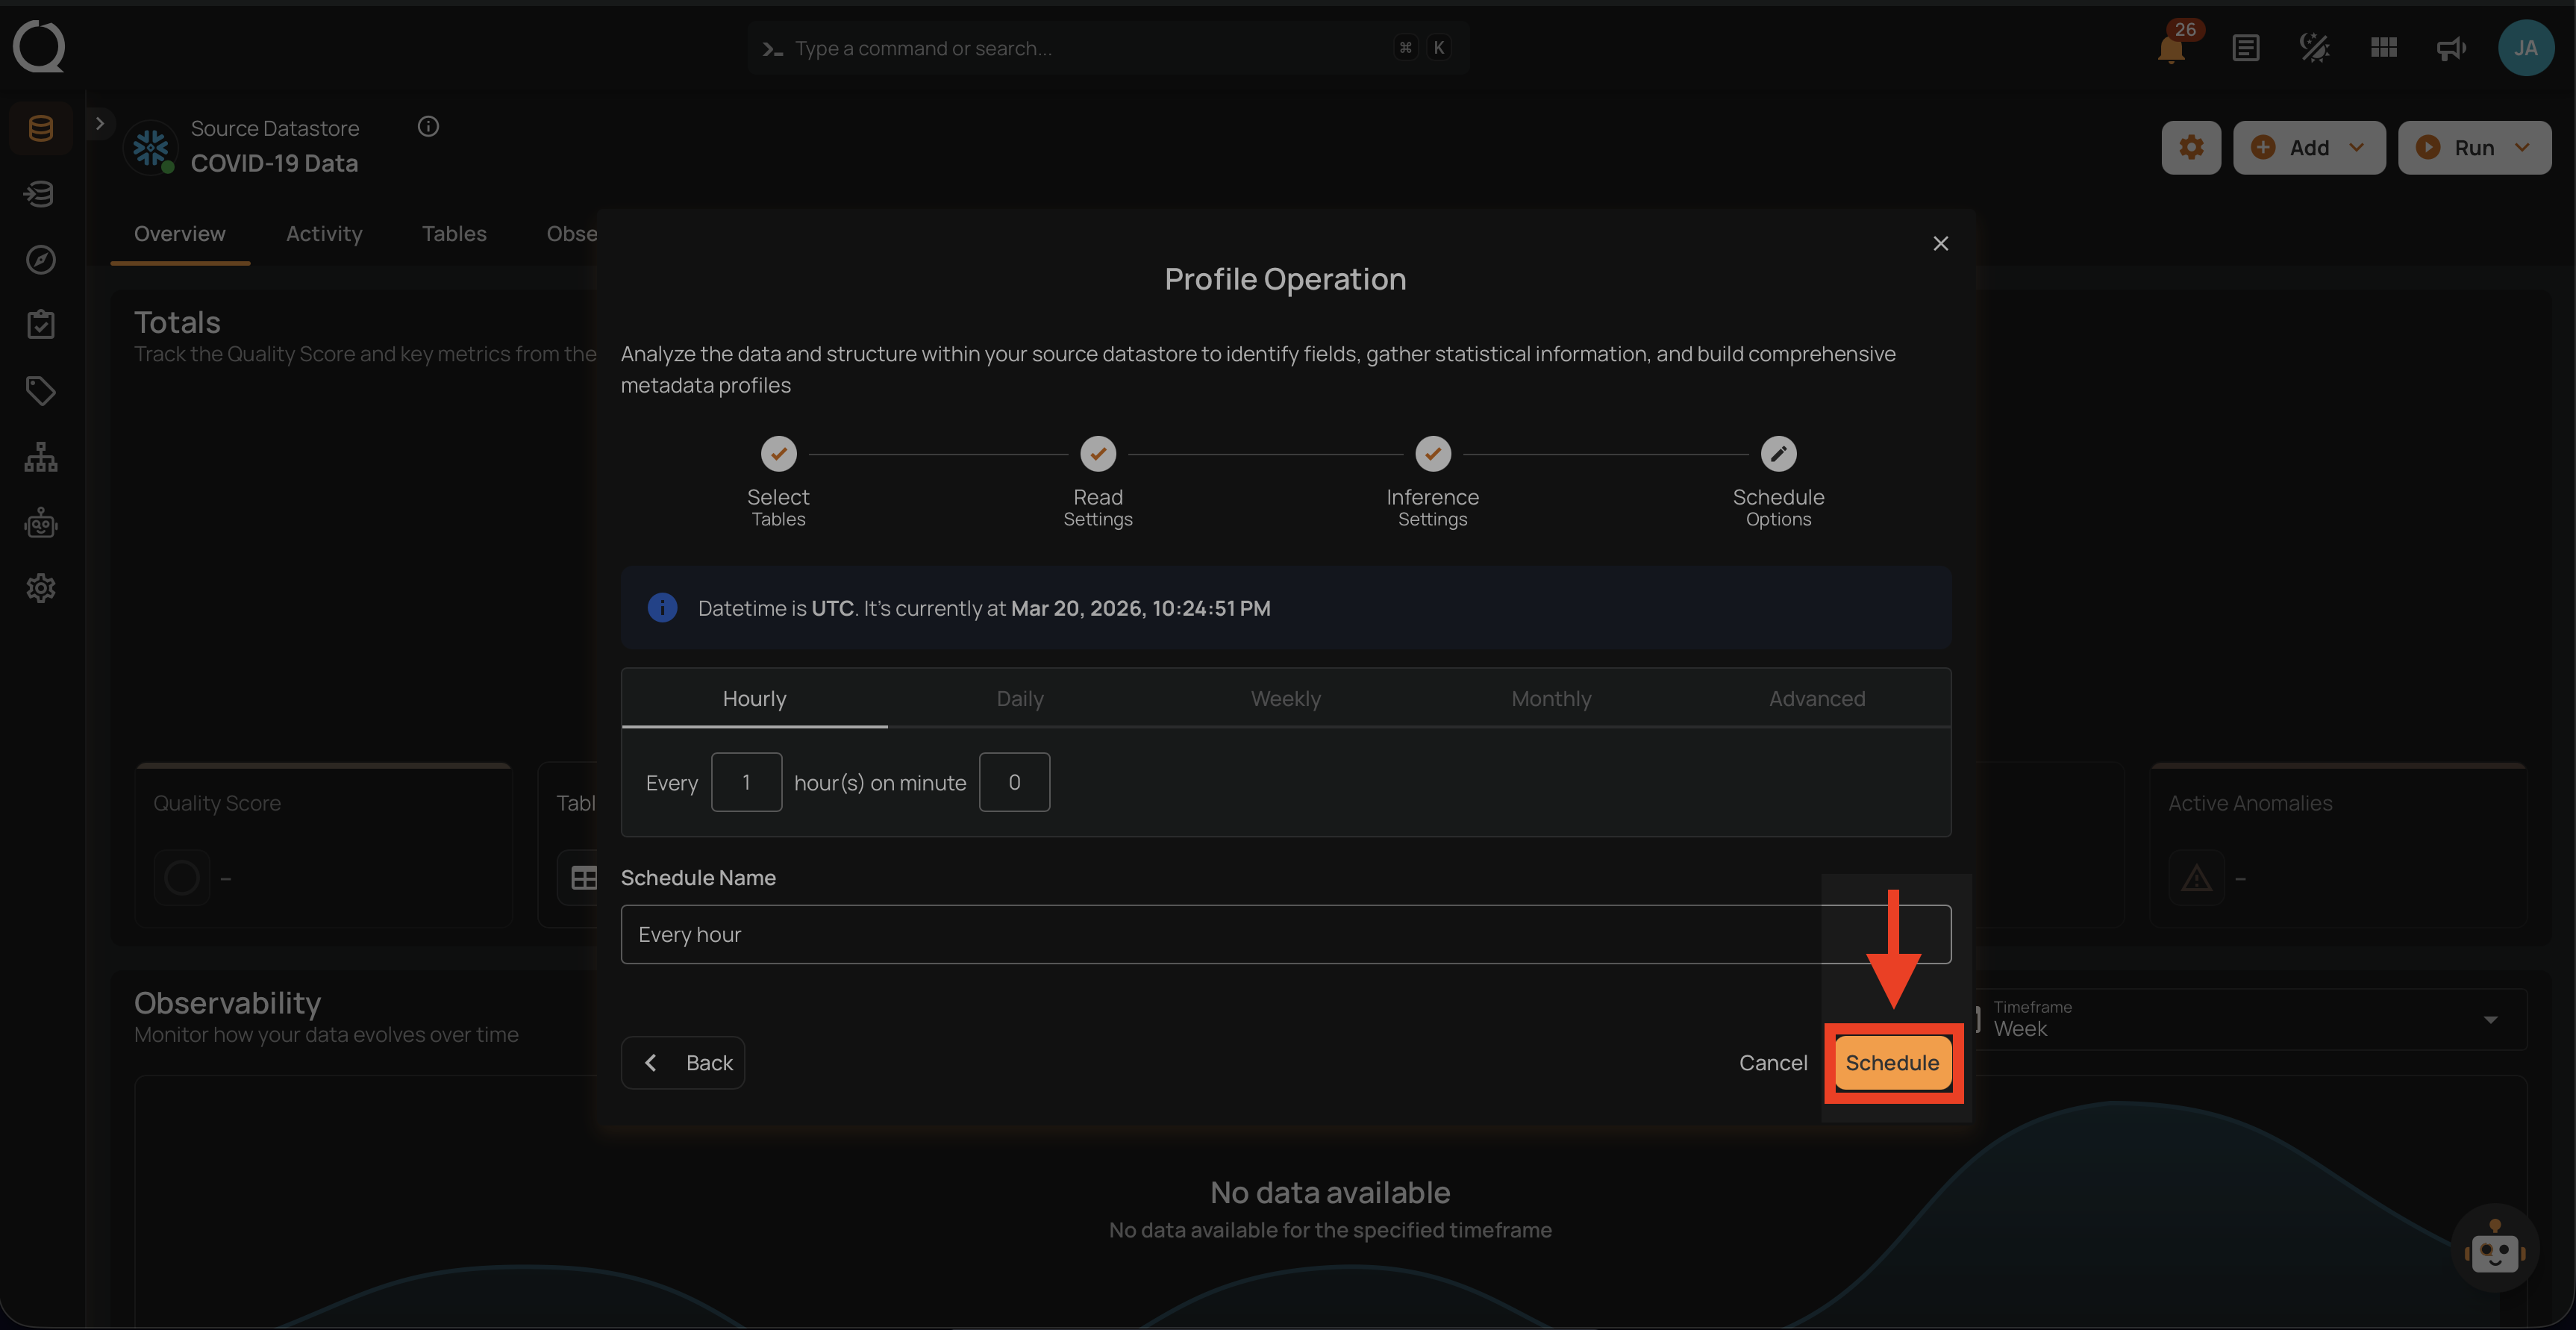
Note
You will receive a notification when the profile operation is completed.
Daylight Saving Time
When you pick a timezone that observes DST (such as America/New_York or Europe/London), the schedule automatically shifts with each transition. A job set to run at 9:00 AM in America/New_York runs at 9:00 AM local time year-round, regardless of whether the zone is in EST or EDT at the time. No reconfiguration is required.
Field Masking and Profiling
Profiling runs normally on masked fields — masking does not affect the collection of statistical metadata. The platform continues to compute all profile metrics (distinct values, min/max, mean, standard deviation, completeness, etc.) using the actual source data.
However, when profile results are displayed or exported, masked field values are obfuscated:
- Field Profile Histograms in the UI show obfuscated bucket values for masked fields
- Exported Field Profiles (
_field_profiles_export) written to the enrichment datastore contain obfuscated histogram values for masked fields
Info
To obtain revealed histogram data in exported field profiles, enable the Reveal Masked Values toggle when triggering the Export operation, or pass include_masked=true via the API. See Field Masking and Export for details.
Operation Insights
When the profile operation is completed, you will receive the notification and can navigate to the Activity tab for the datastore on which you triggered the Profile Operation and learn about the operation results.
Top Panel
-
Runs (Default View): Provides insights into the operations that have been performed
-
Schedule: Provides insights into the scheduled operations.
-
Search: Search any operation (including profile) by entering the operation ID
-
Sort by: Organize the list of operations based on the Created Date or the Duration.
-
Filter: Narrow down the list of operations based on:
-
Operation Type
- Operation Status
- Table
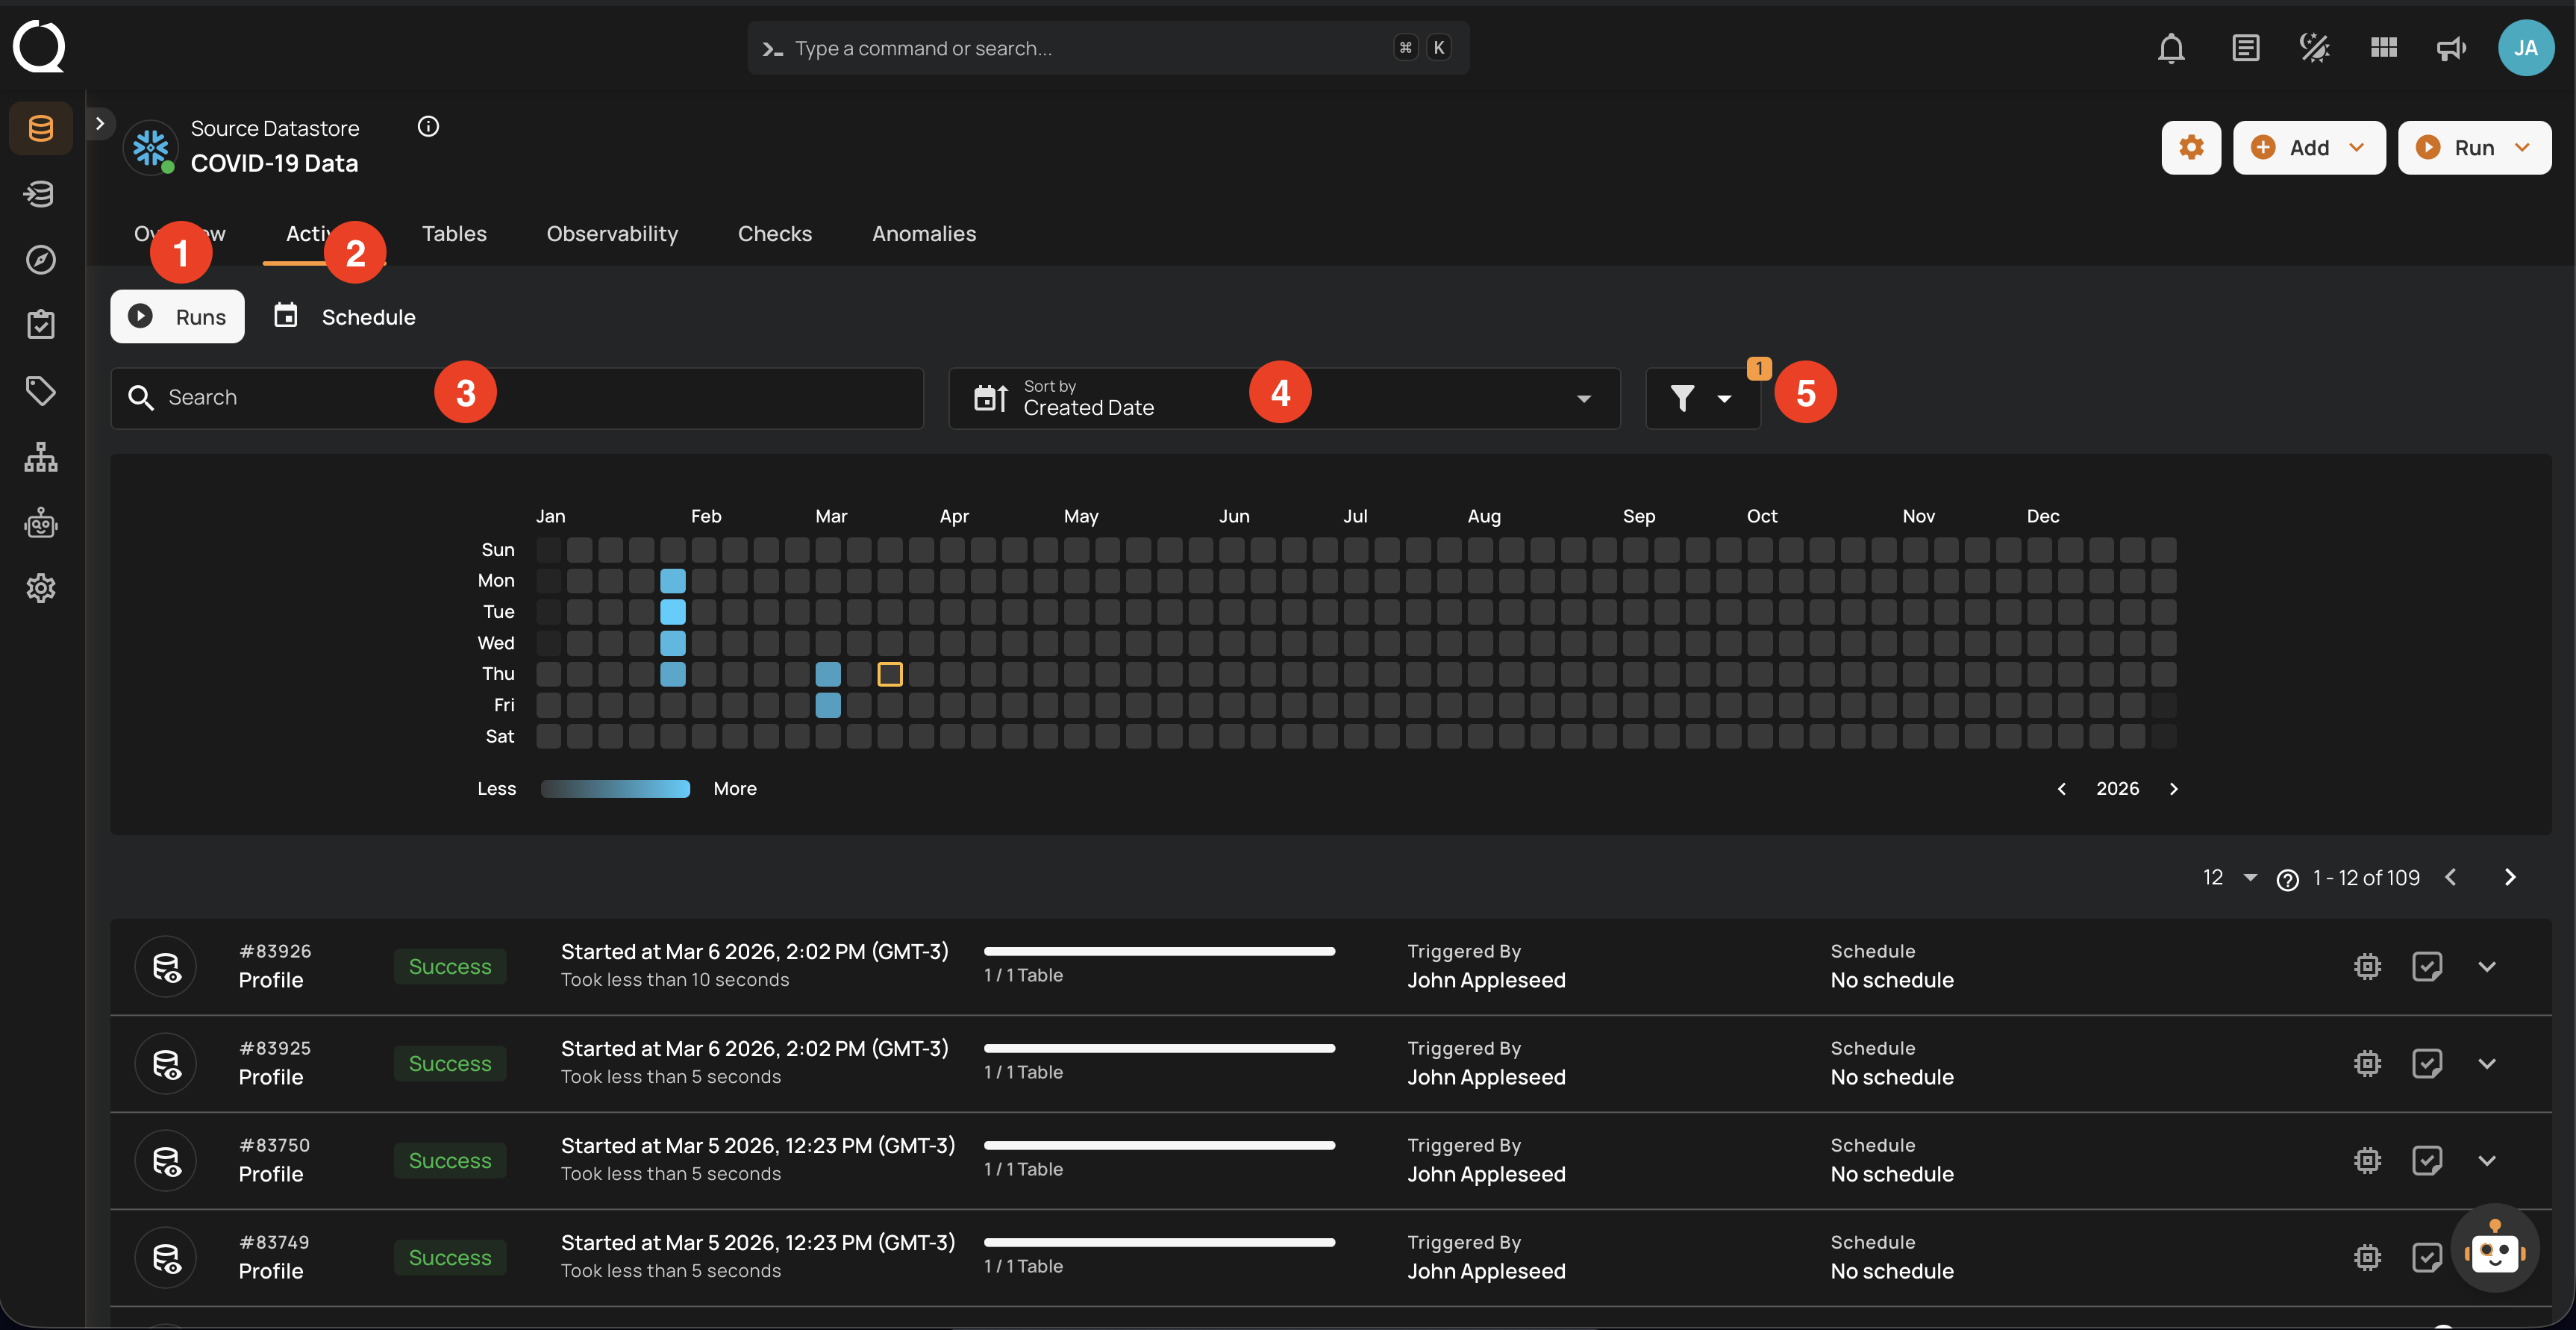
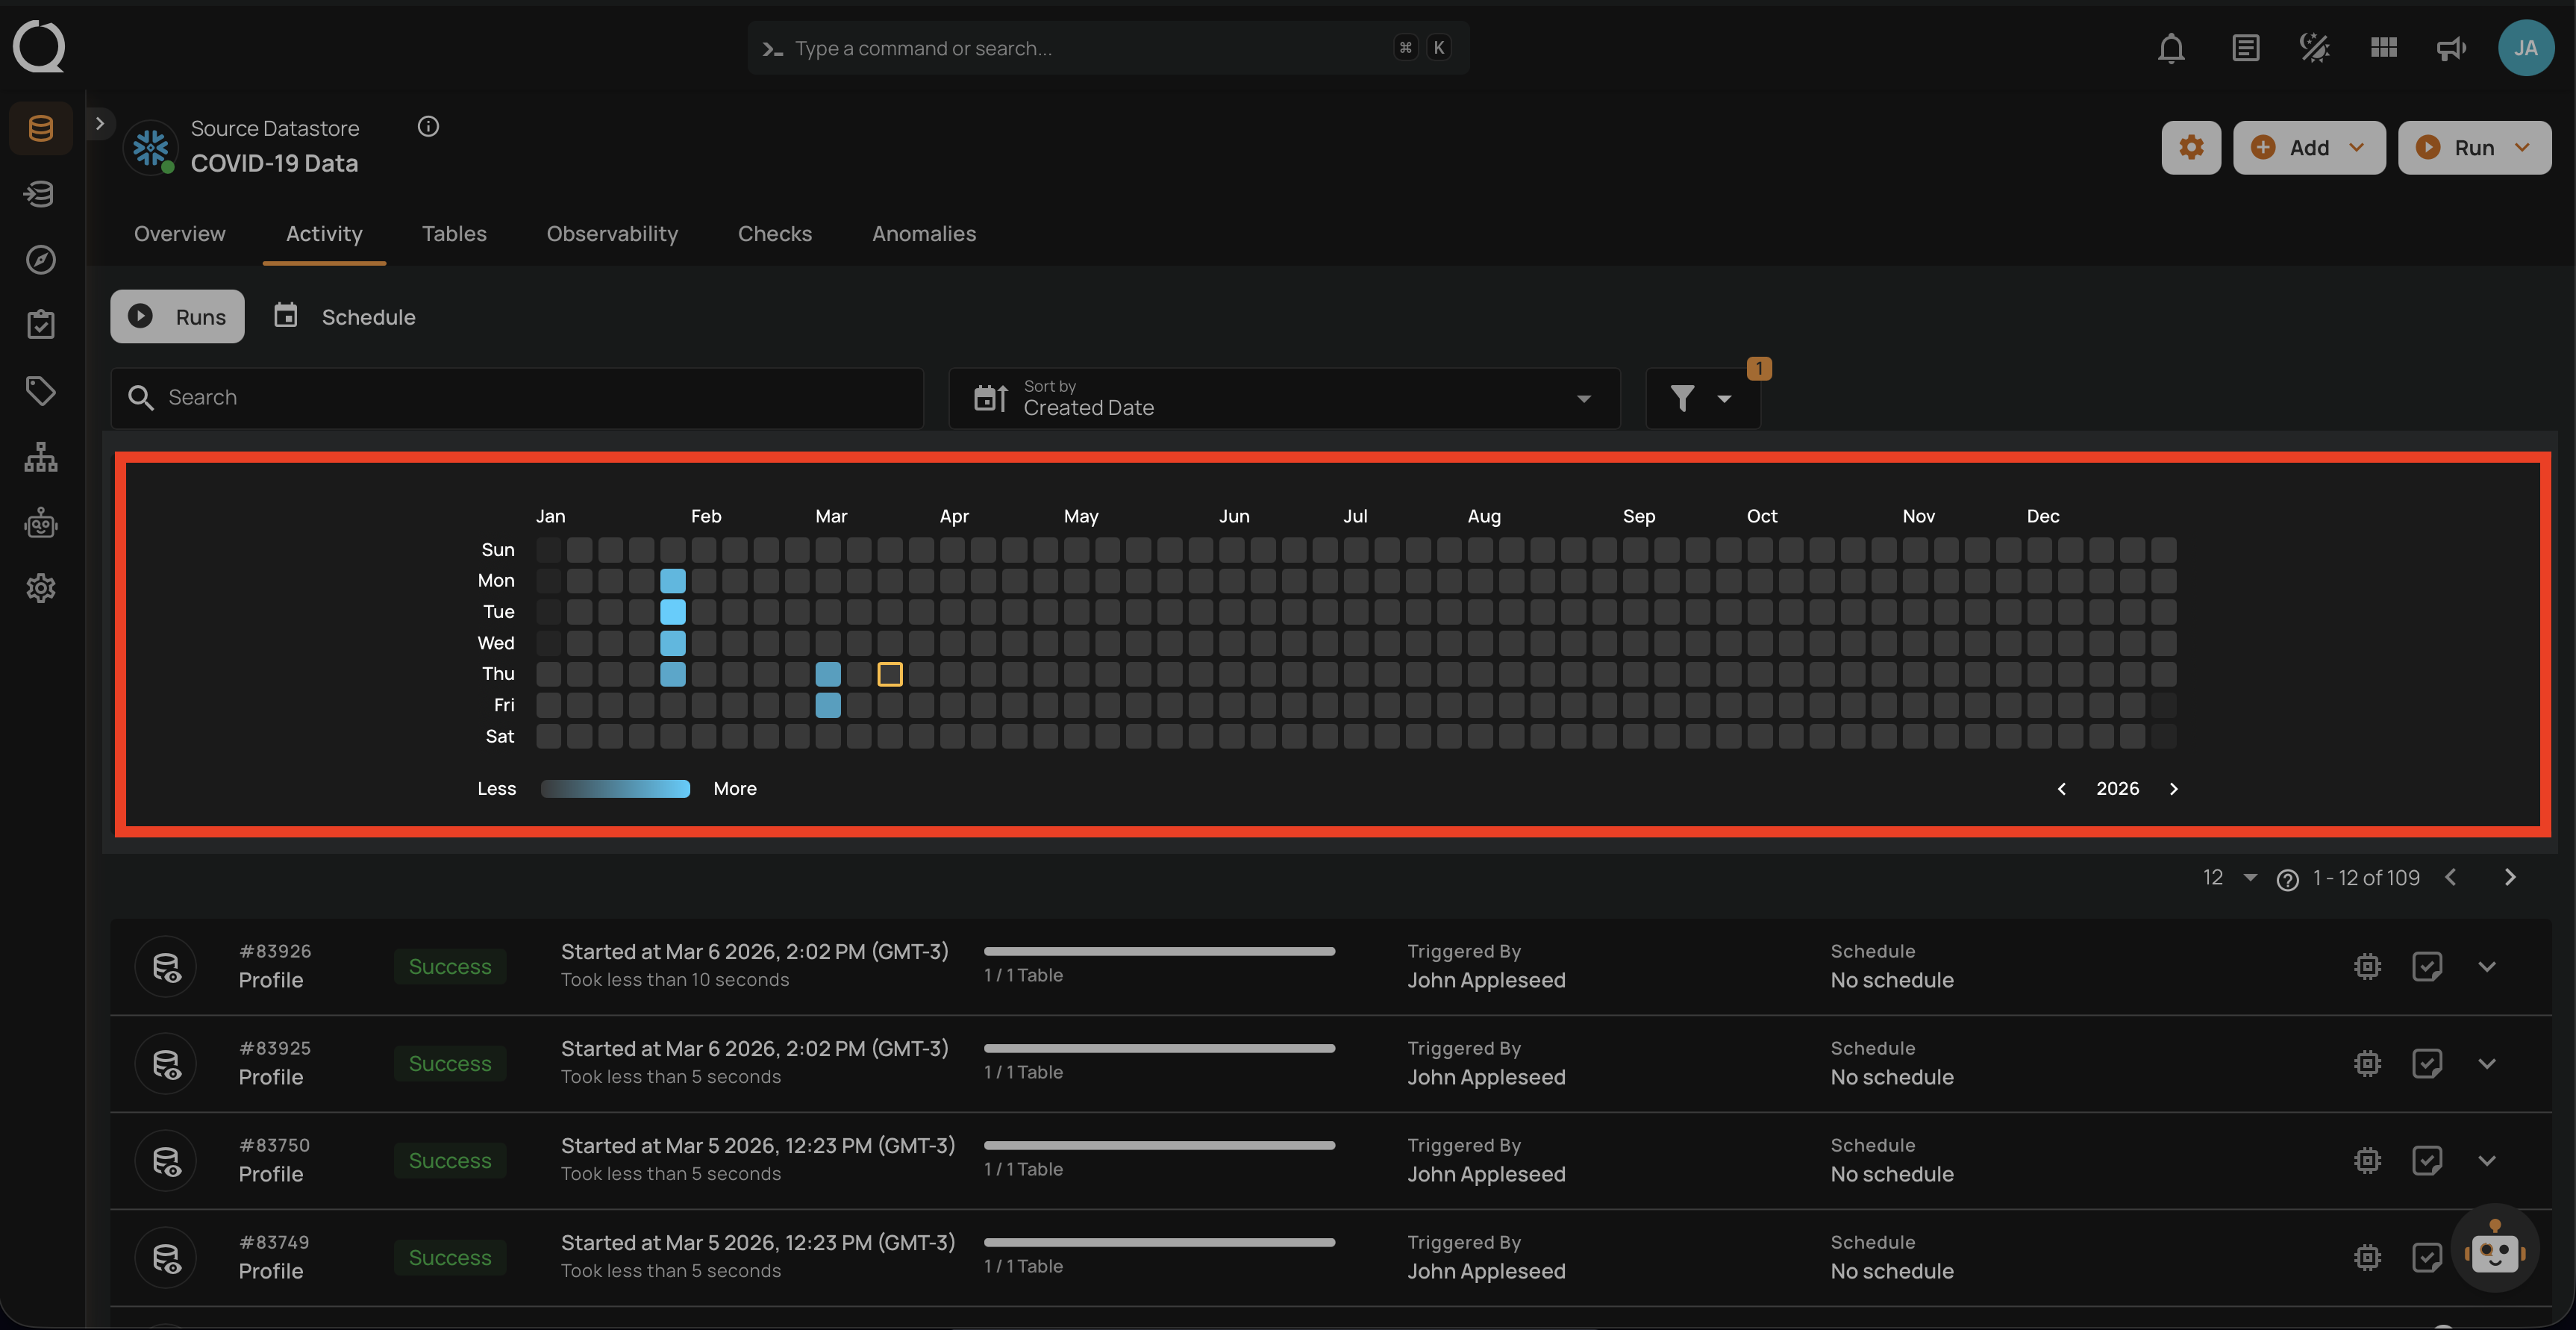
Activity Heatmap
The activity heatmap shown in the snippet below represents activity levels over a period, with each square indicating a day and the color intensity representing the number of operations or activities on that day. It is useful in tracking the number of operations performed on each day within a specific timeframe.
Tip
You can click on any of the squares from the Activity Heatmap to filter operations
Operation Detail
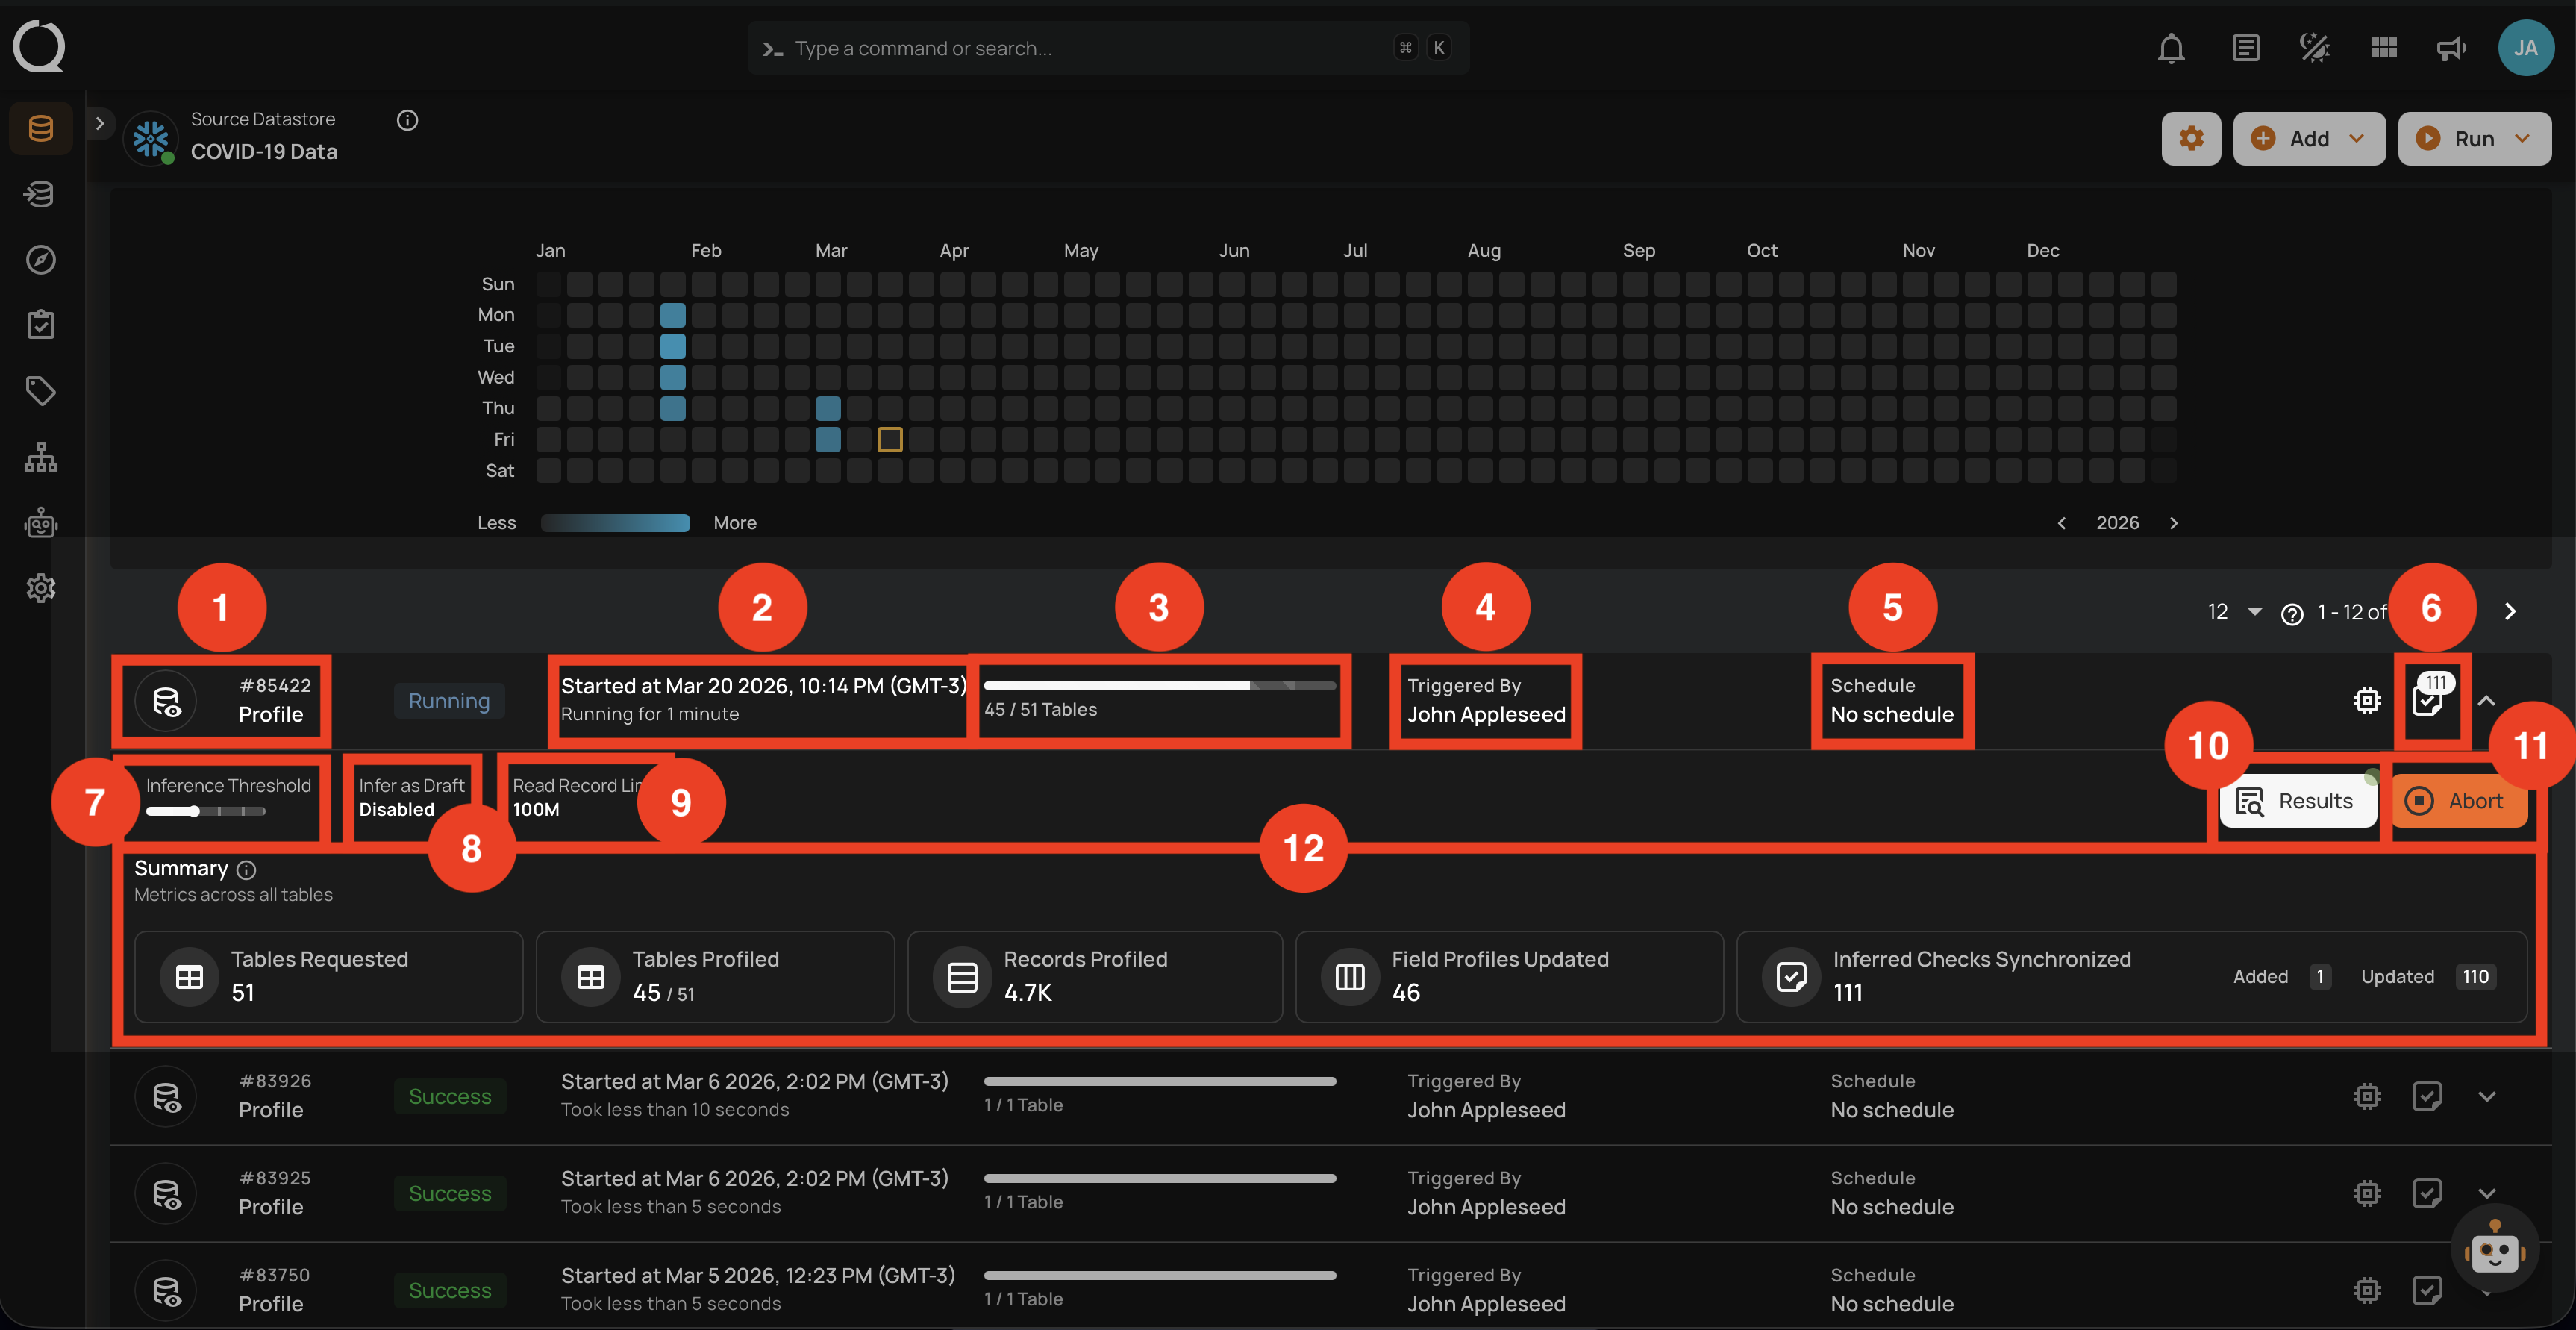
Running
This status indicates that the profile operation is still running at the moment and is yet to be completed. A profile operation having a running status reflects the following details and actions:
| No. | Parameter | Interpretation |
|---|---|---|
| 1. | Operation ID & Operation Type | Unique identifier and type of operation performed (sync, profile, or scan). |
| 2. | Timestamp | Timestamp when the operation was started. |
| 3. | Progress Bar | The progress of the operation. |
| 4. | Triggered By | The author who triggered the operation. |
| 5. | Schedule | Whether the operation was scheduled or not. |
| 6. | Checks Synchronized | Indicates the count of Checks Synchronized in the operation. |
| 7. | AI Effort | The selected AI Effort level (Off, Low, Medium, High, Extra High, or Max) for AI Managed check authoring during the operation. |
| 8. | AI Authored Checks | Indicates whether AI Managed checks from this profile run were activated automatically (Activated) or created for review (Draft). |
| 9. | Read Record Limit | Defines the maximum number of records to be scanned per table after initial filtering. |
| 10. | Results | Provides immediate insights into the profile operation conducted. |
| 11. | Abort | The "Abort" button enables you to stop the ongoing profile operation. |
| 12. | Summary | The "Summary" section provides a real-time overview of the profile operation's progress. It includes key metrics such as:
|
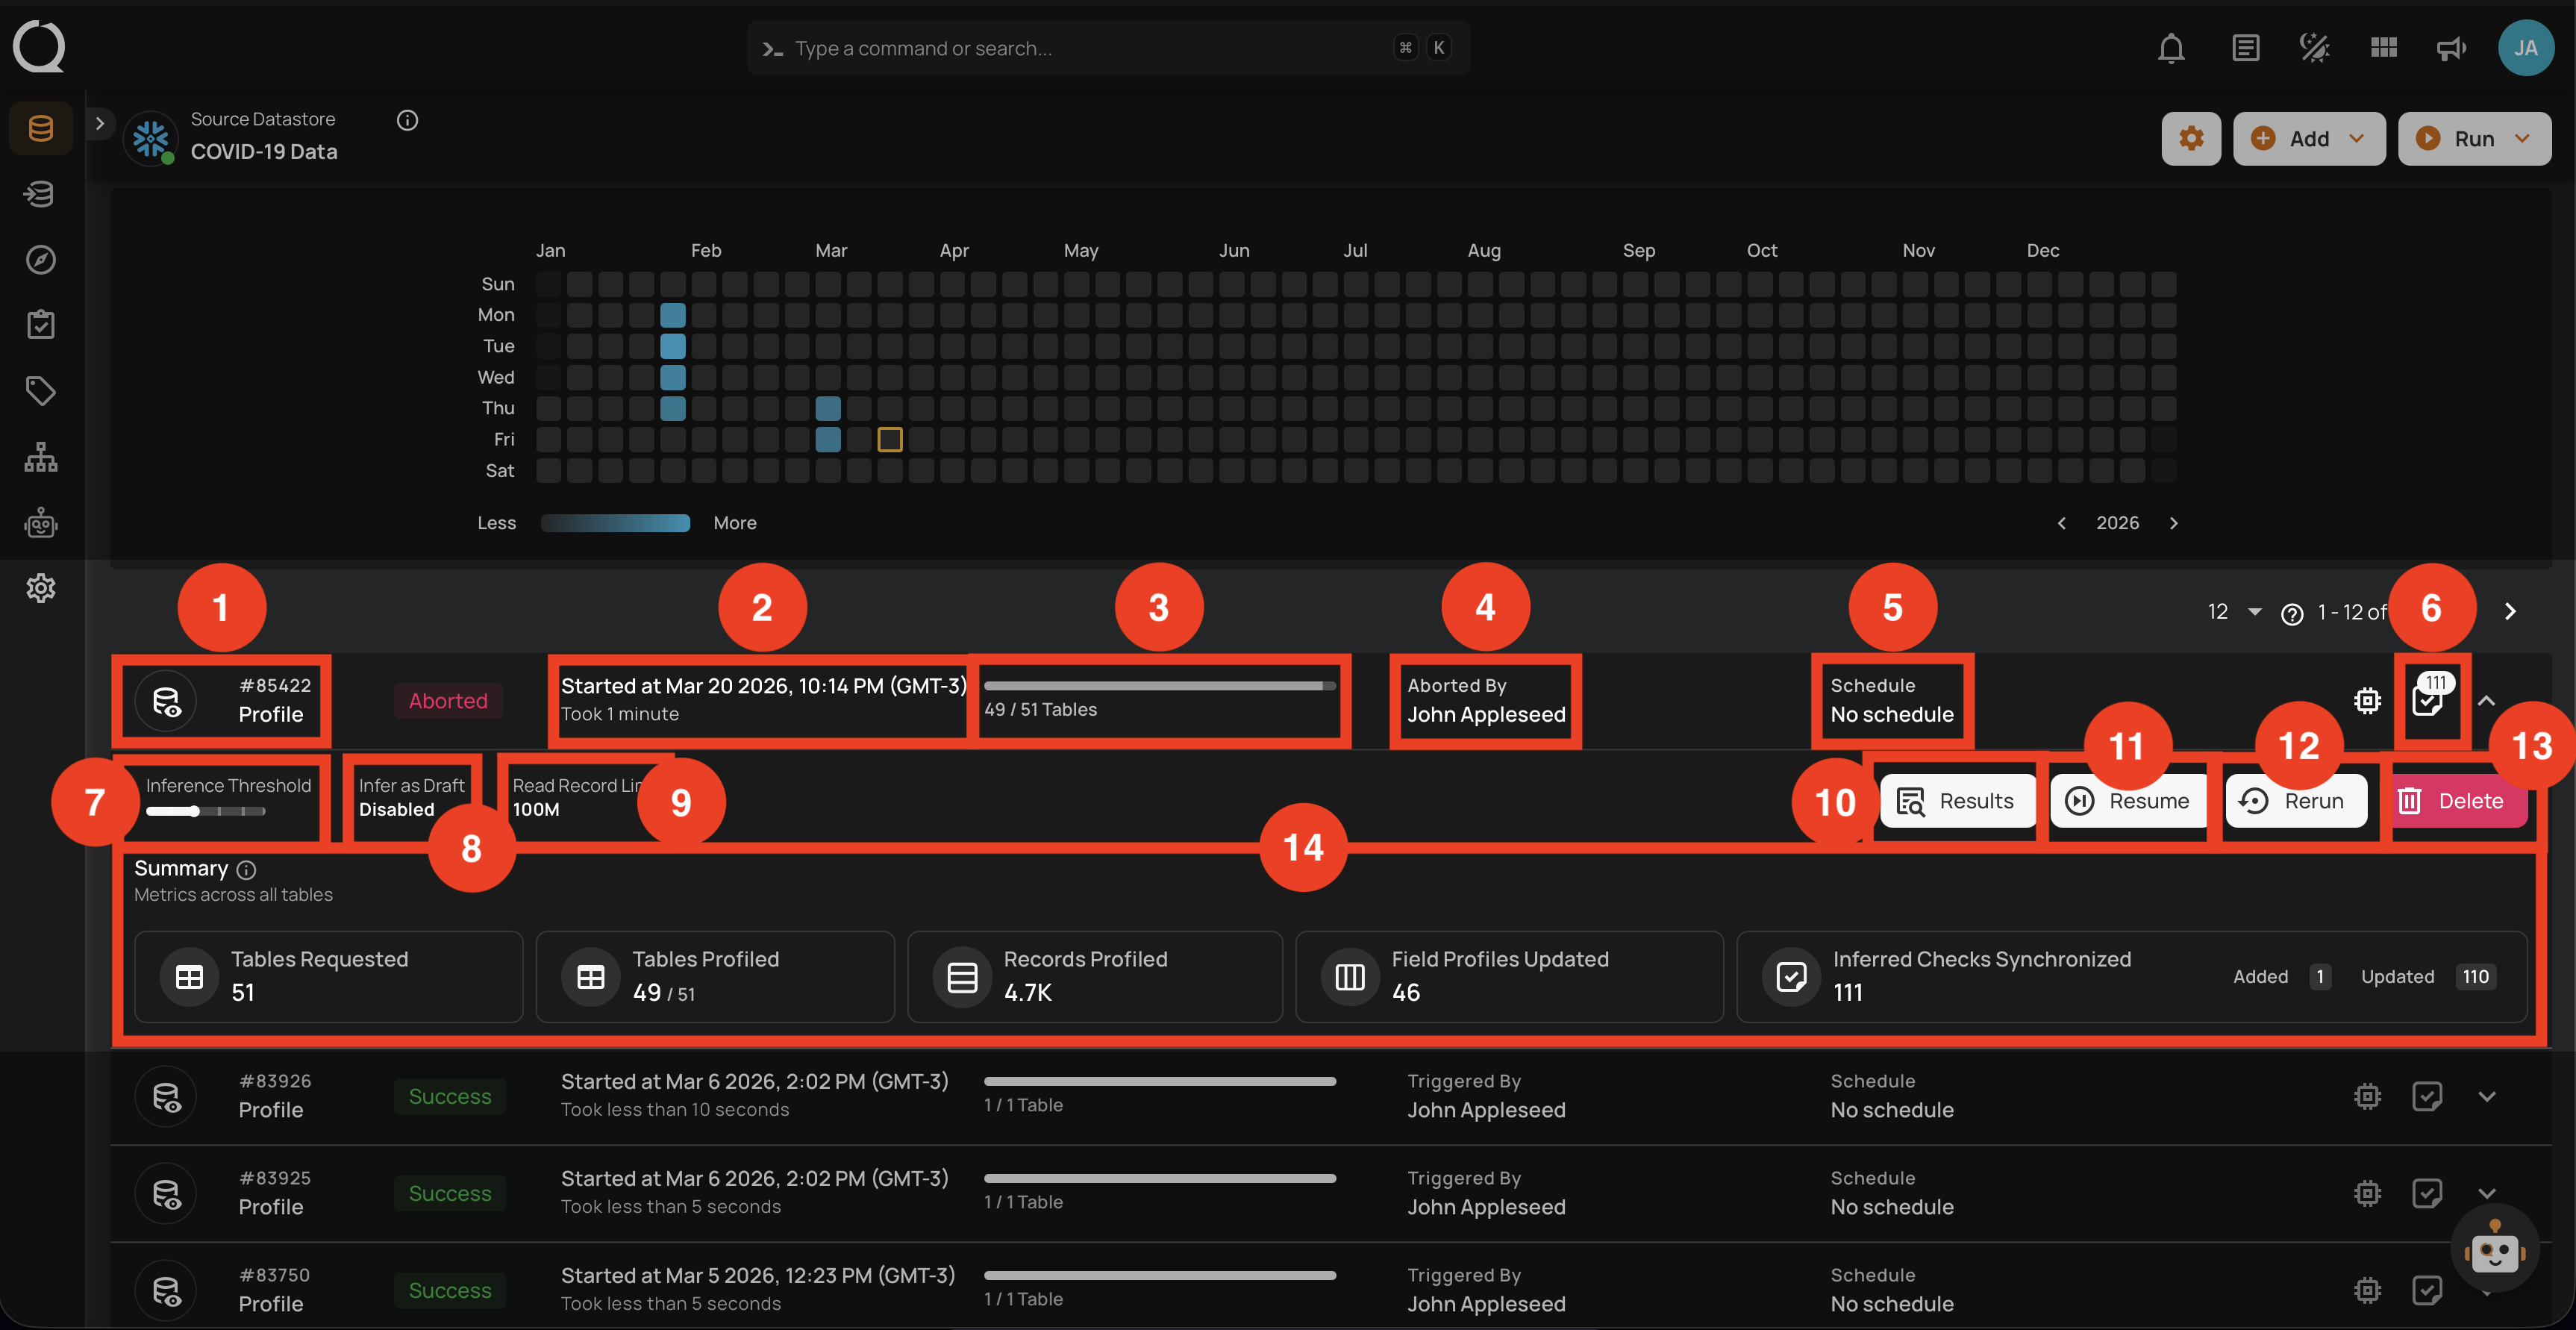
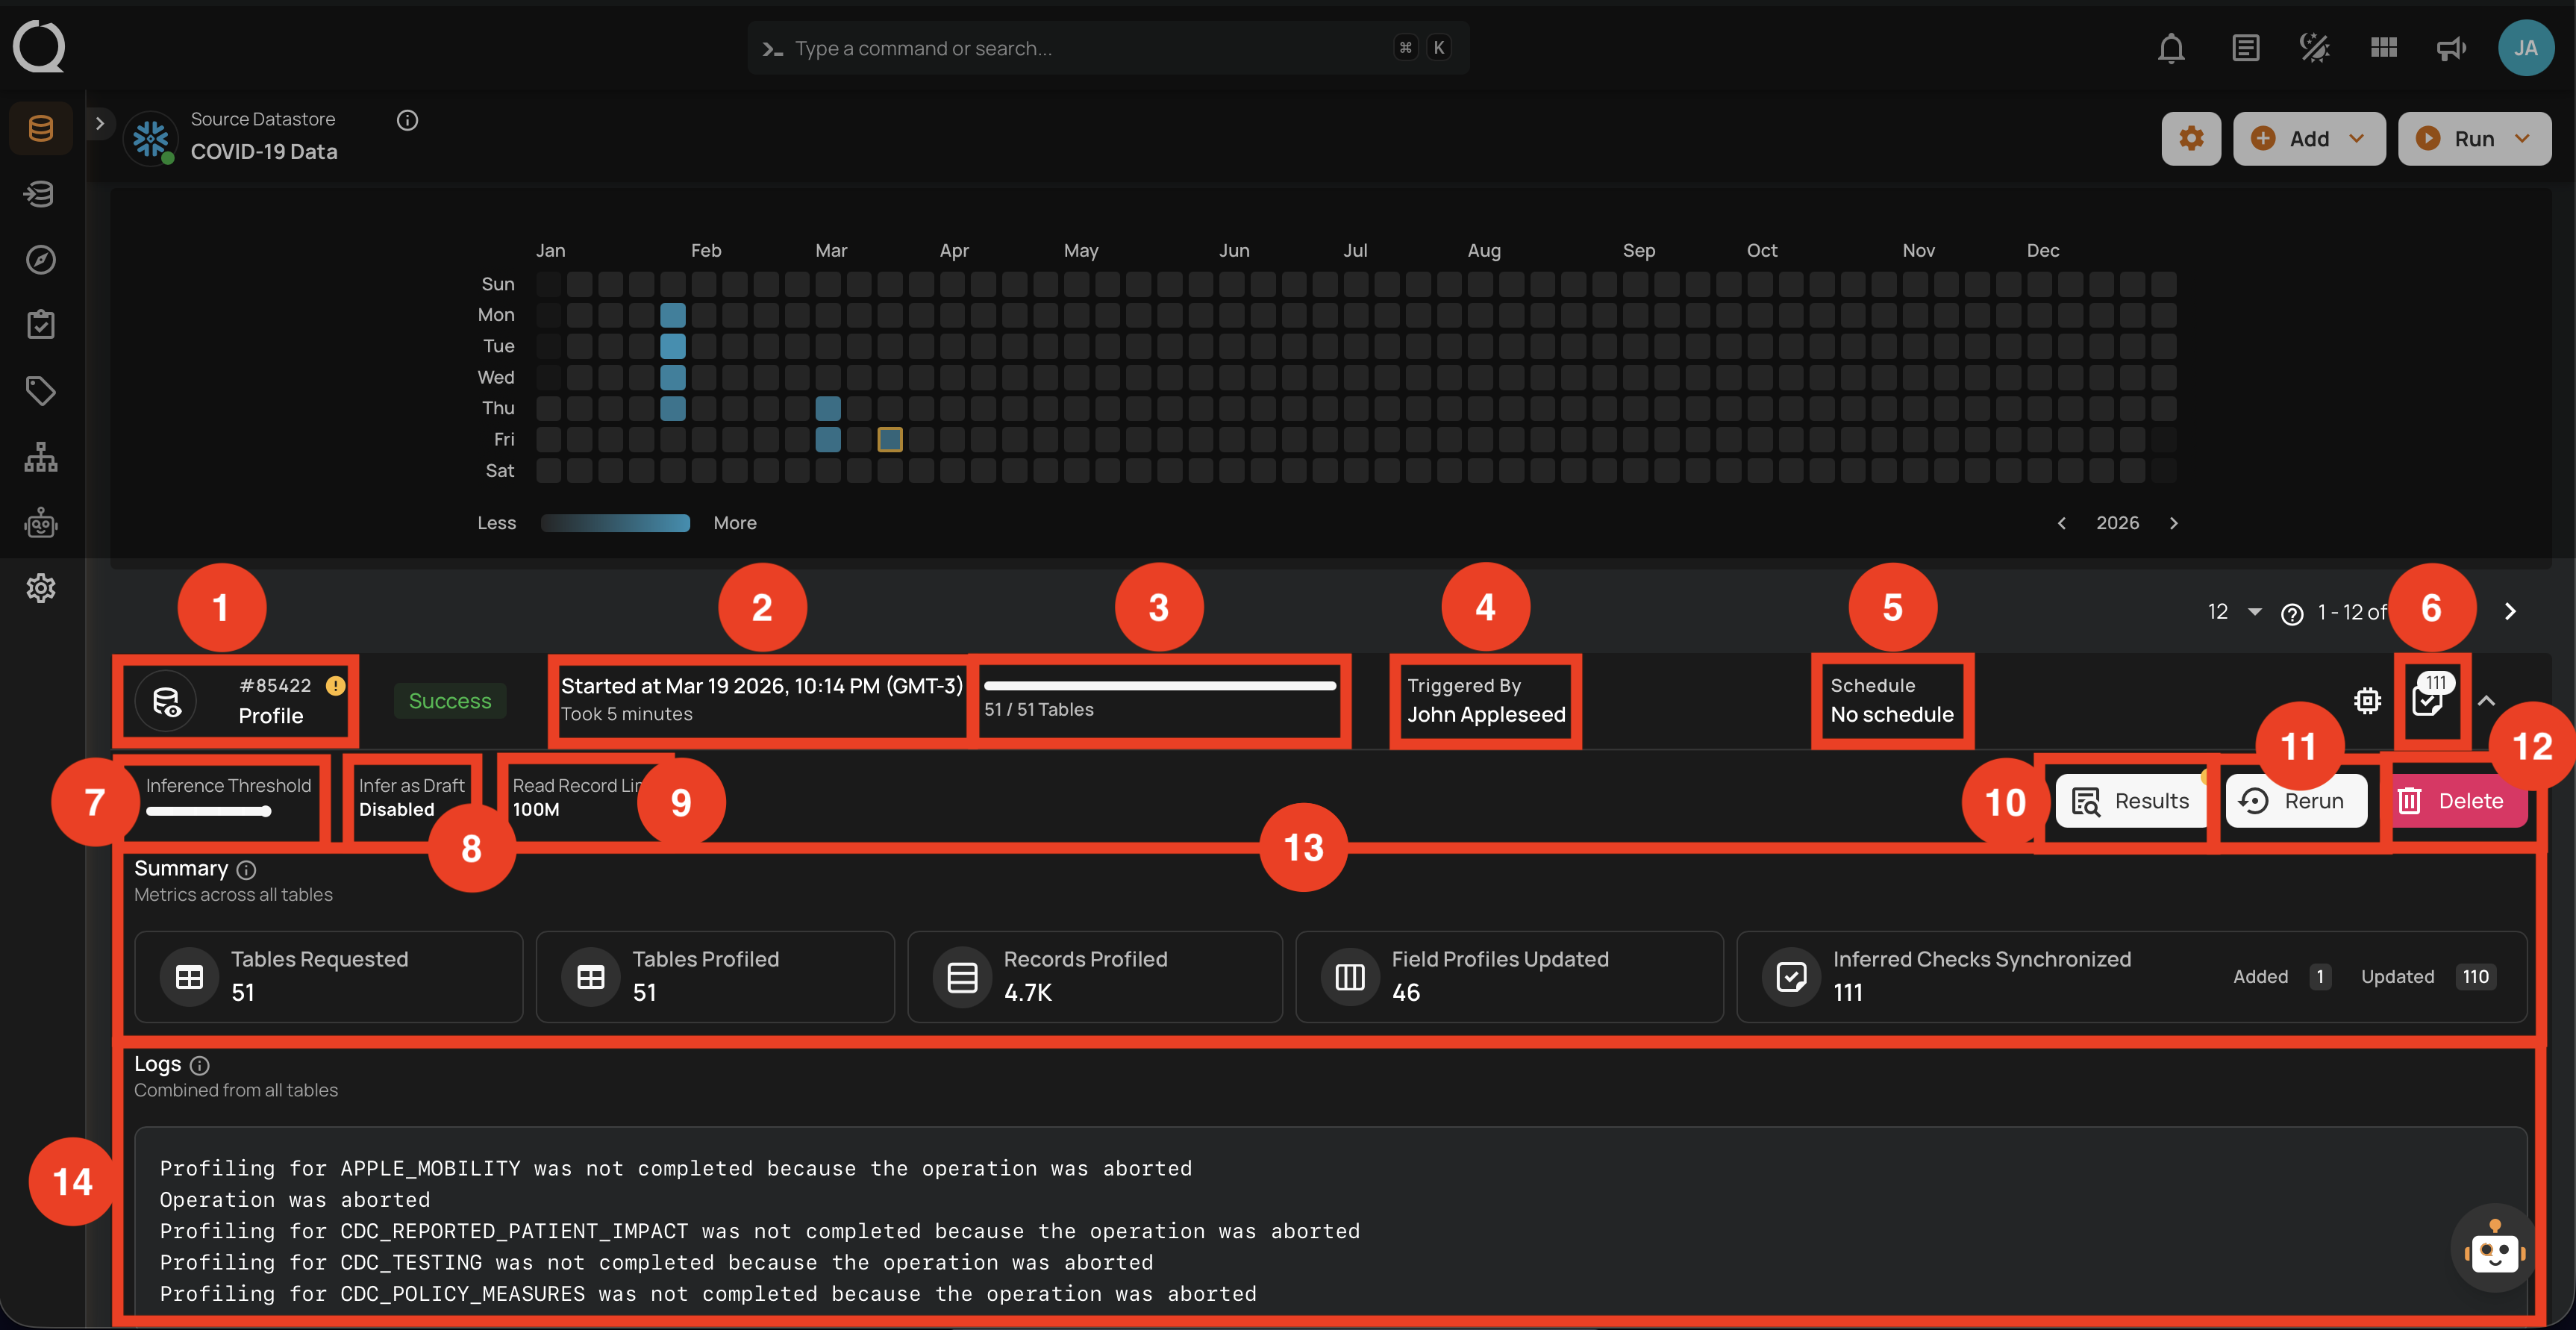
Aborted
This status indicates that the profile operation was manually stopped before it could be completed. A profile operation having an aborted status reflects the following details and actions:
| No. | Parameter | Interpretation |
|---|---|---|
| 1. | Operation ID & Operation Type | Unique identifier and type of operation performed (sync, profile, or scan). |
| 2. | Timestamp | Timestamp when the operation was started. |
| 3. | Progress Bar | The progress of the operation. |
| 4. | Aborted By | The author who Aborted the operation. |
| 5. | Schedule | Whether the operation was scheduled or not. |
| 6. | Checks Synchronized | Indicates the count of Checks Synchronized in the operation. |
| 7. | AI Effort | The selected AI Effort level (Off, Low, Medium, High, Extra High, or Max) for AI Managed check authoring during the operation. |
| 8. | AI Authored Checks | Indicates whether AI Managed checks from this profile run were activated automatically (Activated) or created for review (Draft). |
| 9. | Read Record Limit | Defines the maximum number of records to be scanned per table after initial filtering. |
| 10. | Results | Provides immediate insights into the profile operation conducted. |
| 11. | Resume | Provides an option to continue the profile operation from where it left off. |
| 12. | Rerun | Allows you to start a new profile operation using the same settings as the aborted scan. |
| 13. | Delete | Removes the record of the aborted profile operation from the system, permanently deleting results. |
| 14. | Summary | The "Summary" section provides a real-time overview of the profile operation's progress. It includes key metrics such as:
|
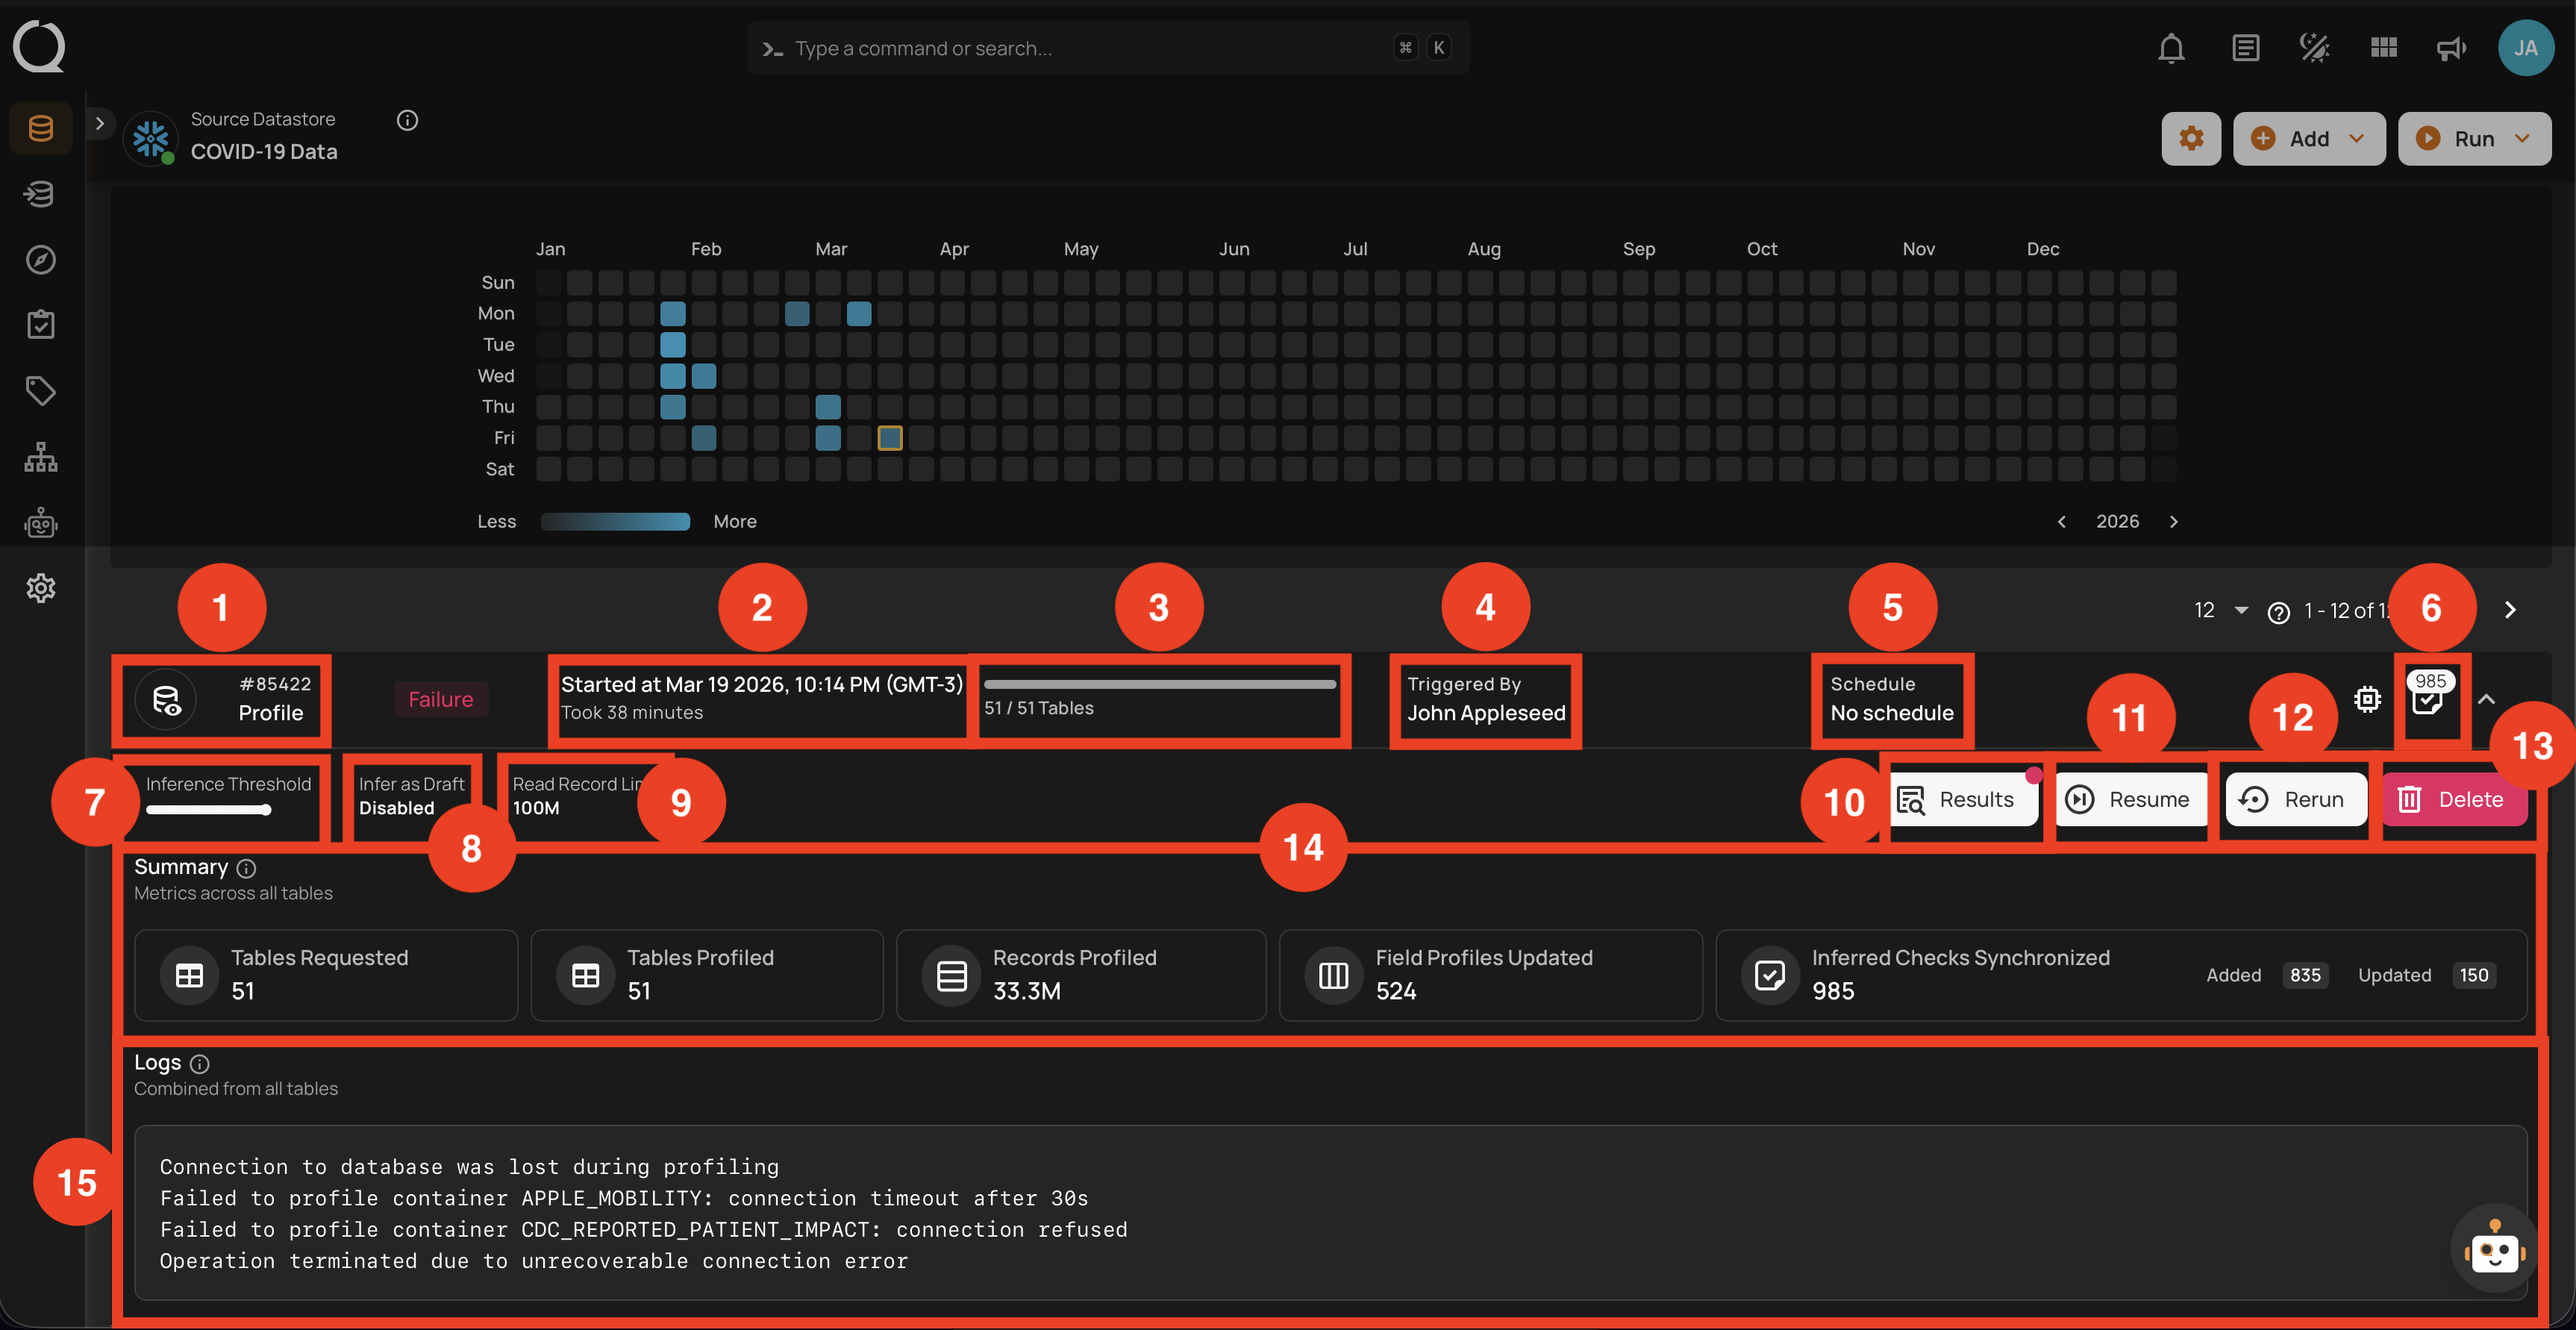
Failure
This status indicates that the profile operation failed due to unrecoverable errors such as connection timeouts, refused connections, or permission issues. A profile operation having a failure status reflects the following details and actions:
| No. | Parameter | Interpretation |
|---|---|---|
| 1. | Operation ID & Operation Type | Unique identifier and type of operation performed (sync, profile, or scan). |
| 2. | Timestamp | Timestamp when the operation was started. |
| 3. | Progress Bar | The progress of the operation at the time of failure. |
| 4. | Triggered By | The author who triggered the operation. |
| 5. | Schedule | Whether the operation was scheduled or not. |
| 6. | Checks Synchronized | Indicates the count of Checks Synchronized in the operation. |
| 7. | AI Effort | The selected AI Effort level (Off, Low, Medium, High, Extra High, or Max) for AI Managed check authoring during the operation. |
| 8. | AI Authored Checks | Indicates whether AI Managed checks from this profile run were activated automatically (Activated) or created for review (Draft). |
| 9. | Read Record Limit | Defines the maximum number of records to be scanned per table after initial filtering. |
| 10. | Results | Provides immediate insights into the profile operation conducted. |
| 11. | Resume | Provides an option to continue the profile operation from where it left off. |
| 12. | Rerun | Allows you to start a new profile operation using the same settings as the failed operation. |
| 13. | Delete | Removes the record of the failed profile operation from the system, permanently deleting all results. |
| 14. | Summary | The "Summary" section provides an overview of the profile operation's progress before failure. It includes key metrics such as:
|
| 15. | Logs | Logs include error messages, connection failures, permission issues, and other pertinent information that caused the profile operation to fail. |
Success with Warning
This status signals that the profile operation completed but encountered some issues, and displays the logs that facilitate improved tracking of the blockers and issue resolution. A profile operation having a success with warning status reflects the following details and actions:
| No. | Parameter | Interpretation |
|---|---|---|
| 1. | Operation ID & Operation Type | Unique identifier and type of operation performed (sync, profile, or scan). |
| 2. | Timestamp | Timestamp when the operation was started. |
| 3. | Progress Bar | The progress of the operation. |
| 4. | Triggered By | The author who triggered the operation. |
| 5. | Schedule | Whether the operation was scheduled or not. |
| 6. | Checks Synchronized | Indicates the count of Checks Synchronized in the operation. |
| 7. | AI Effort | The selected AI Effort level (Off, Low, Medium, High, Extra High, or Max) for AI Managed check authoring during the operation. |
| 8. | AI Authored Checks | Indicates whether AI Managed checks from this profile run were activated automatically (Activated) or created for review (Draft). |
| 9. | Read Record Limit | Defines the maximum number of records to be scanned per table after initial filtering. |
| 10. | Results | Provides immediate insights into the profile operation conducted. |
| 11. | Rerun | Allows you to start a new profile operation using the same settings as the warning scan. |
| 12. | Delete | Removes the record of the profile operation, permanently deleting all results. |
| 13. | Summary | The "Summary" section provides a real-time overview of the profile operation's progress. It includes key metrics such as:
|
| 14. | Logs | Logs include error messages, warnings, and other pertinent information that occurred during the execution of the Profile Operation. |
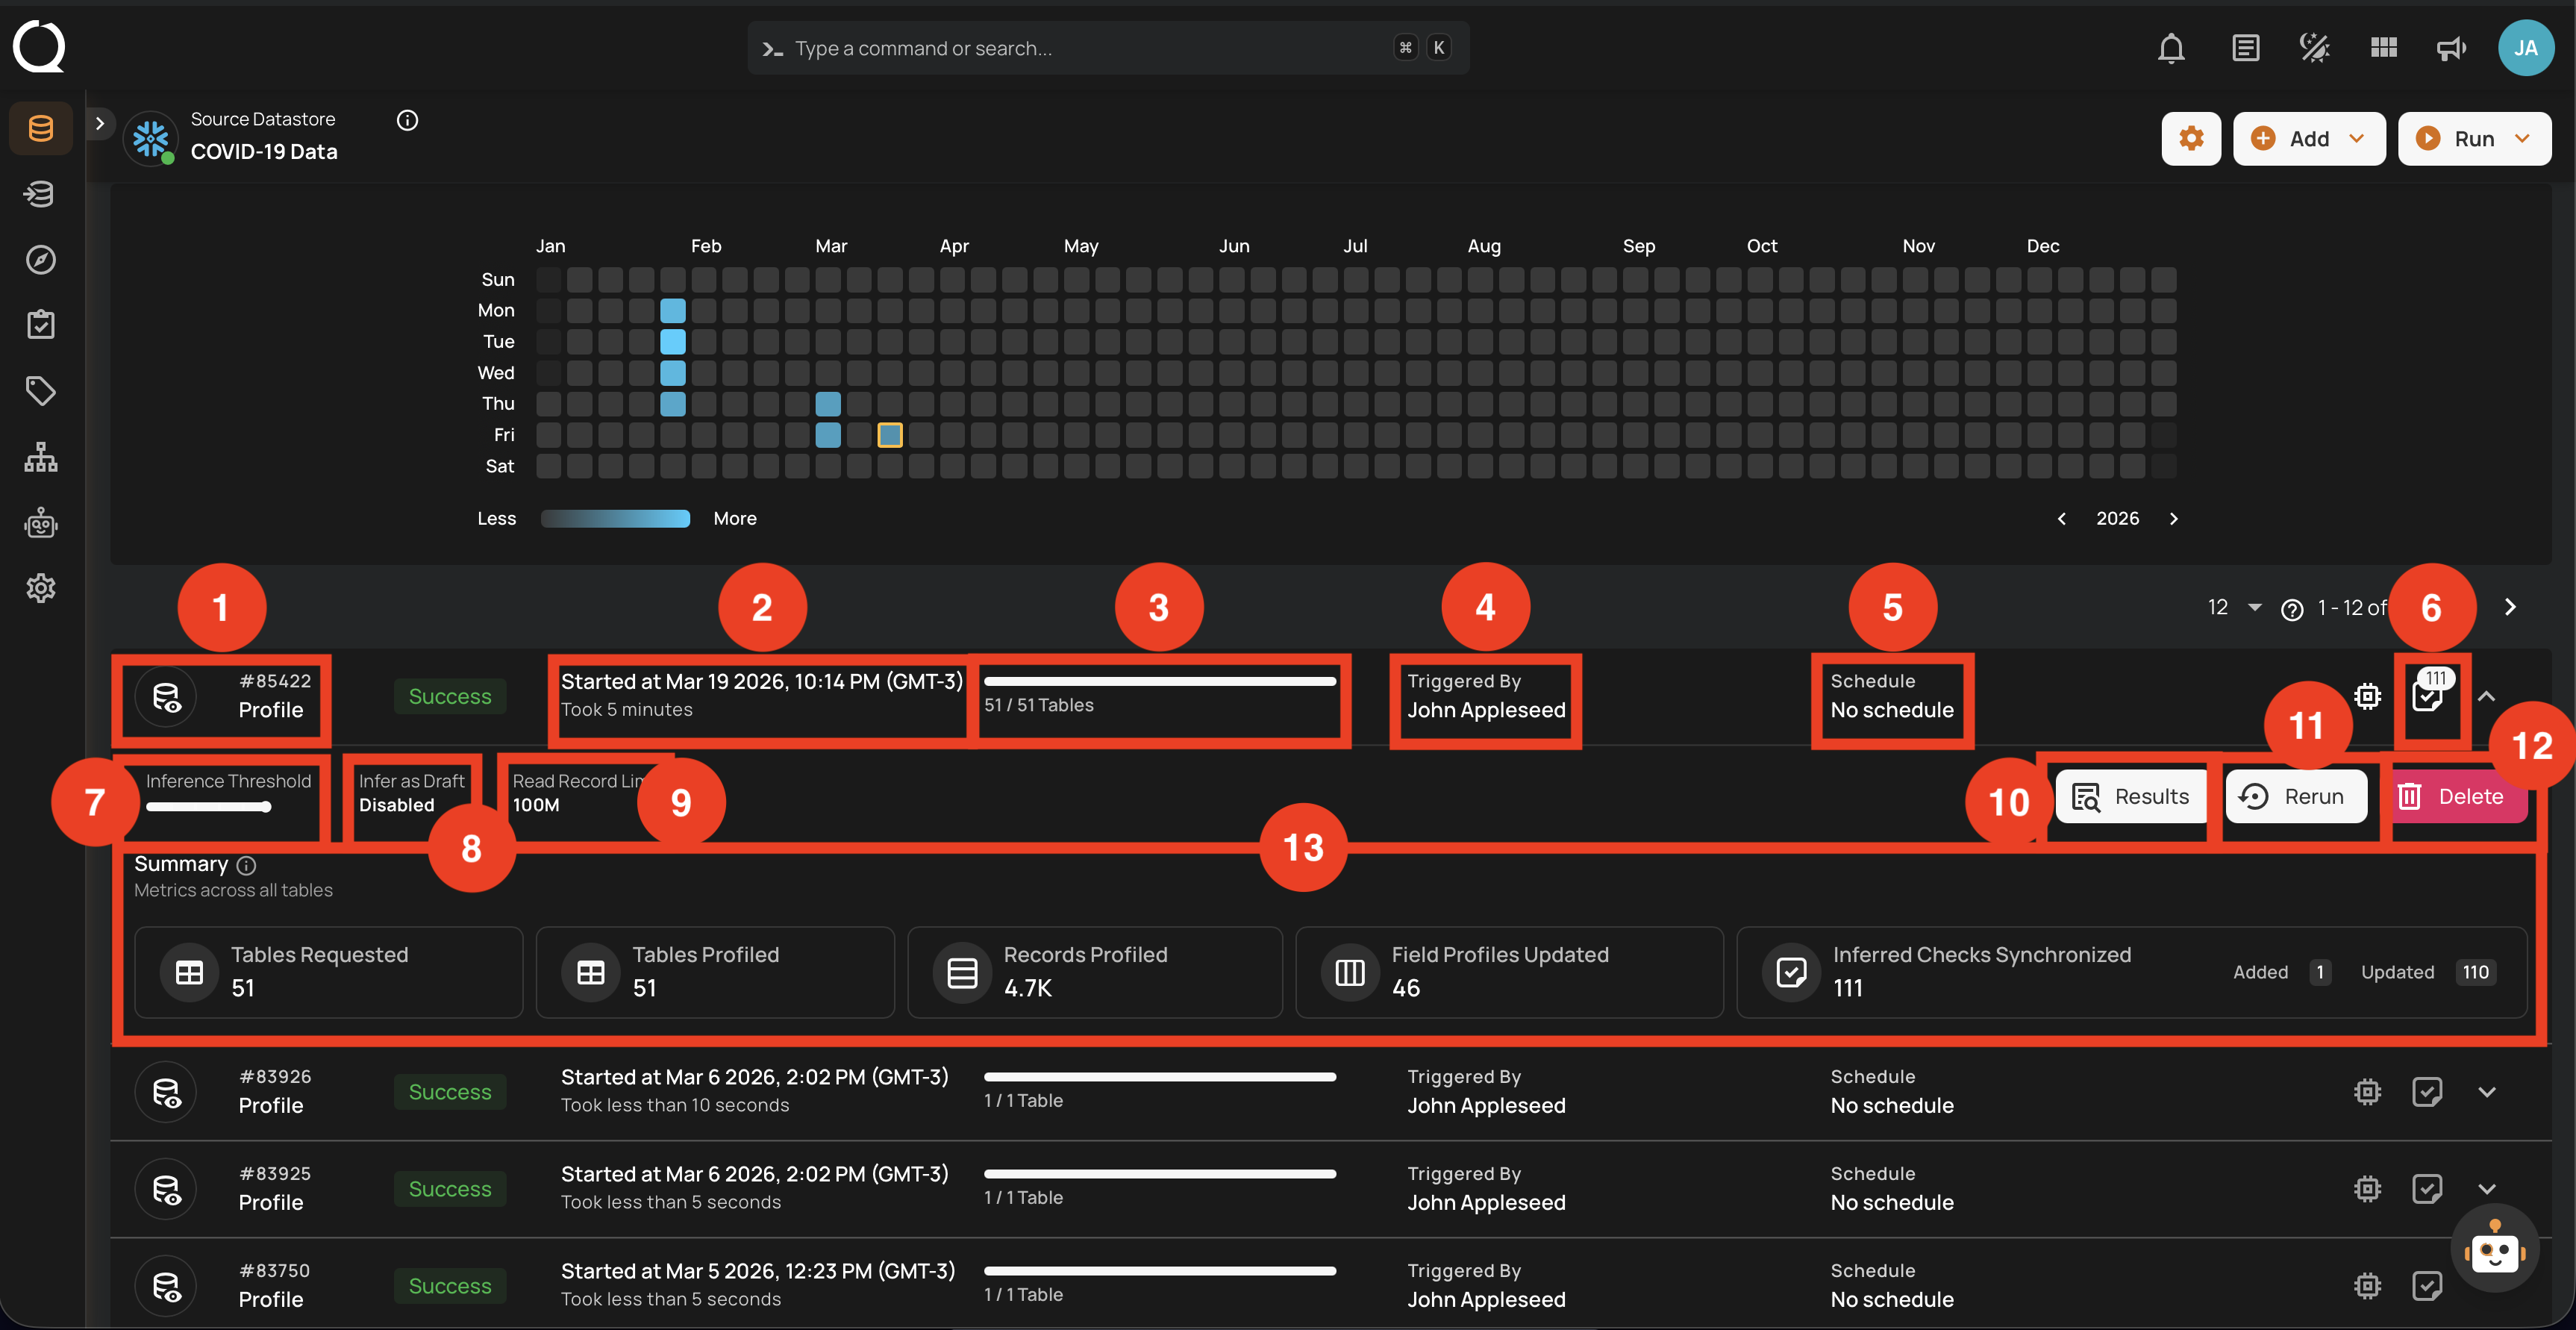
Success
This status confirms that the profile operation was completed successfully without any issues. A profile operation having a success status reflects the following details and actions:
| No. | Parameter | Interpretation |
|---|---|---|
| 1. | Operation ID & Operation Type | Unique identifier and type of operation performed (sync, profile, or scan). |
| 2. | Timestamp | Timestamp when the operation was started. |
| 3. | Progress Bar | The progress of the operation. |
| 4. | Triggered By | The author who triggered the operation. |
| 5. | Schedule | Whether the operation was scheduled or not. |
| 6. | Checks Synchronized | Indicates the count of Checks Synchronized in the operation. |
| 7. | AI Effort | The selected AI Effort level (Off, Low, Medium, High, Extra High, or Max) for AI Managed check authoring during the operation. |
| 8. | AI Authored Checks | Indicates whether AI Managed checks from this profile run were activated automatically (Activated) or created for review (Draft). |
| 9. | Read Record Limit | Defines the maximum number of records to be scanned per table after initial filtering. |
| 10. | Results | Provides immediate insights into the profile operation conducted. |
| 11. | Rerun | Allows you to start a new profile operation using the same settings as the warning scan, useful for restarting after errors. |
| 12. | Delete | Removes the record of the profile operation from the system, permanently deleting all results; this action cannot be undone. |
| 13. | Summary | The "Summary" section provides a real-time overview of the profile operation's progress. It includes key metrics such as:
|
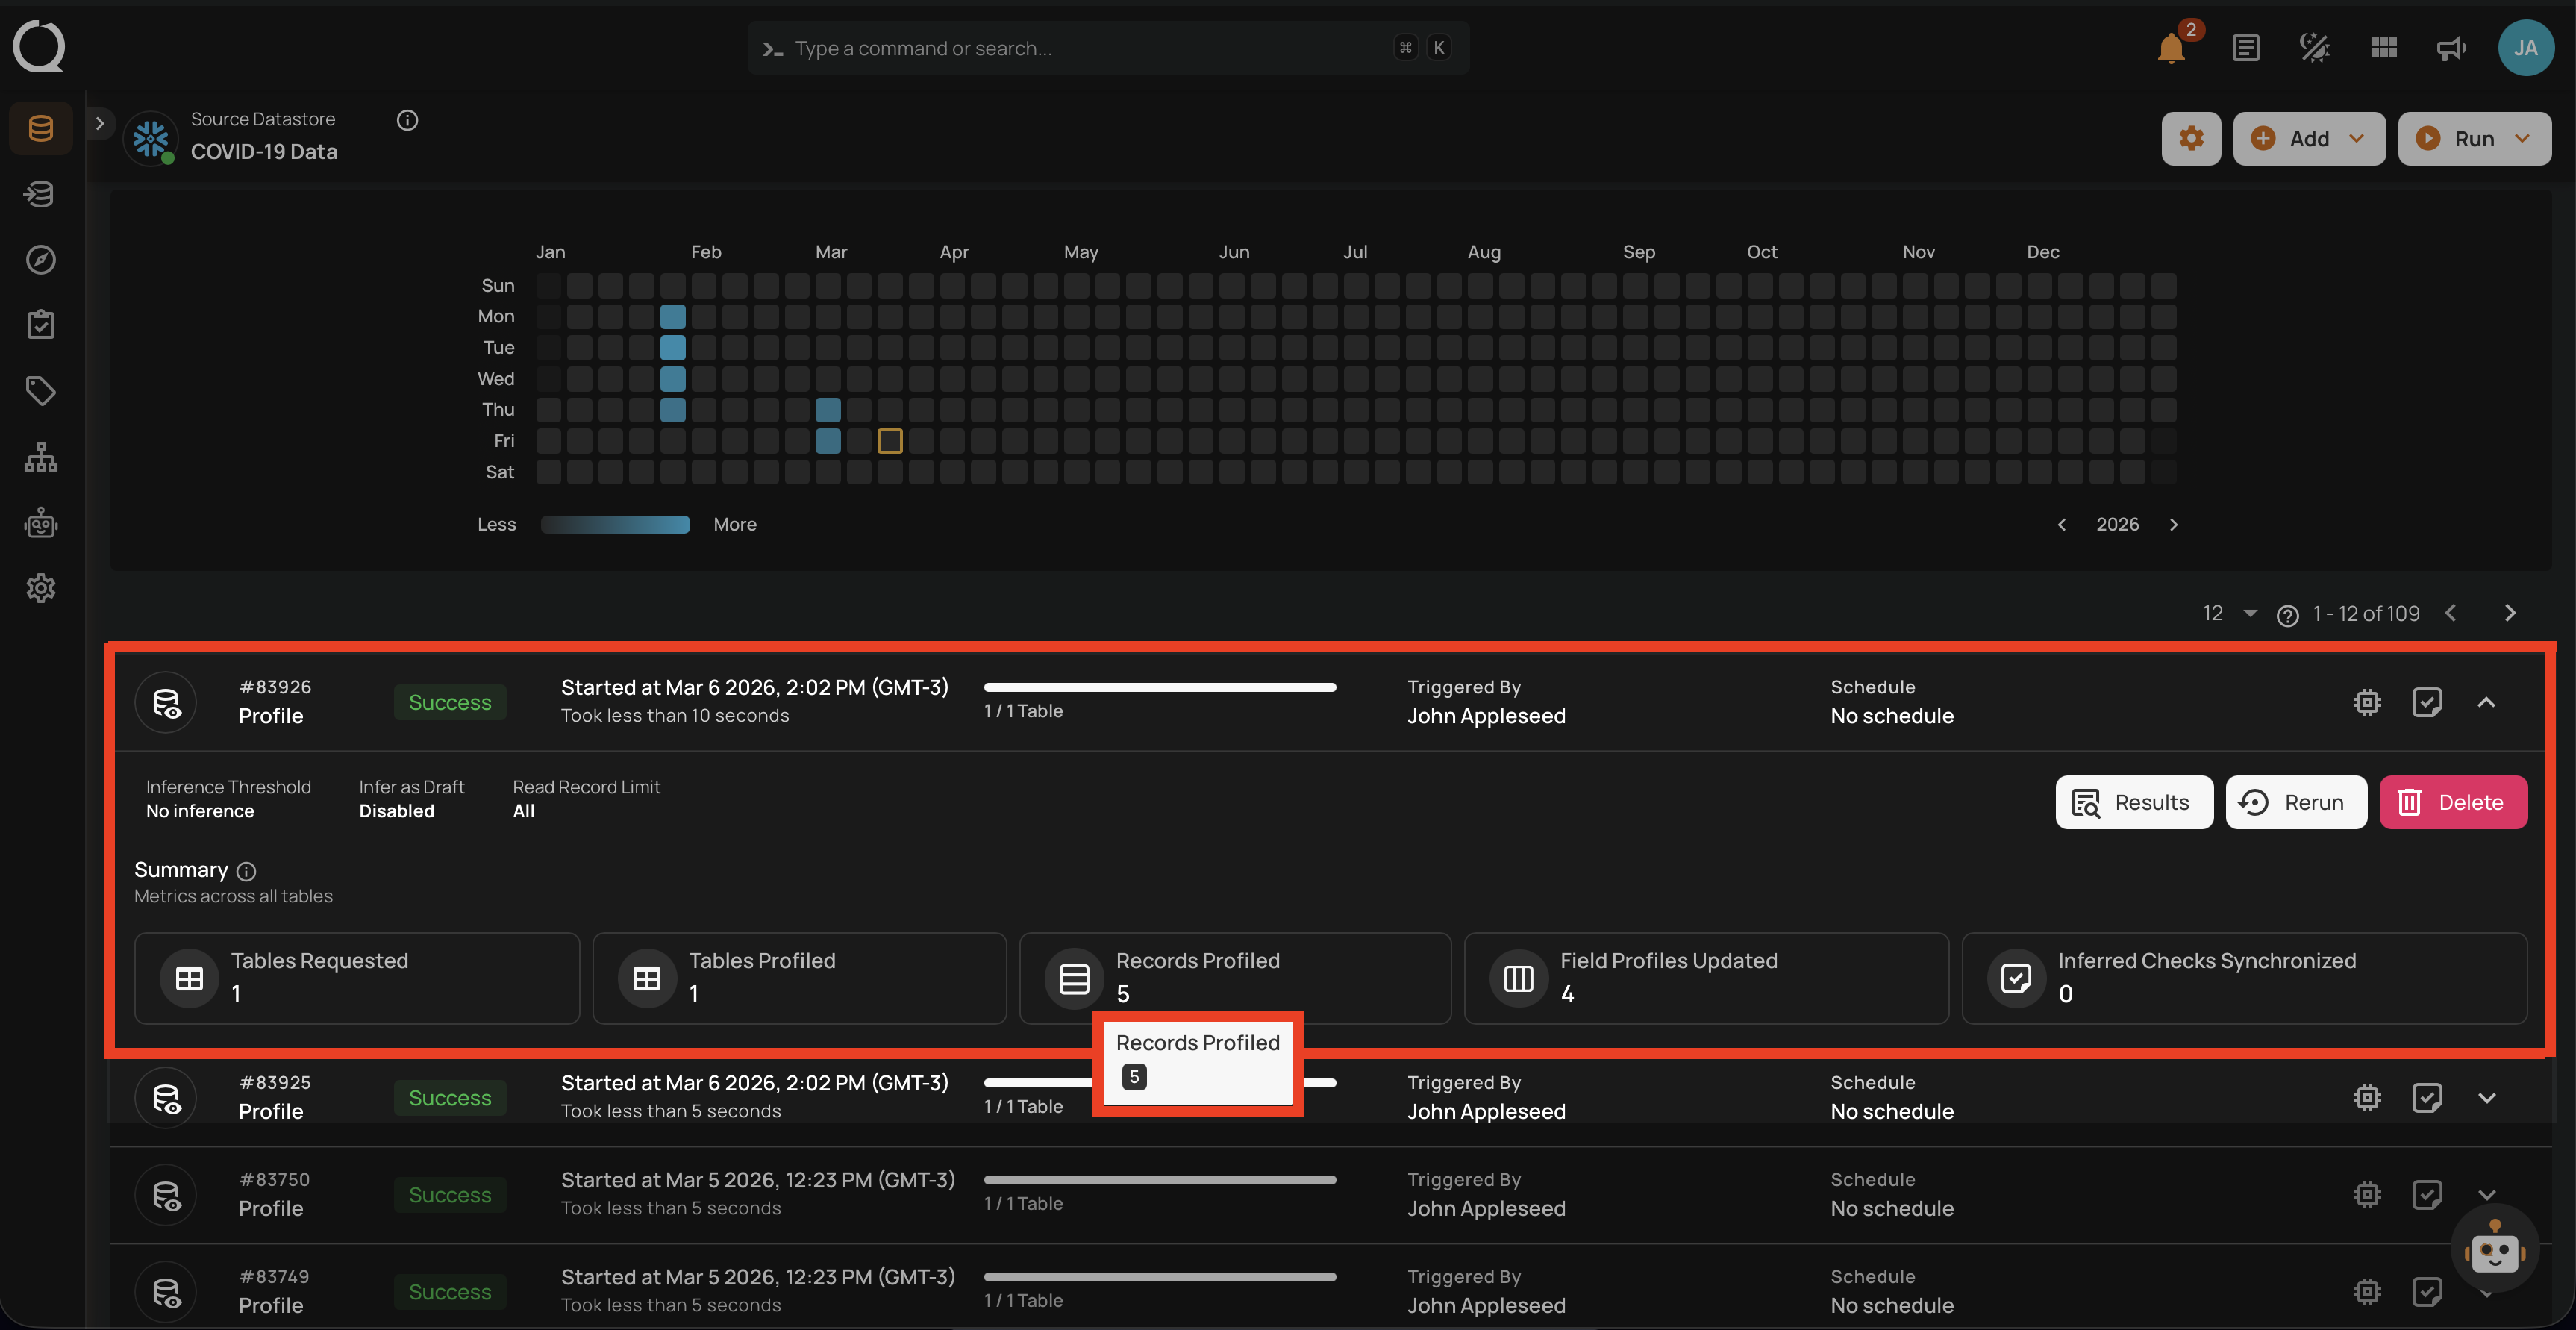
Full View of Metrics in Operation Summary
Users can now hover over abbreviated metrics to see the full value for better clarity. For demonstration purposes, we are hovering over the Records Profiled field to display the full value.
Post Operation Details
Step 1: Click on any of the successful Profile Operations from the list and hit the Results button.
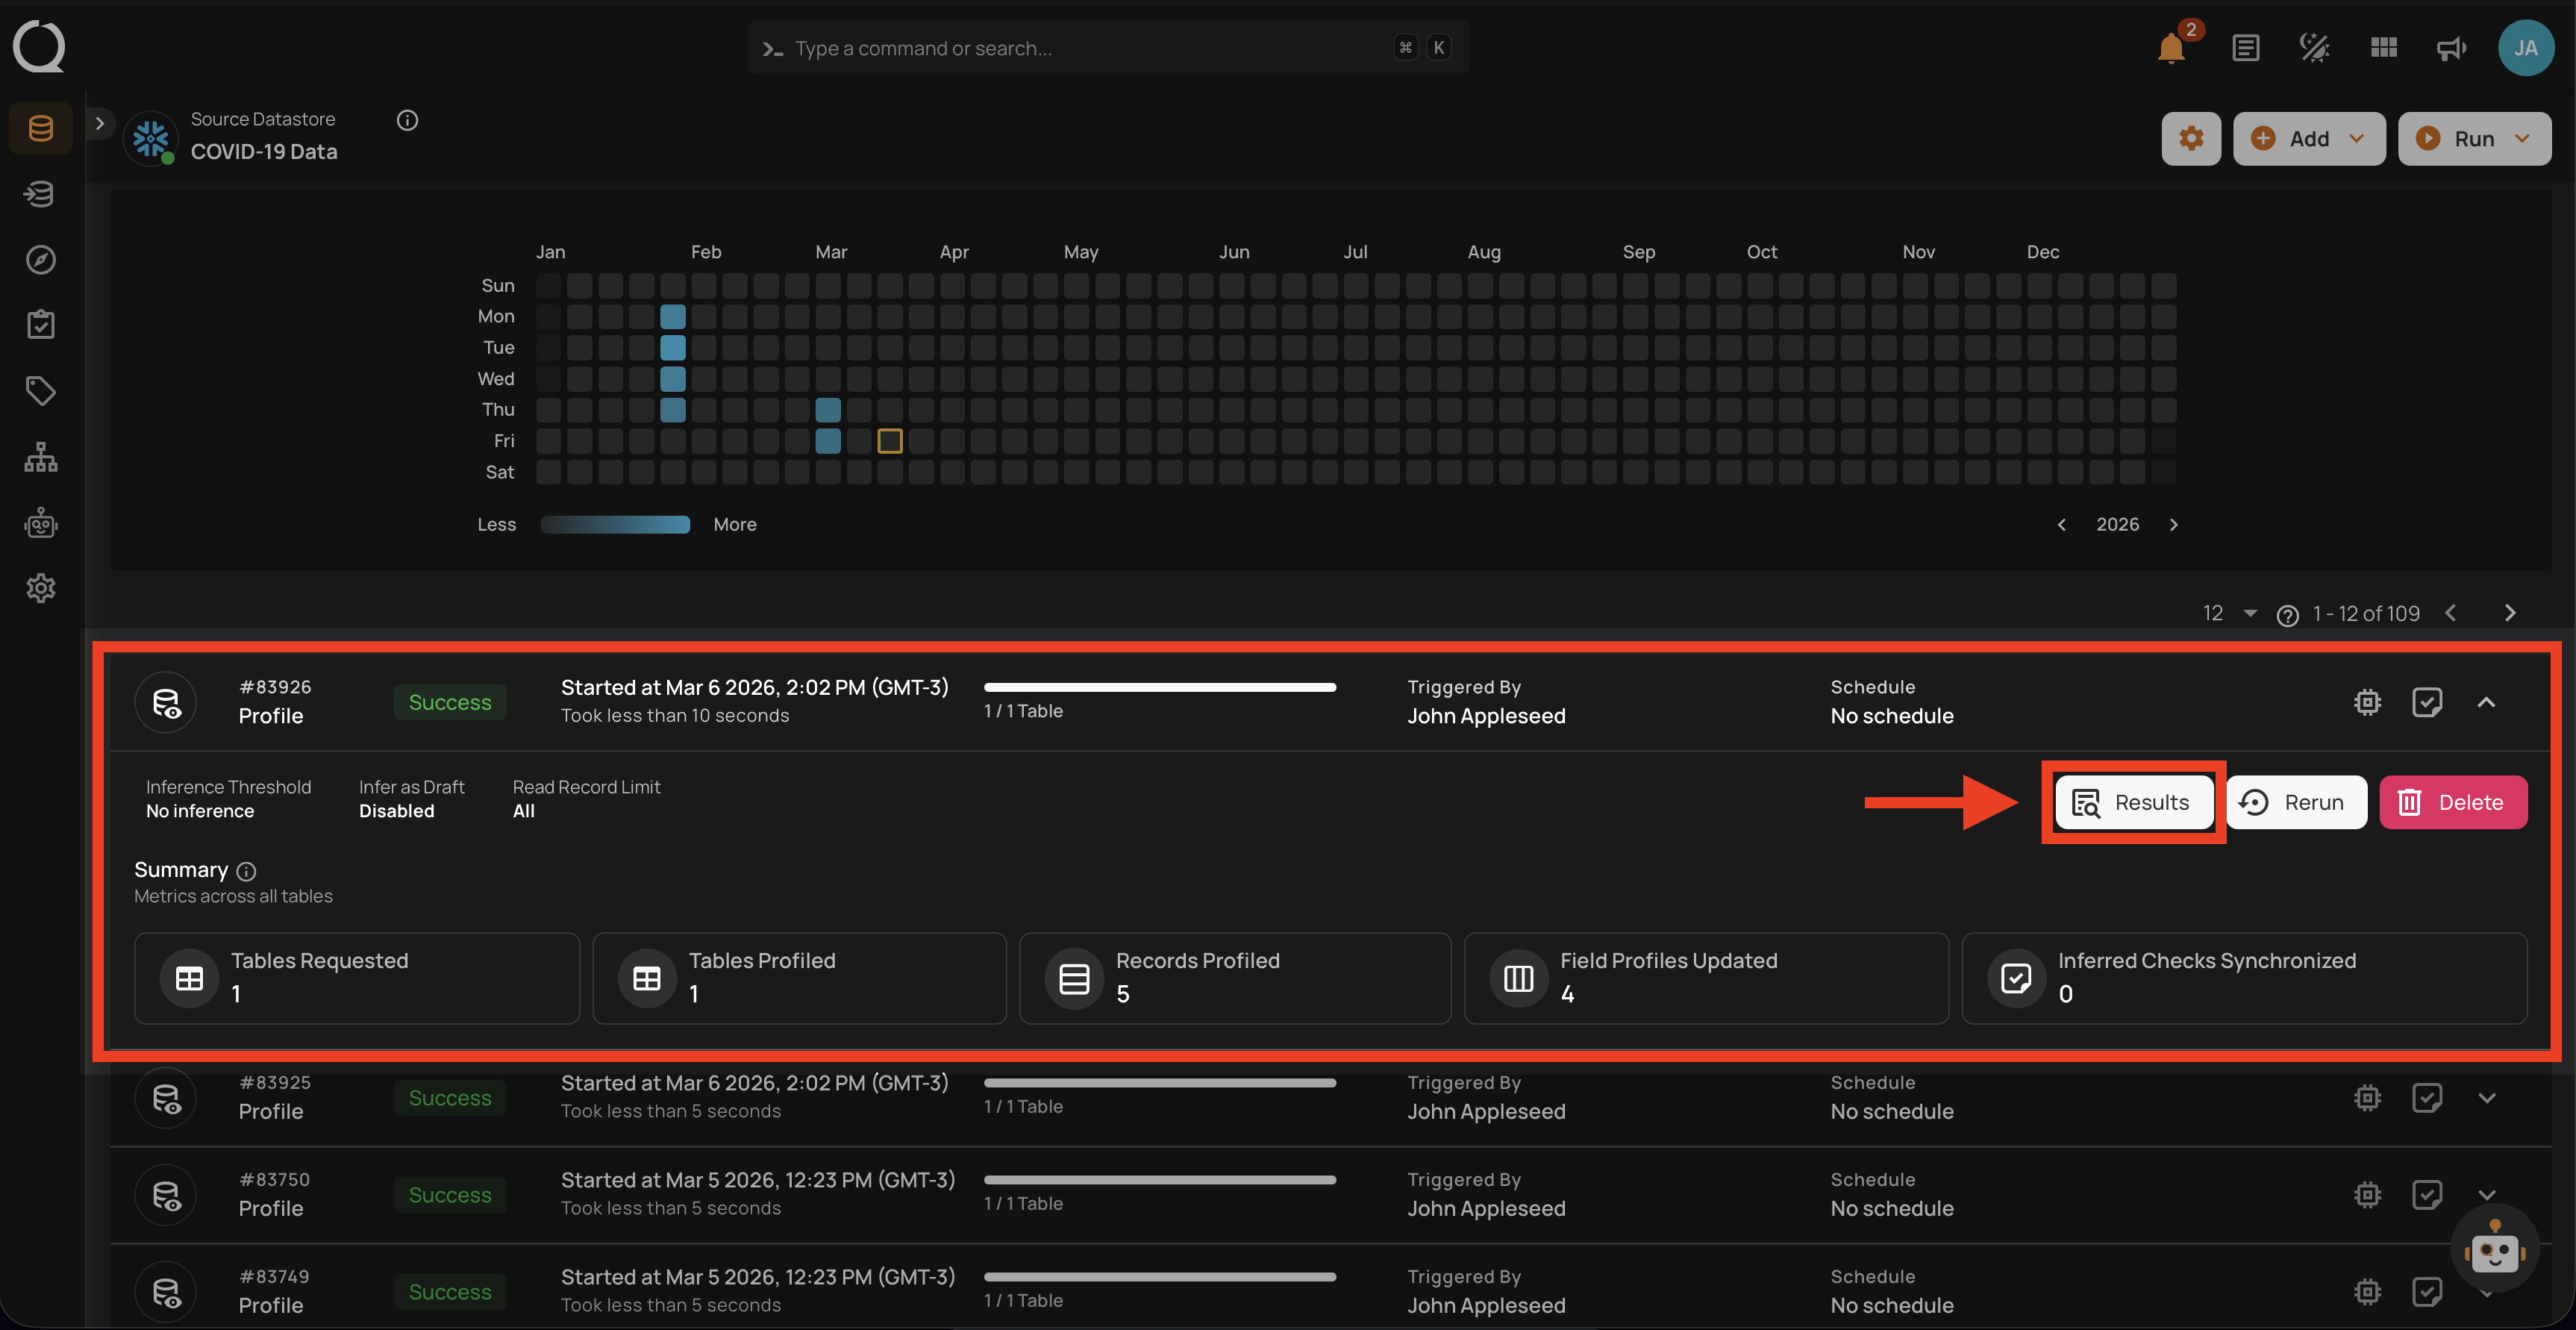
Step 2: The Profile Results modal displays a list of both profiled and non-profiled containers. You can filter the view to show only non-profiled containers by toggling on button, which will display the complete list of unprofiled containers.
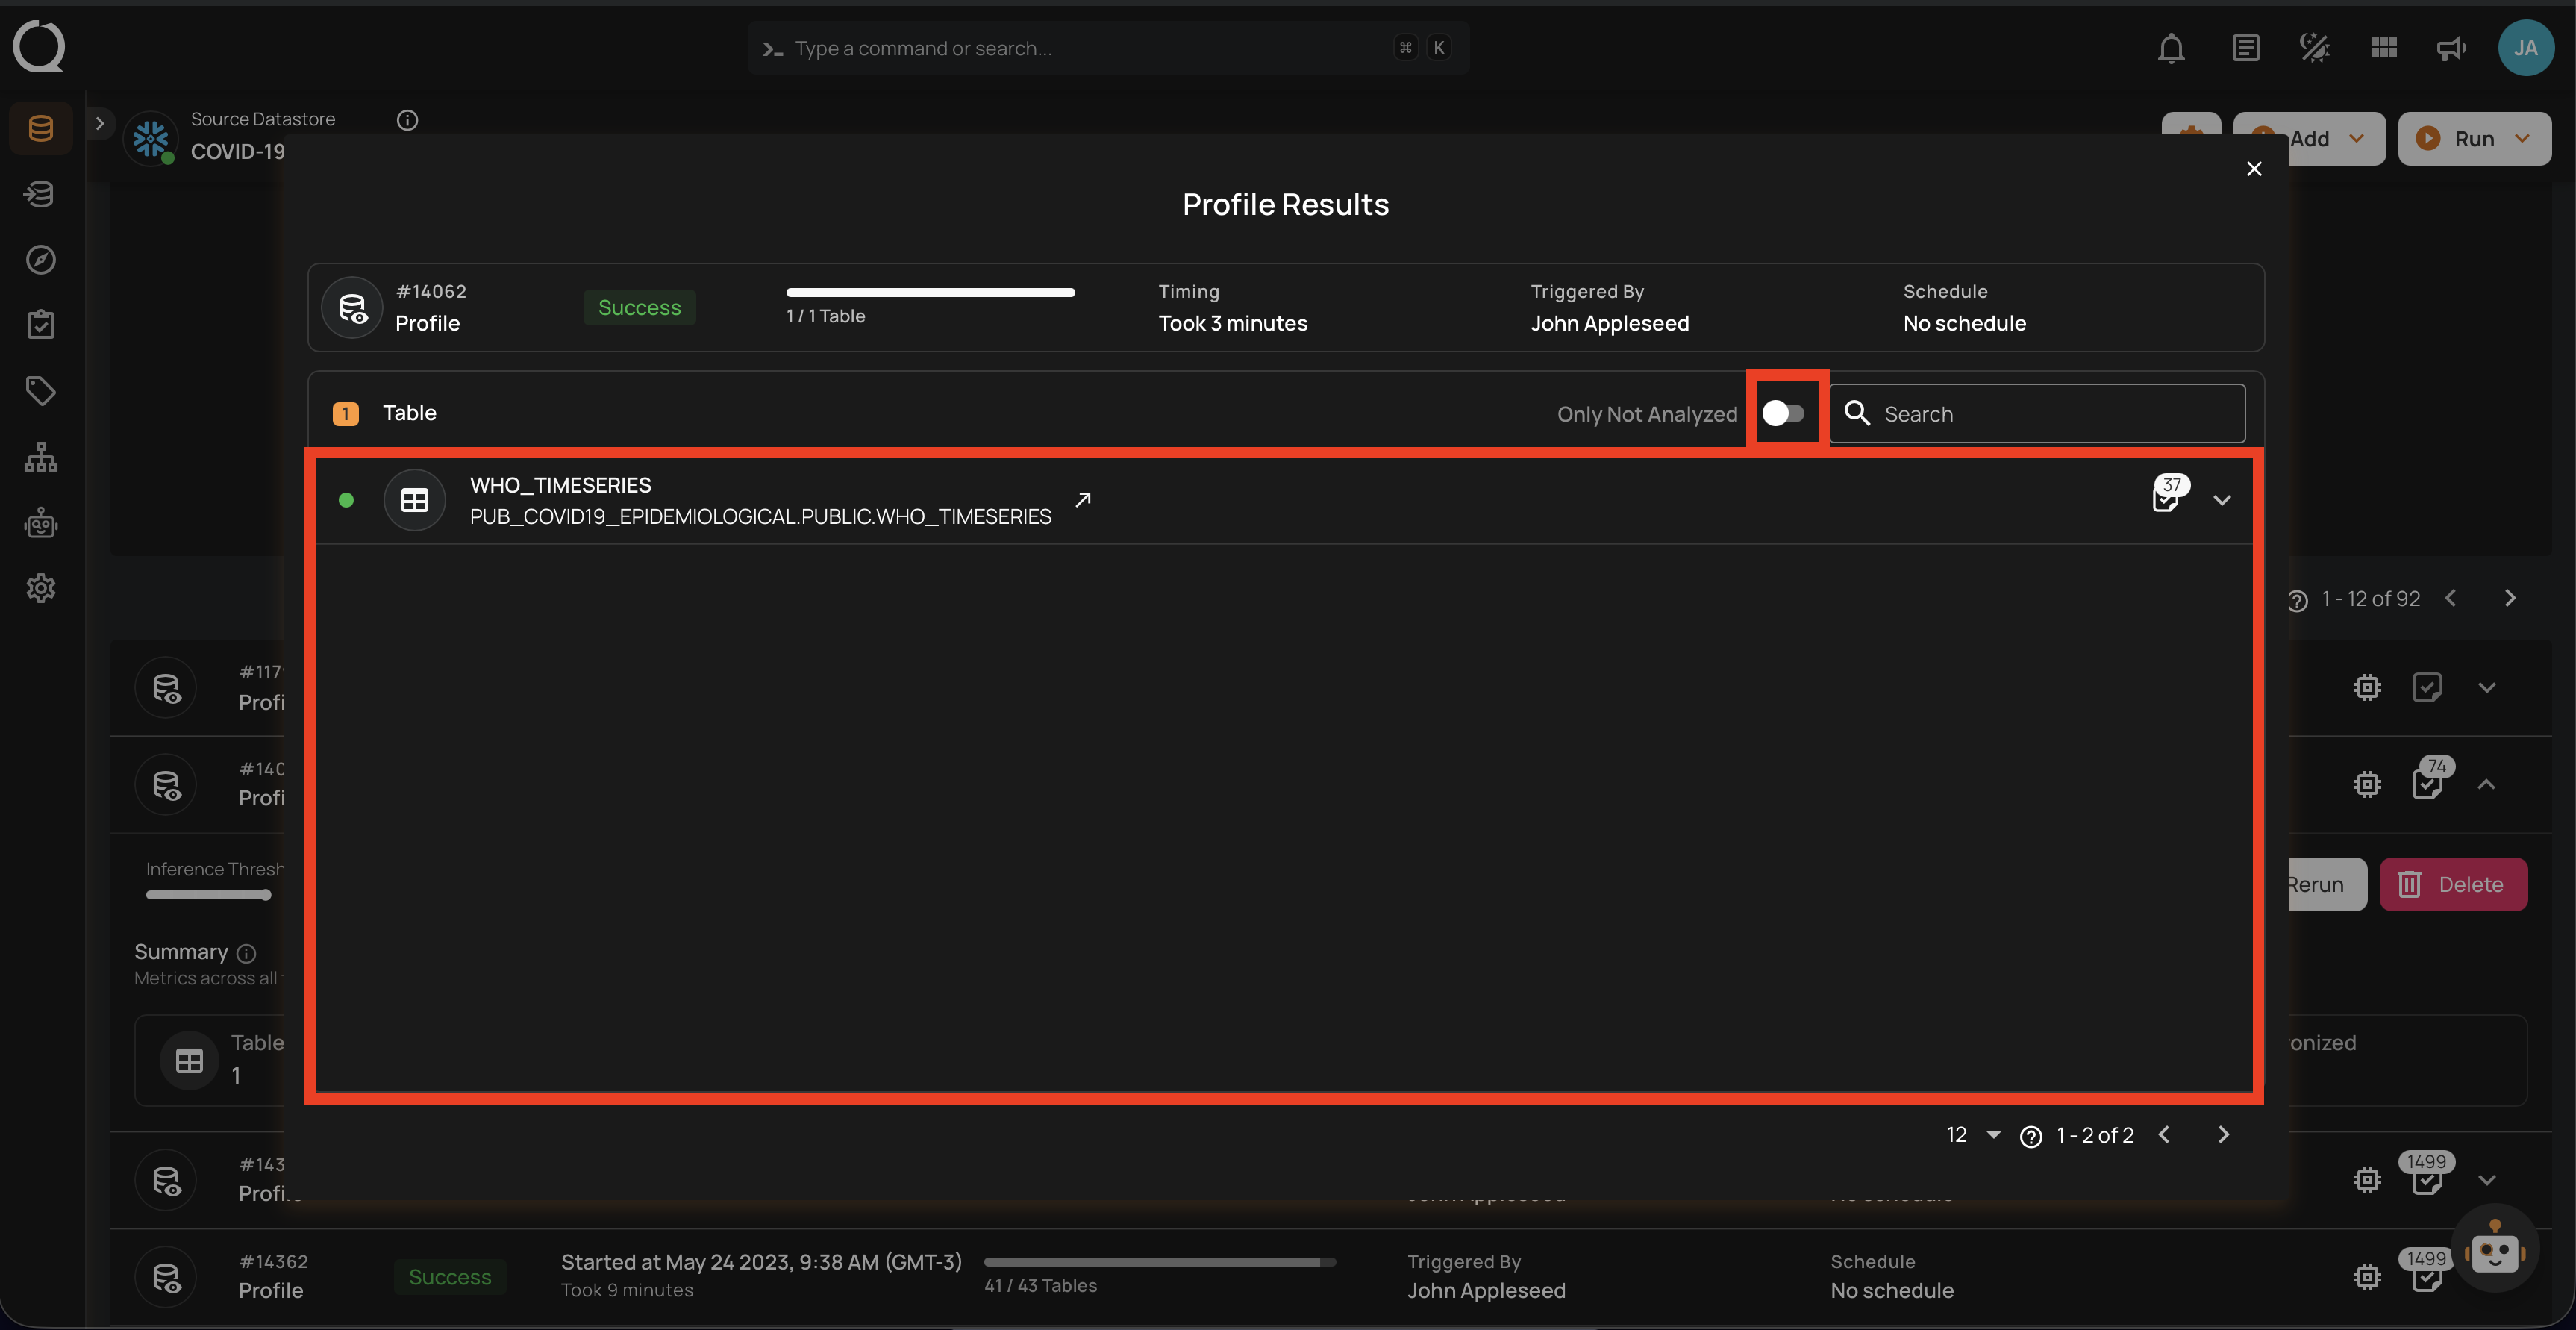
The Profile Results modal also provides two analysis options for you:
- Details for a Specific Container (Container's Profile)
- Details for a Specific Field of a Container (Field Profile)
Unwrap any of the containers from the Profile Results modal and click on the arrow icon.
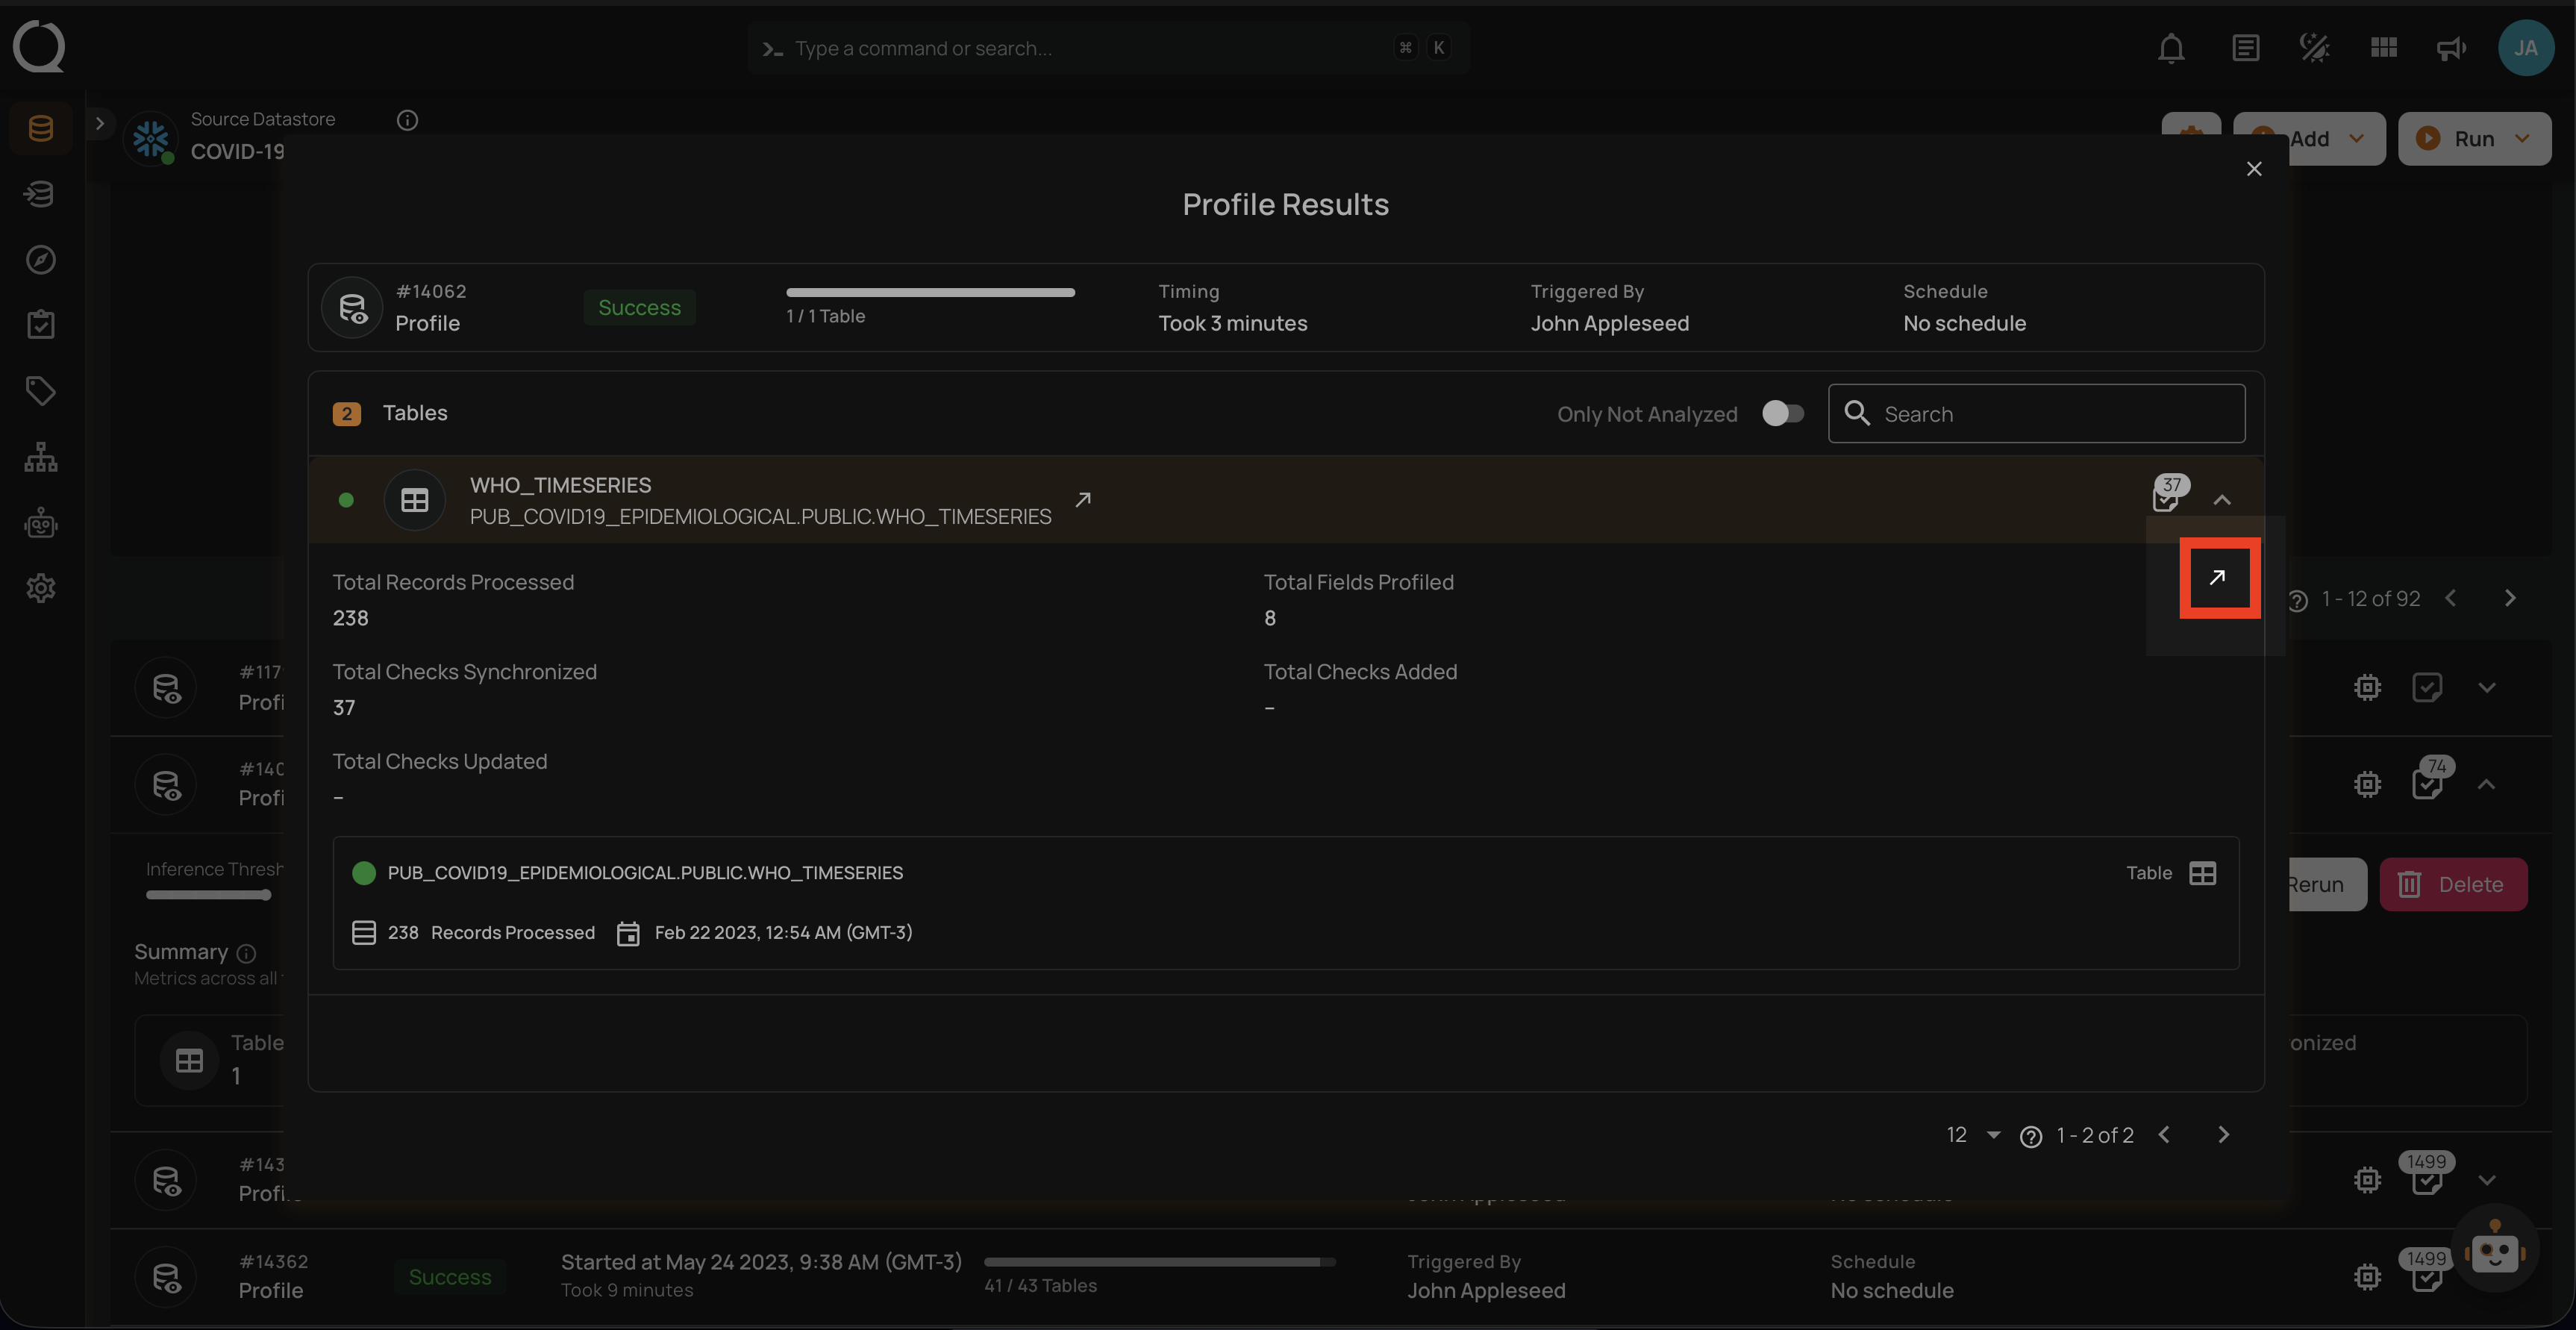
For detailed information about container quality metrics, observability charts, and profiling history, see Container Attributes. For field-level profile statistics such as distinct values, mean, median, and distribution metrics, see Field Profiles.
API Payload Examples
This section provides payload examples for initiating and checking the running status of a profile operation. Replace the placeholder values with data specific to your setup.
Running a Profile Operation
To run a profile operation, use the API payload example below and replace the placeholder values with your specific values:
Endpoint (Post): /api/operations/run (post)
The profile request accepts the following AI-related fields:
ai_effort(string) — Controls how much work AI puts into authoring checks. Accepted values:"off","low","medium","high","xhigh","max".infer_as_draft(boolean) — Whentrue, AI Managed checks are created in Draft state for review. Whenfalse(or omitted), AI Managed checks are activated automatically.
Legacy inference_threshold field
The legacy integer field inference_threshold (range 0–5) is still accepted for backward compatibility and is automatically mapped to the equivalent ai_effort value (0 → "off", 1 → "low", 2 → "medium", 3 → "high", 4 → "xhigh", 5 → "max"). Values outside 0–5 are rejected. New integrations should use ai_effort directly. If both fields are provided, ai_effort takes precedence.
Option I: Running a profile operation of all containers
-
container_names: []: This setting indicates that profiling will encompass all containers. -
max_records_analyzed_per_partition: null: This setting implies that all records within all containers will be profiled. -
ai_effort: "max": AI will generate checks across every supported family (equivalent to the legacyinference_threshold: 5).
{
    "type": "profile",
    "datastore_id": "datastore-id",
    "container_names": [],
    "max_records_analyzed_per_partition": null,
    "ai_effort": "max",
    "infer_as_draft": false
}
Option II: Running a profile operation of specific containers
-
container_names: ["table_name_1", "table_name_2"]: Profiling will only cover the tables namedtable_name_1andtable_name_2. -
max_records_analyzed_per_partition: 1000000: Up to 1 million rows per container will be profiled. -
ai_effort: "off": AI will not generate any checks for this run (equivalent to the legacyinference_threshold: 0).
{
    "type": "profile",
    "datastore_id": "datastore-id",
    "container_names": [
        "table_name_1",
        "table_name_2"
    ],
    "max_records_analyzed_per_partition": 1000000,
    "ai_effort": "off"
}
Scheduling a Profile Operation
Below is a sample payload for scheduling a profile operation. Please substitute the placeholder values with the appropriate data relevant to your setup.
Endpoint (Post): /api/operations/schedule (post)
INFO: This payload is to run a scheduled profile operation every day at 00:00.
Partial schedule updates preserve ai_effort
On partial updates to an existing profile schedule (PATCH), ai_effort is preserved if you do not include it in the payload — the previously stored value is kept. Send an explicit ai_effort value when you want to change the AI Effort level for the schedule.
Scheduling profile operation of all containers
{
    "type": "profile",
    "name": "My scheduled Profile operation",
    "datastore_id": "datastore-id",
    "container_names": [],
    "max_records_analyzed_per_partition": null,
    "ai_effort": "max",
    "infer_as_draft": false,
    "crontab": "0 0 * * *"
}
Retrieving Profile Operation Status
To retrieve the profile operation status, use the API payload example below and replace the placeholder values with your specific values:
Endpoint (Get): /api/operations/{id} (get)
{
    "items": [
        {
            "id": 12345,
            "created": "YYYY-MM-DDTHH:MM:SS.ssssssZ",
            "type": "profile",
            "start_time": "YYYY-MM-DDTHH:MM:SS.ssssssZ",
            "end_time": "YYYY-MM-DDTHH:MM:SS.ssssssZ",
            "result": "success",
            "message": null,
            "triggered_by": "user@example.com",
            "datastore": {
                "id": 101,
                "name": "Sample-Store",
                "store_type": "jdbc",
                "type": "db_type",
                "enrich_only": false,
                "enrich_container_prefix": "data_prefix",
                "favorite": false
            },
            "schedule": null,
            "ai_effort": "max",
            "max_records_analyzed_per_partition": -1,
            "max_count_testing_sample": 100000,
            "histogram_max_distinct_values": 100,
            "greater_than_time": null,
            "greater_than_batch": null,
            "percent_testing_threshold": 0.4,
            "high_correlation_threshold": 0.5,
            "status": {
                "total_containers": 2,
                "containers_analyzed": 2,
                "partitions_analyzed": 2,
                "records_processed": 1126,
                "fields_profiled": 9,
                "checks_synchronized": 26
            },
            "containers": [
                {
                    "id": 123,
                    "name": "Container1",
                    "container_type": "table",
                    "table_type": "table"
                },
                {
                    "id": 456,
                    "name": "Container2",
                    "container_type": "table",
                    "table_type": "table"
                }
            ],
            "container_profiles": [
                {
                    "id": 789,
                    "created": "YYYY-MM-DDTHH:MM:SS.ssssssZ",
                    "parent_profile_id": null,
                    "container": {
                        "id": 456,
                        "name": "Container2",
                        "container_type": "table",
                        "table_type": "table"
                    },
                    "records_count": 550,
                    "records_processed": 550,
                    "checks_synchronized": 11,
                    "field_profiles_count": 4,
                    "result": "success",
                    "message": null
                },
                {
                    "id": 790,
                    "created": "YYYY-MM-DDTHH:MM:SS.ssssssZ",
                    "parent_profile_id": null,
                    "container": {
                        "id": 123,
                        "name": "Container1",
                        "container_type": "table",
                        "table_type": "table"
                    },
                    "records_count": 576,
                    "records_processed": 576,
                    "checks_synchronized": 15,
                    "field_profiles_count": 5,
                    "result": "success",
                    "message": null
                }
            ],
            "tags": []
        }
    ],
    "total": 1,
    "page": 1,
    "size": 50,
    "pages": 1
}
Troubleshooting
Unloadable Container Error
A profile operation may surface the following error for specific containers:
Container '<CONTAINER_NAME>' is marked as Unloadable. No attempt was made to load the container due to multiple consecutive failures in prior operations.
This happens after a container has failed in 3 consecutive scan or profile operations. Qualytics then skips it in subsequent profiles, scans, and check validations until the status is cleared.
- For tables, views, and file patterns, run a Sync Operation on the datastore to reset the status.
- For computed assets (Computed Tables, Computed Files, Computed Joins), force an edit on the asset (click Edit), then click Validate and Save to re-evaluate the definition.
See Unloadable Container Error for the full resolution steps and common root causes.