Scan: Running
Running operations are still in progress. The Status badge shows Running in orange, the Duration shows elapsed time, and the Progress bar shows how many containers have been processed so far. The expanded row reveals an Abort button that lets you stop the operation before it completes. Action buttons available: Results, Abort (replaces Delete while the operation is in flight).
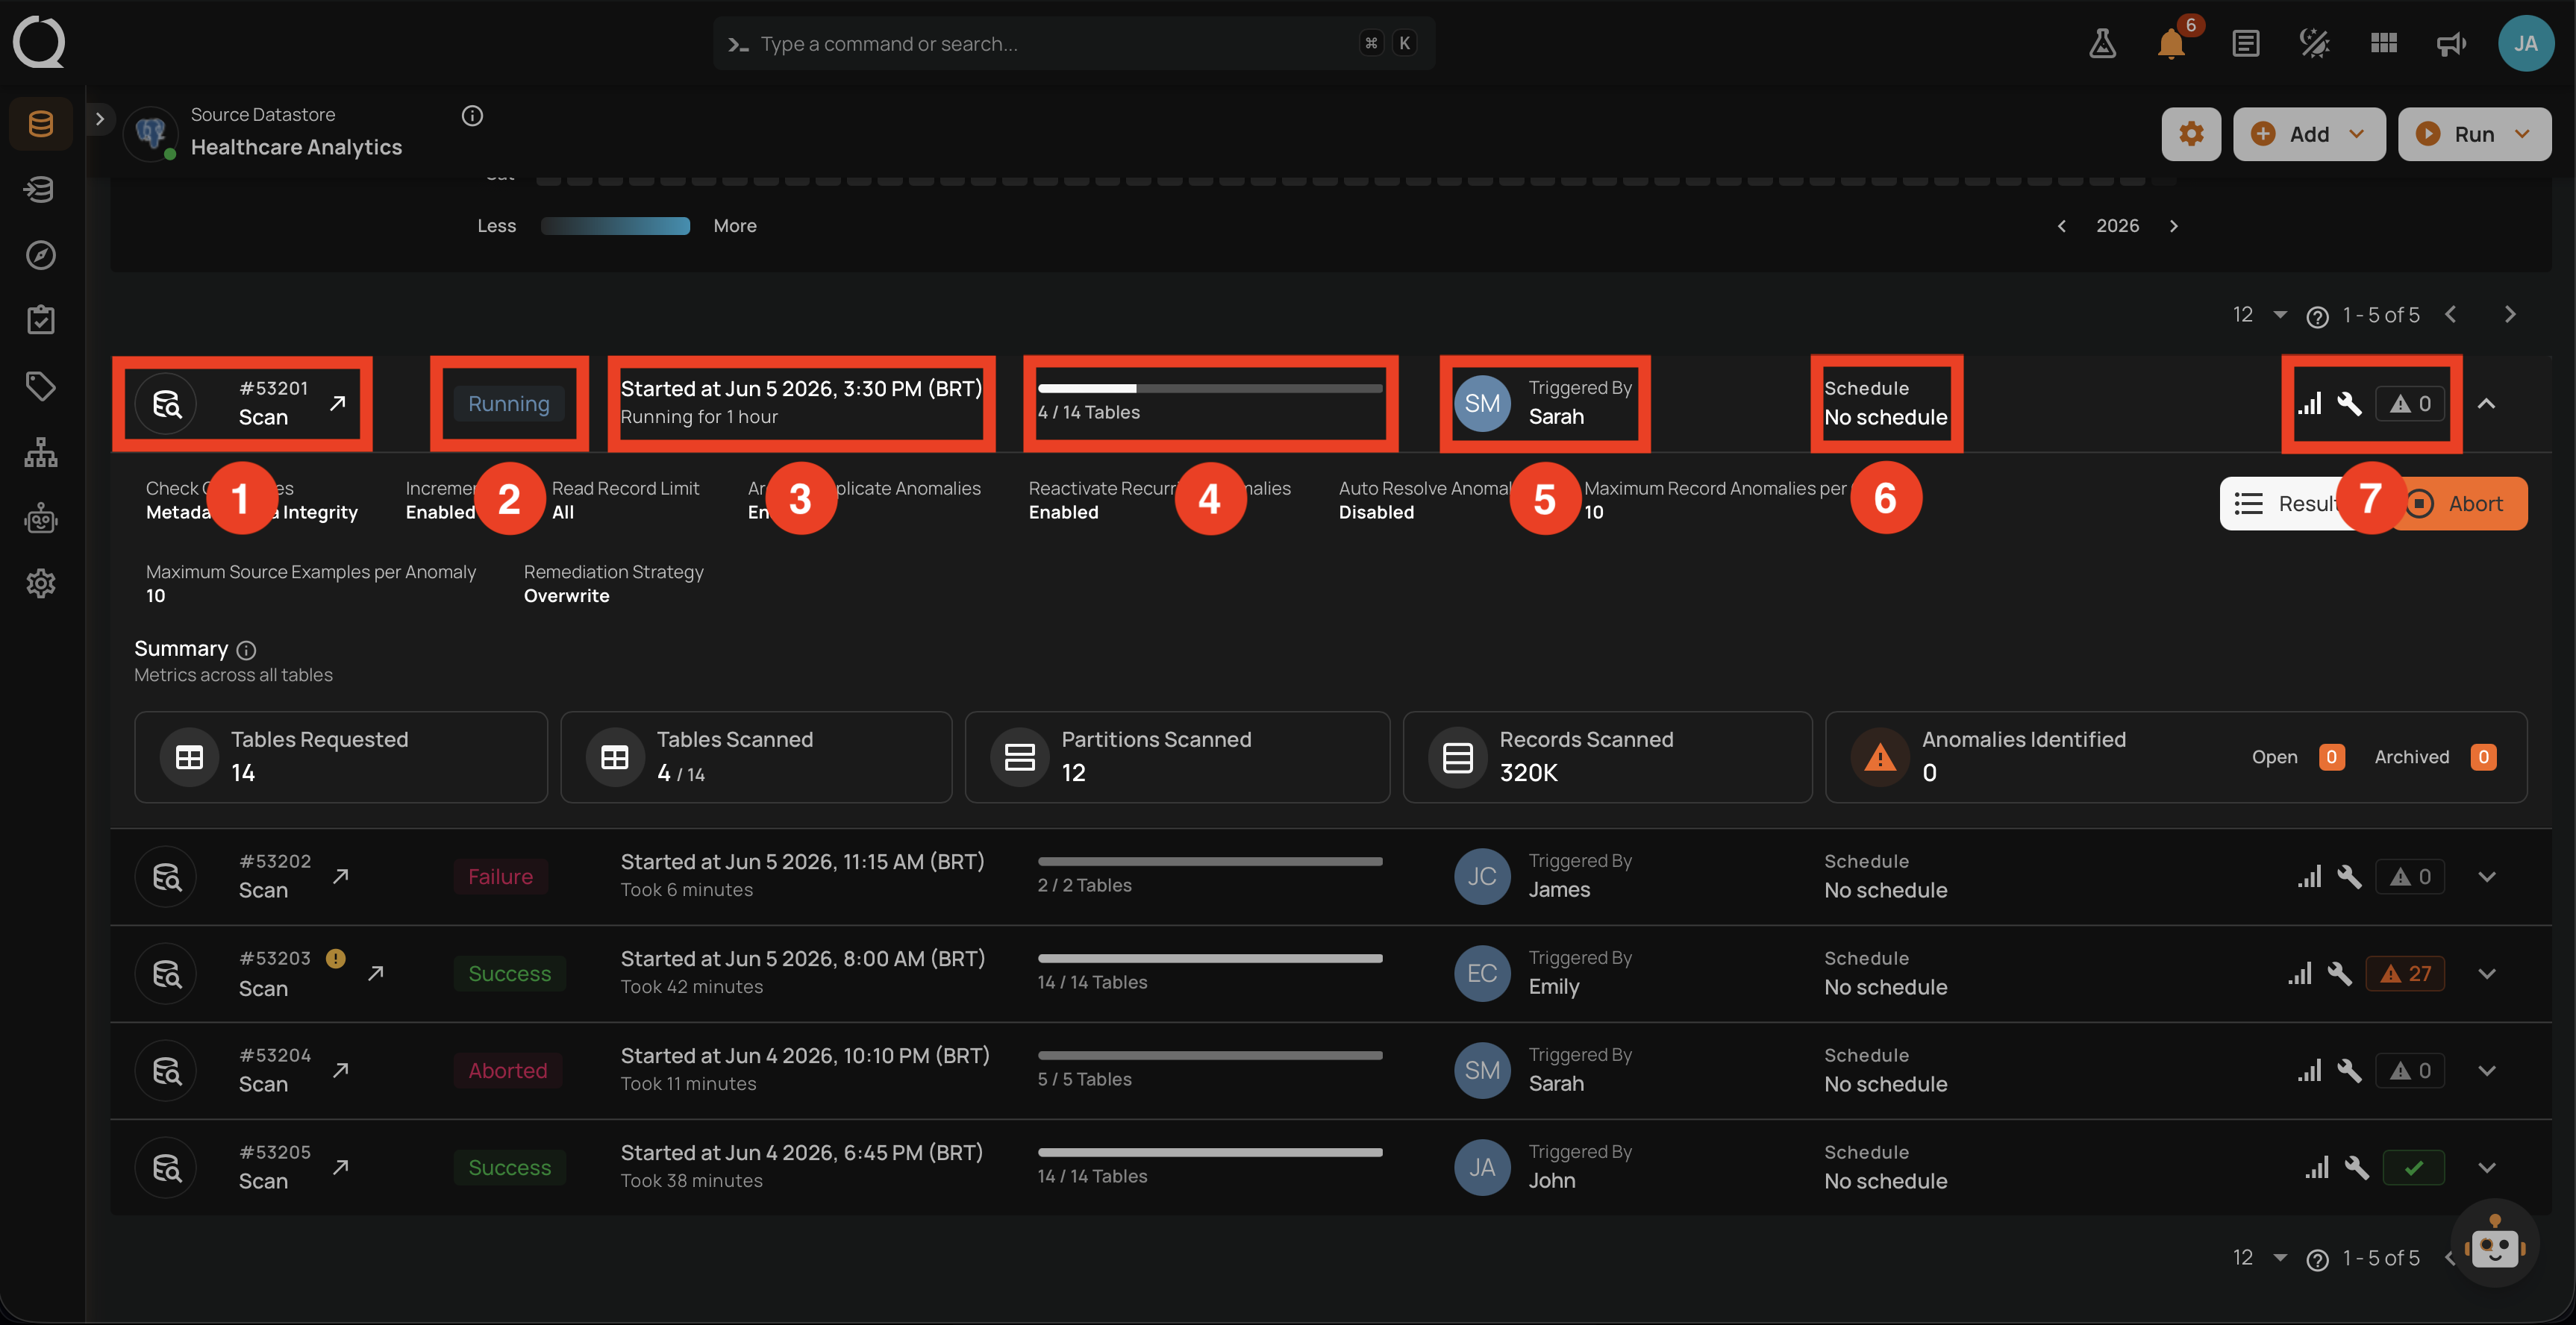
Expanded row in the operations list
Header of the operation
| No. | Element | What it shows |
|---|---|---|
| 1 | Operation ID and type | The unique identifier (for example #53201) and the operation type (Scan). The icon next to the ID links to the dedicated Overview of the operation. |
| 2 | Status badge | The orange Running badge indicating the operation is still in progress. |
| 3 | Time info | Started At (for example Started at Jun 5 2026, 3:30 PM (BRT)) and Duration (the elapsed time so far, for example Running for 1 hour). The Duration updates live as the operation continues. |
| 4 | Progress | Containers processed so far against the total requested (4 / 14 Tables). The bar updates live. |
| 5 | Triggered by | The user (avatar and name) who launched the operation. |
| 6 | Schedule | The named schedule if recurring, otherwise No schedule. |
| 7 | Quick stats icons | A cluster of small status icons on the right of the row. Each icon shows a tooltip on hover summarizing configuration and result counters at a glance. Anomaly counters update live as containers are processed. See the Right-side icons (No. 7) in detail breakdown below this table. Not the row action buttons. |
The orange Running badge confirms the operation is in flight: counters are updating live and the only terminal action available is Abort.
Right-side icons (No. 7) in detail
The scan-row cluster contains the following icons, left to right:
| Icon | Tooltip | Meaning |
|---|---|---|
| Incremental Field | Whether the scan is running in Incremental mode (filled when active) or Full (grey when the scan is Full). | |
| Remediation Strategy | The remediation strategy in effect for this run (filled when Append or Overwrite is set, grey when None). |
|
| / | Anomalies Identified | Anomalies detected so far during the run, with Open and Archived counts in the tooltip. Updates live as containers complete. |
| Anomalies Auto-Resolved | Anomalies the in-flight Full scan has already resolved automatically. Updates live; only appears on Full scans where Auto Resolve is enabled. |
Details of the operation
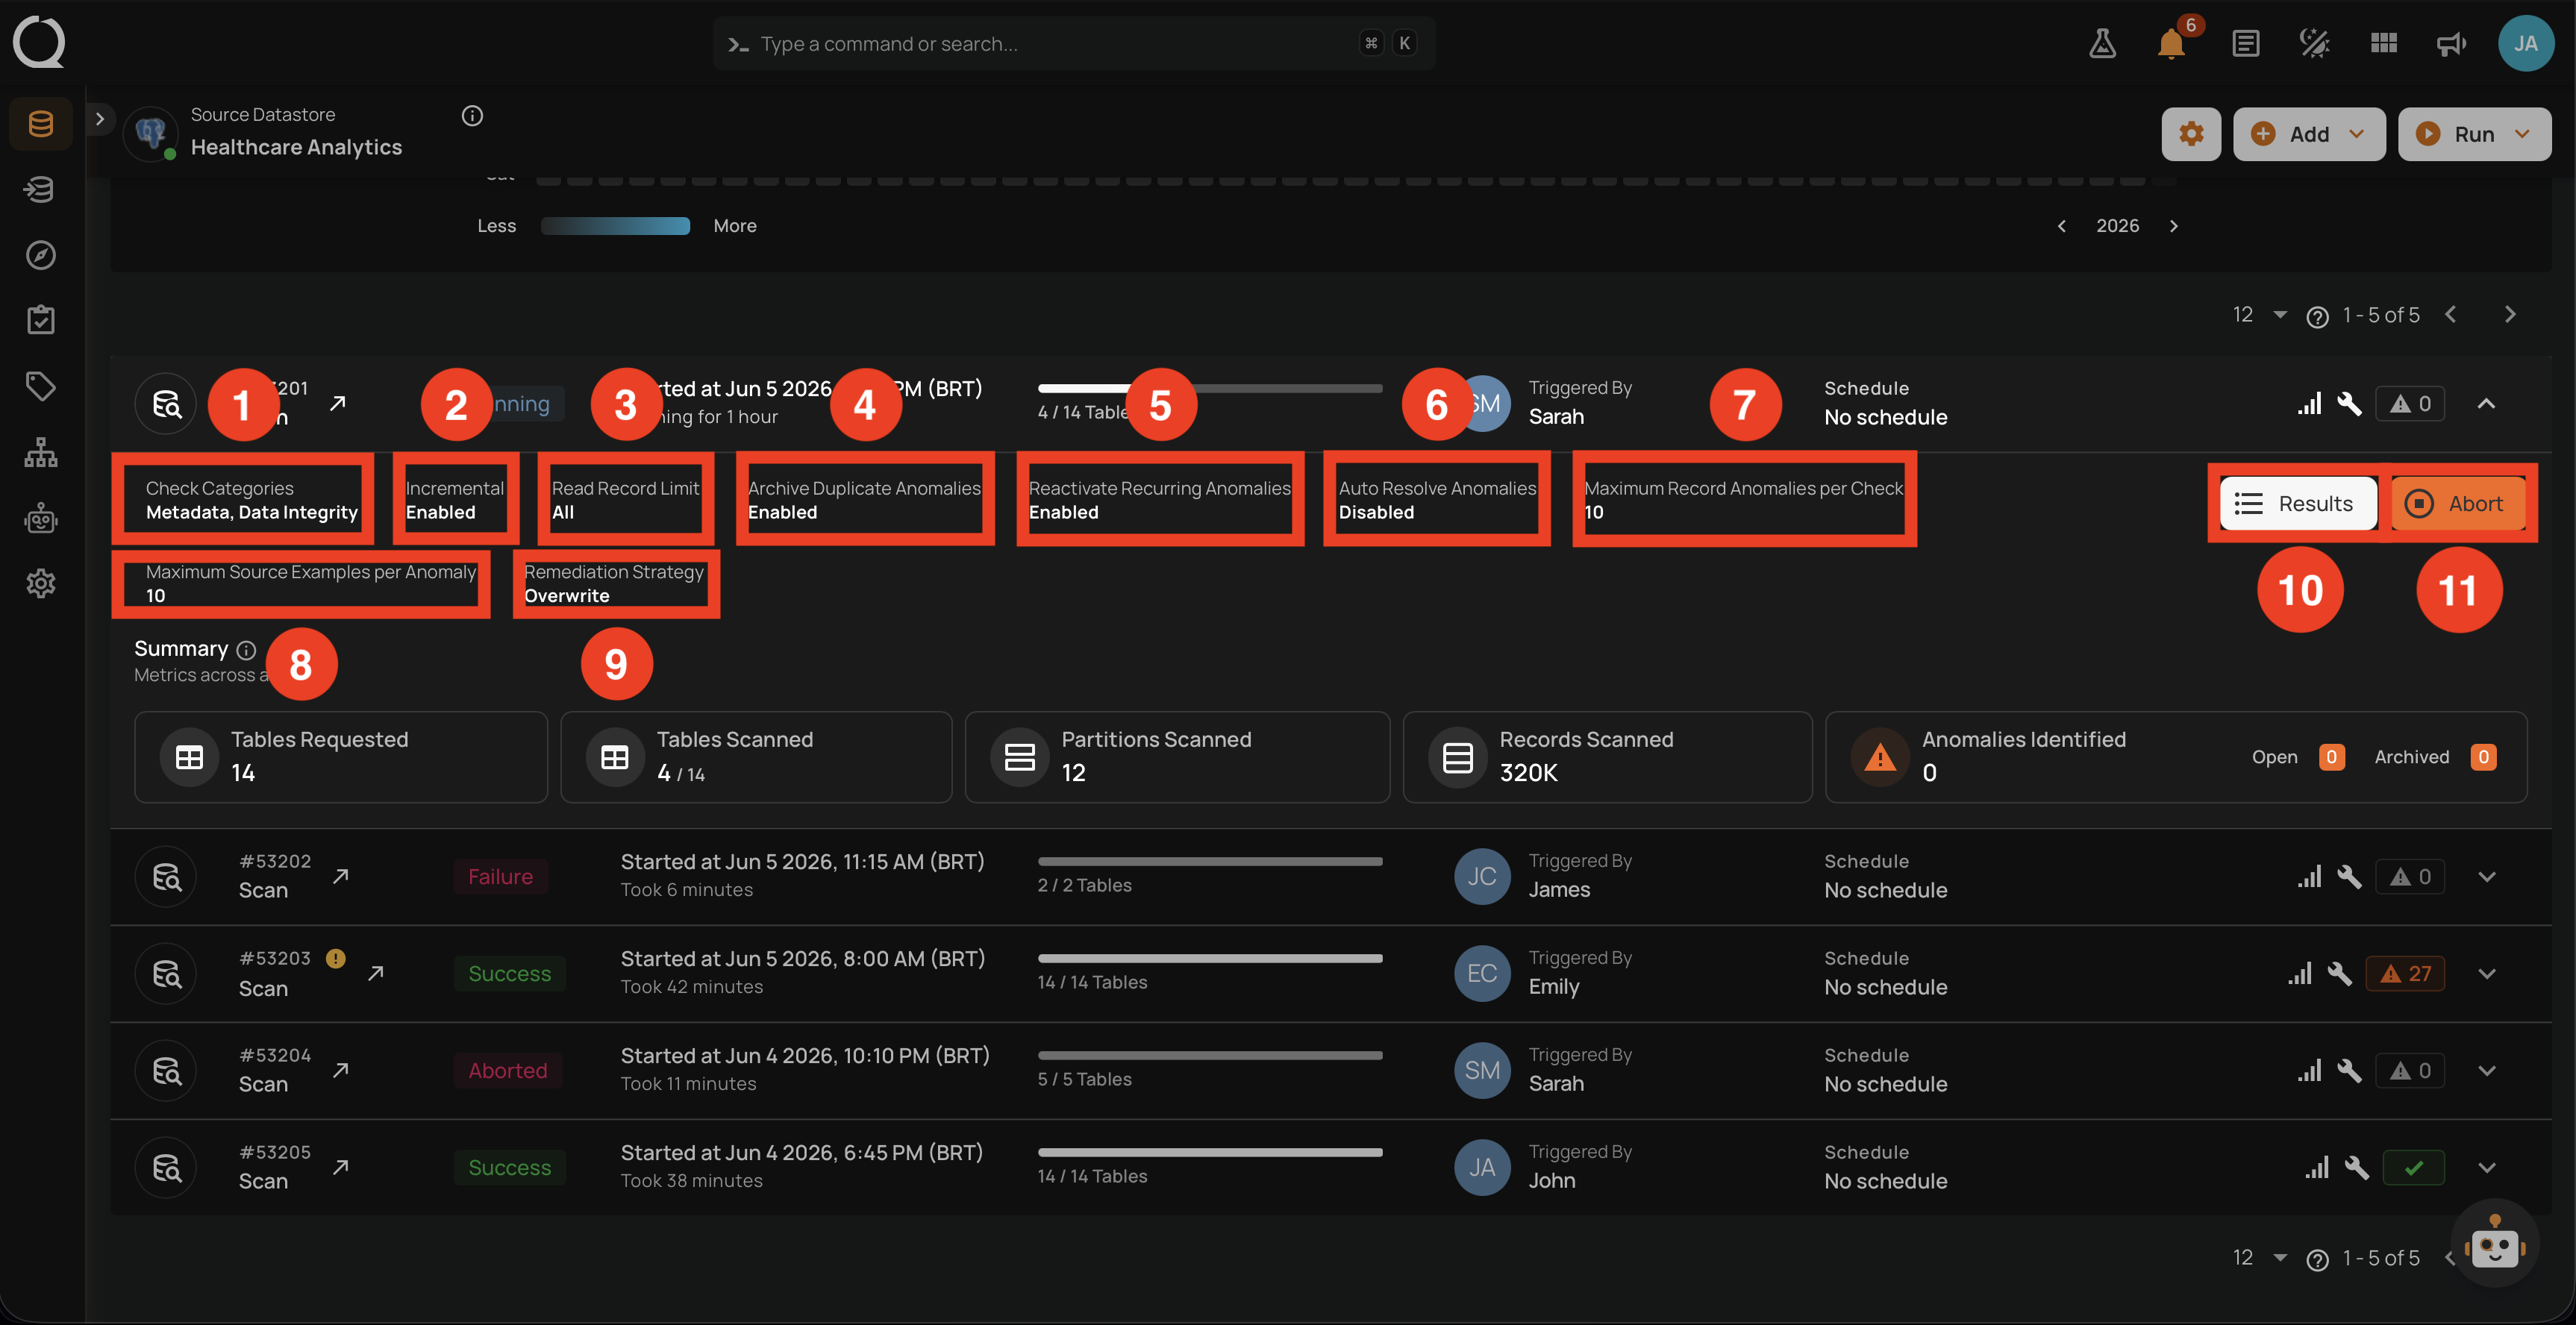
Expanding the row reveals the Settings used for the run (read-only) and the inline action buttons.
| No. | Setting | What it shows |
|---|---|---|
| 1 | Check Categories | Which categories are running. |
| 2 | Incremental | Read strategy in use (Enabled/Disabled). |
| 3 | Read Record Limit | Per-container record cap. |
| 4 | Archive Duplicate Anomalies | Setting from Step 4. |
| 5 | Reactivate Recurring Anomalies | Setting from Step 4. |
| 6 | Auto Resolve Anomalies | Setting from Step 4 (Full scans only). |
| 7 | Maximum Record Anomalies per Check | The rollup threshold in effect. |
| 8 | Maximum Source Examples per Anomaly | Source examples cap in effect. |
| 9 | Remediation Strategy | The remediation strategy in effect. |
| 10 | Results | Opens the Scan Results modal with whatever has been processed so far. |
| 11 | Abort | Replaces Delete while the operation is in flight. Stops the operation; the row transitions to the Aborted state, with an Operation Aborted by <user> event in the Timeline. |
The unique aspect of Running operations is the Abort button: it is the only way to stop the operation before it reaches a terminal state.
Summary
| No. | Metric | What it shows |
|---|---|---|
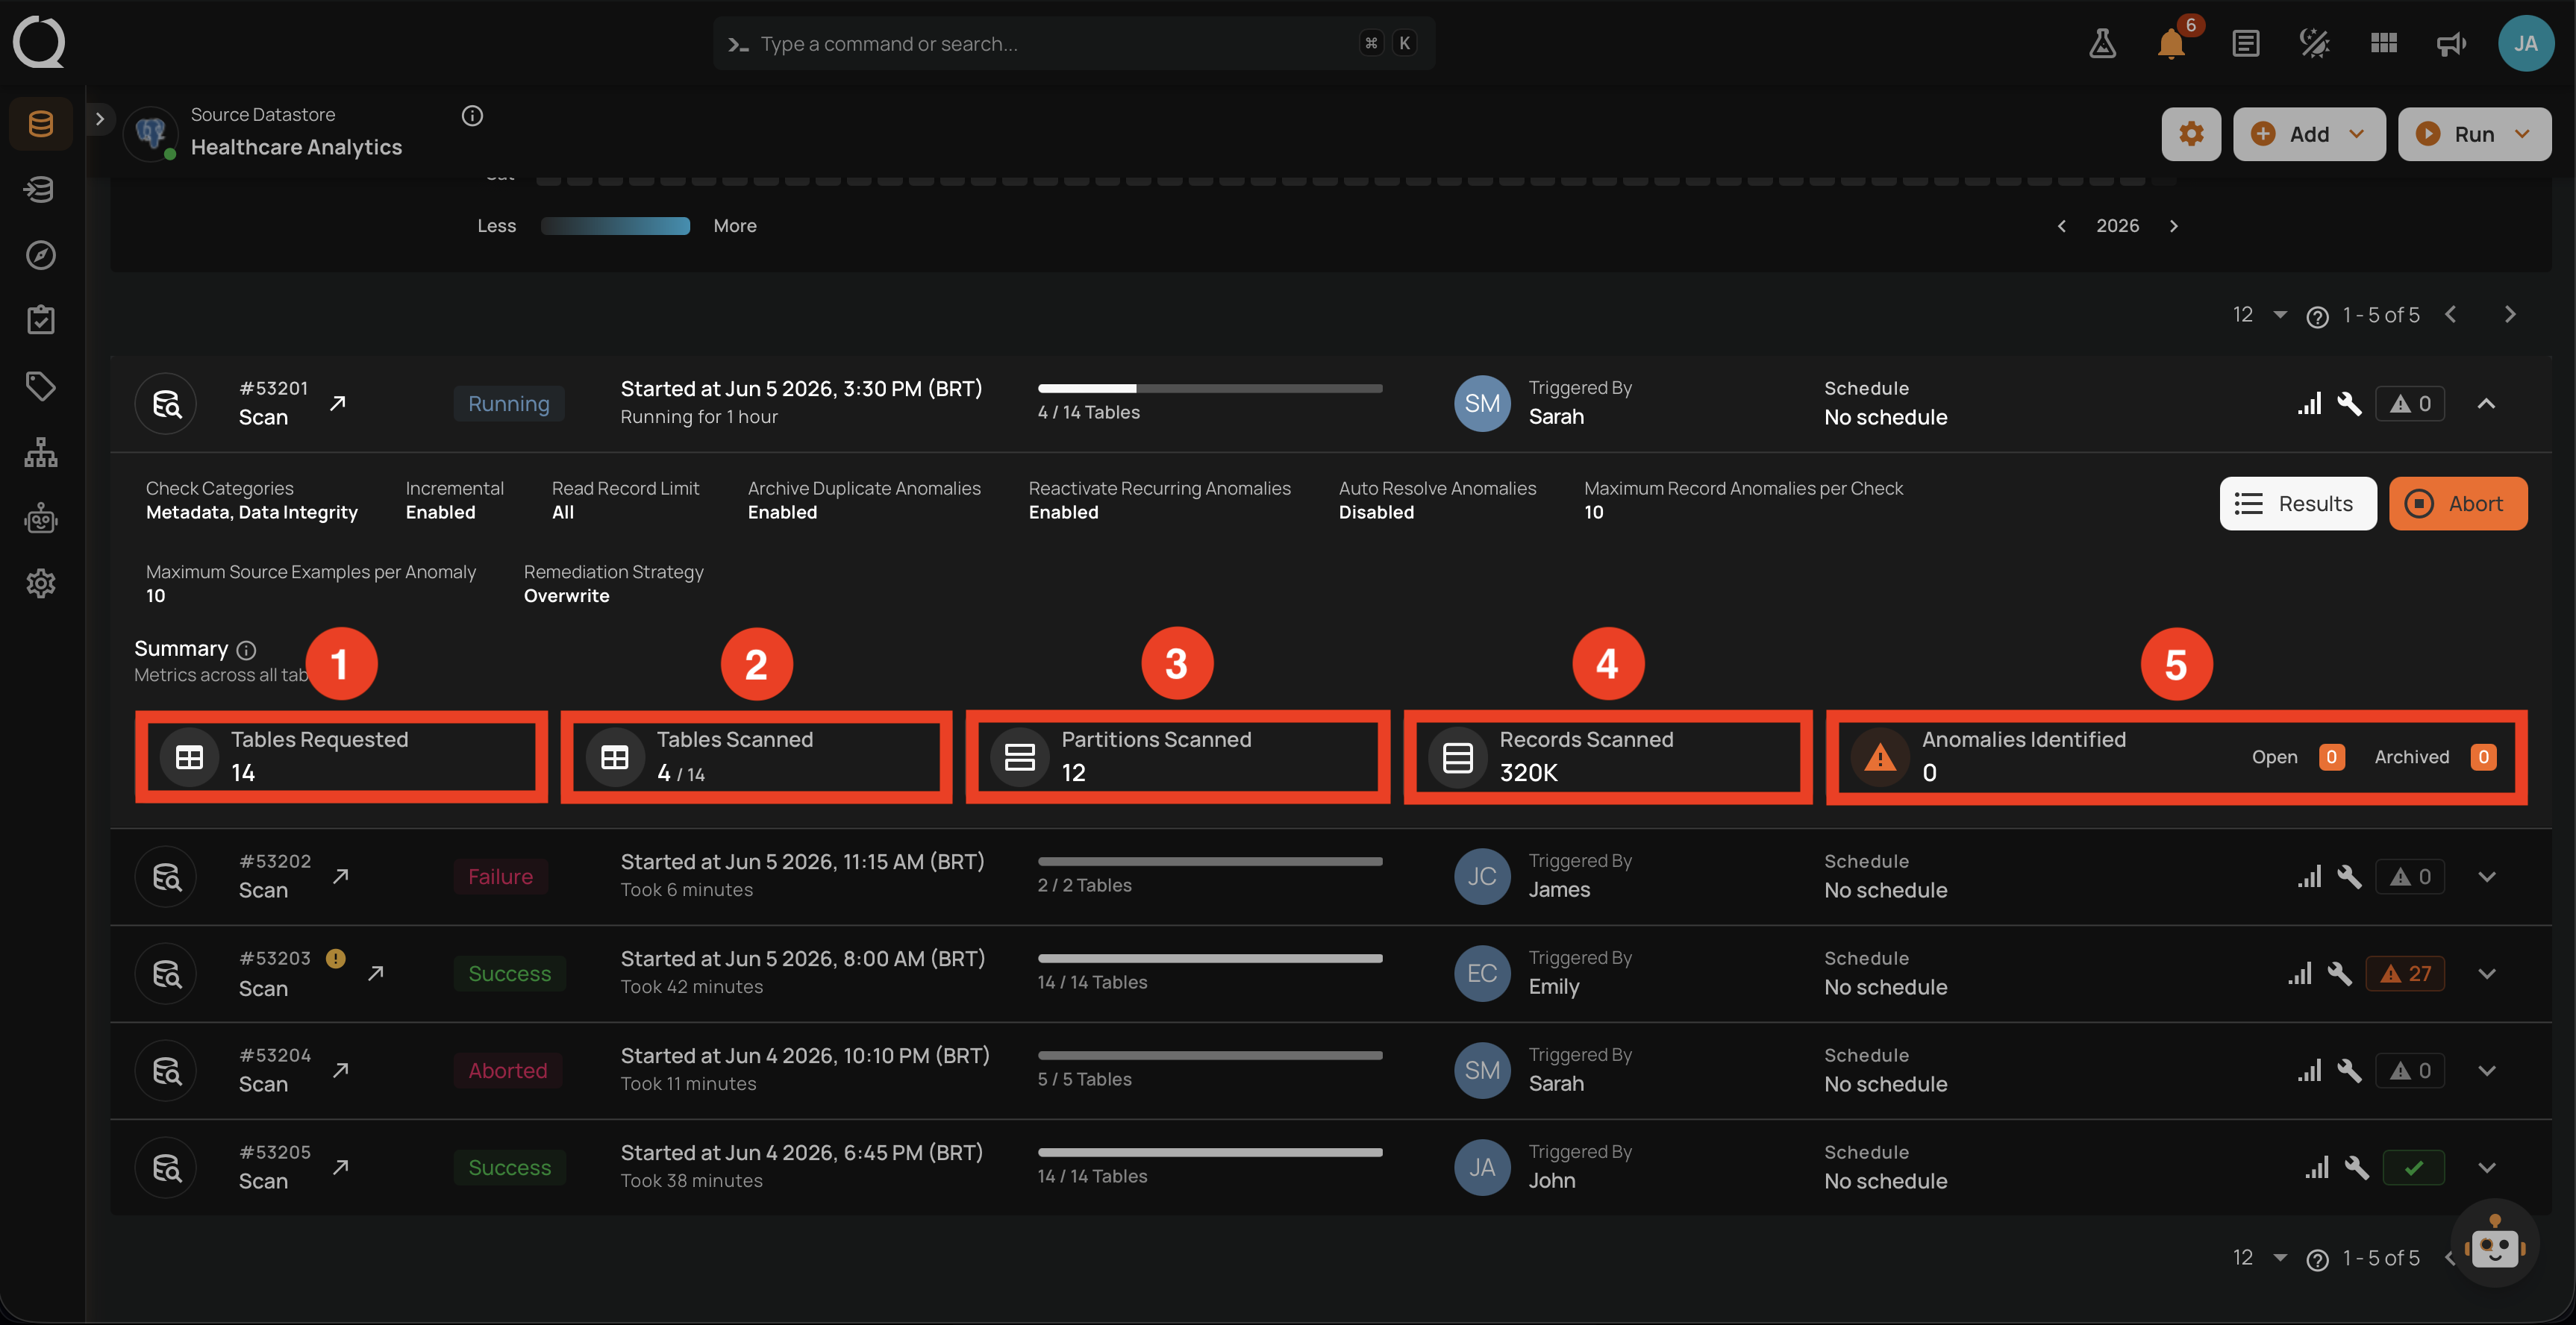
| 1 | Tables Requested | Total containers targeted (fixed for the run). |
| 2 | Tables Scanned | How many containers have completed so far (updates live). |
| 3 | Partitions Scanned | Partitions read so far (updates live). |
| 4 | Records Scanned | Records processed so far (updates live). |
| 5 | Anomalies Identified | Anomalies detected so far, split into Open and Archived (updates live). |
All counters update in real time as containers are processed. Refreshing the Activity tab pulls the latest values.
Operation detail page
Clicking the row opens the dedicated operation detail page, which has two top-level tabs: Overview and Results. The Overview tab presents the operation's live properties, settings, in-flight metrics, and chronological timeline. The Results tab drills into the containers processed so far.
Overview tab
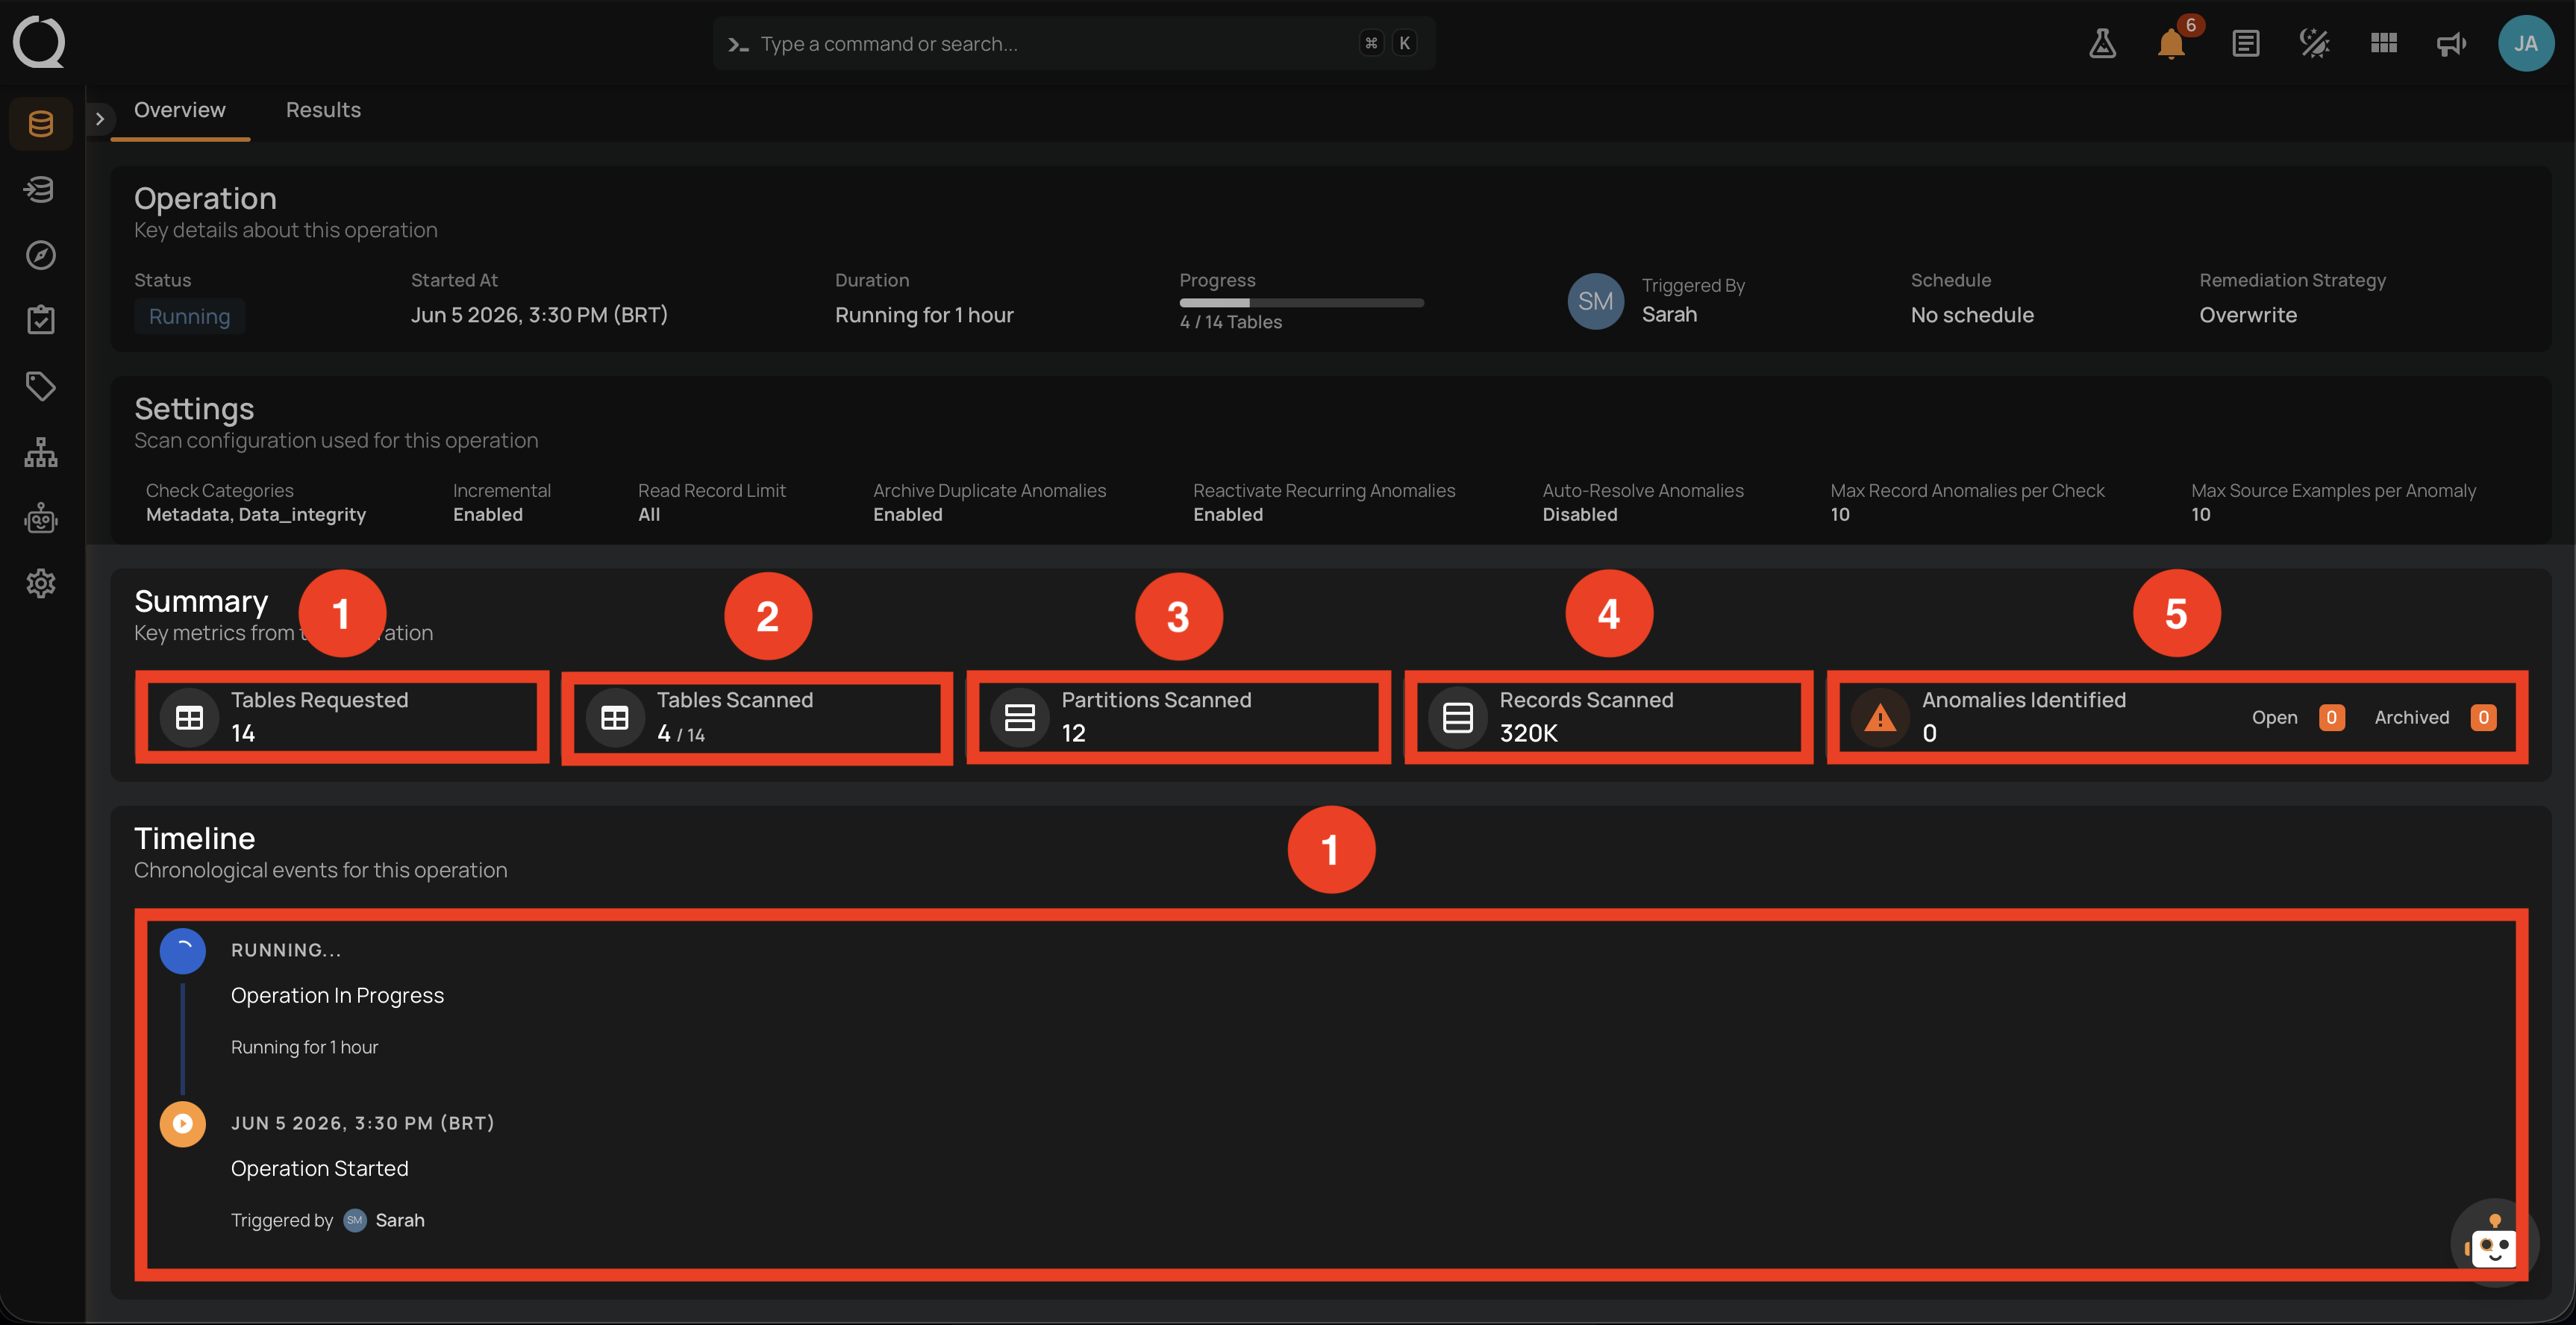
The Overview tab opens with a live snapshot of the run, organized into four blocks: Operation, Settings, Summary, and Timeline. Counters update live until the operation reaches a terminal state.
Operation block
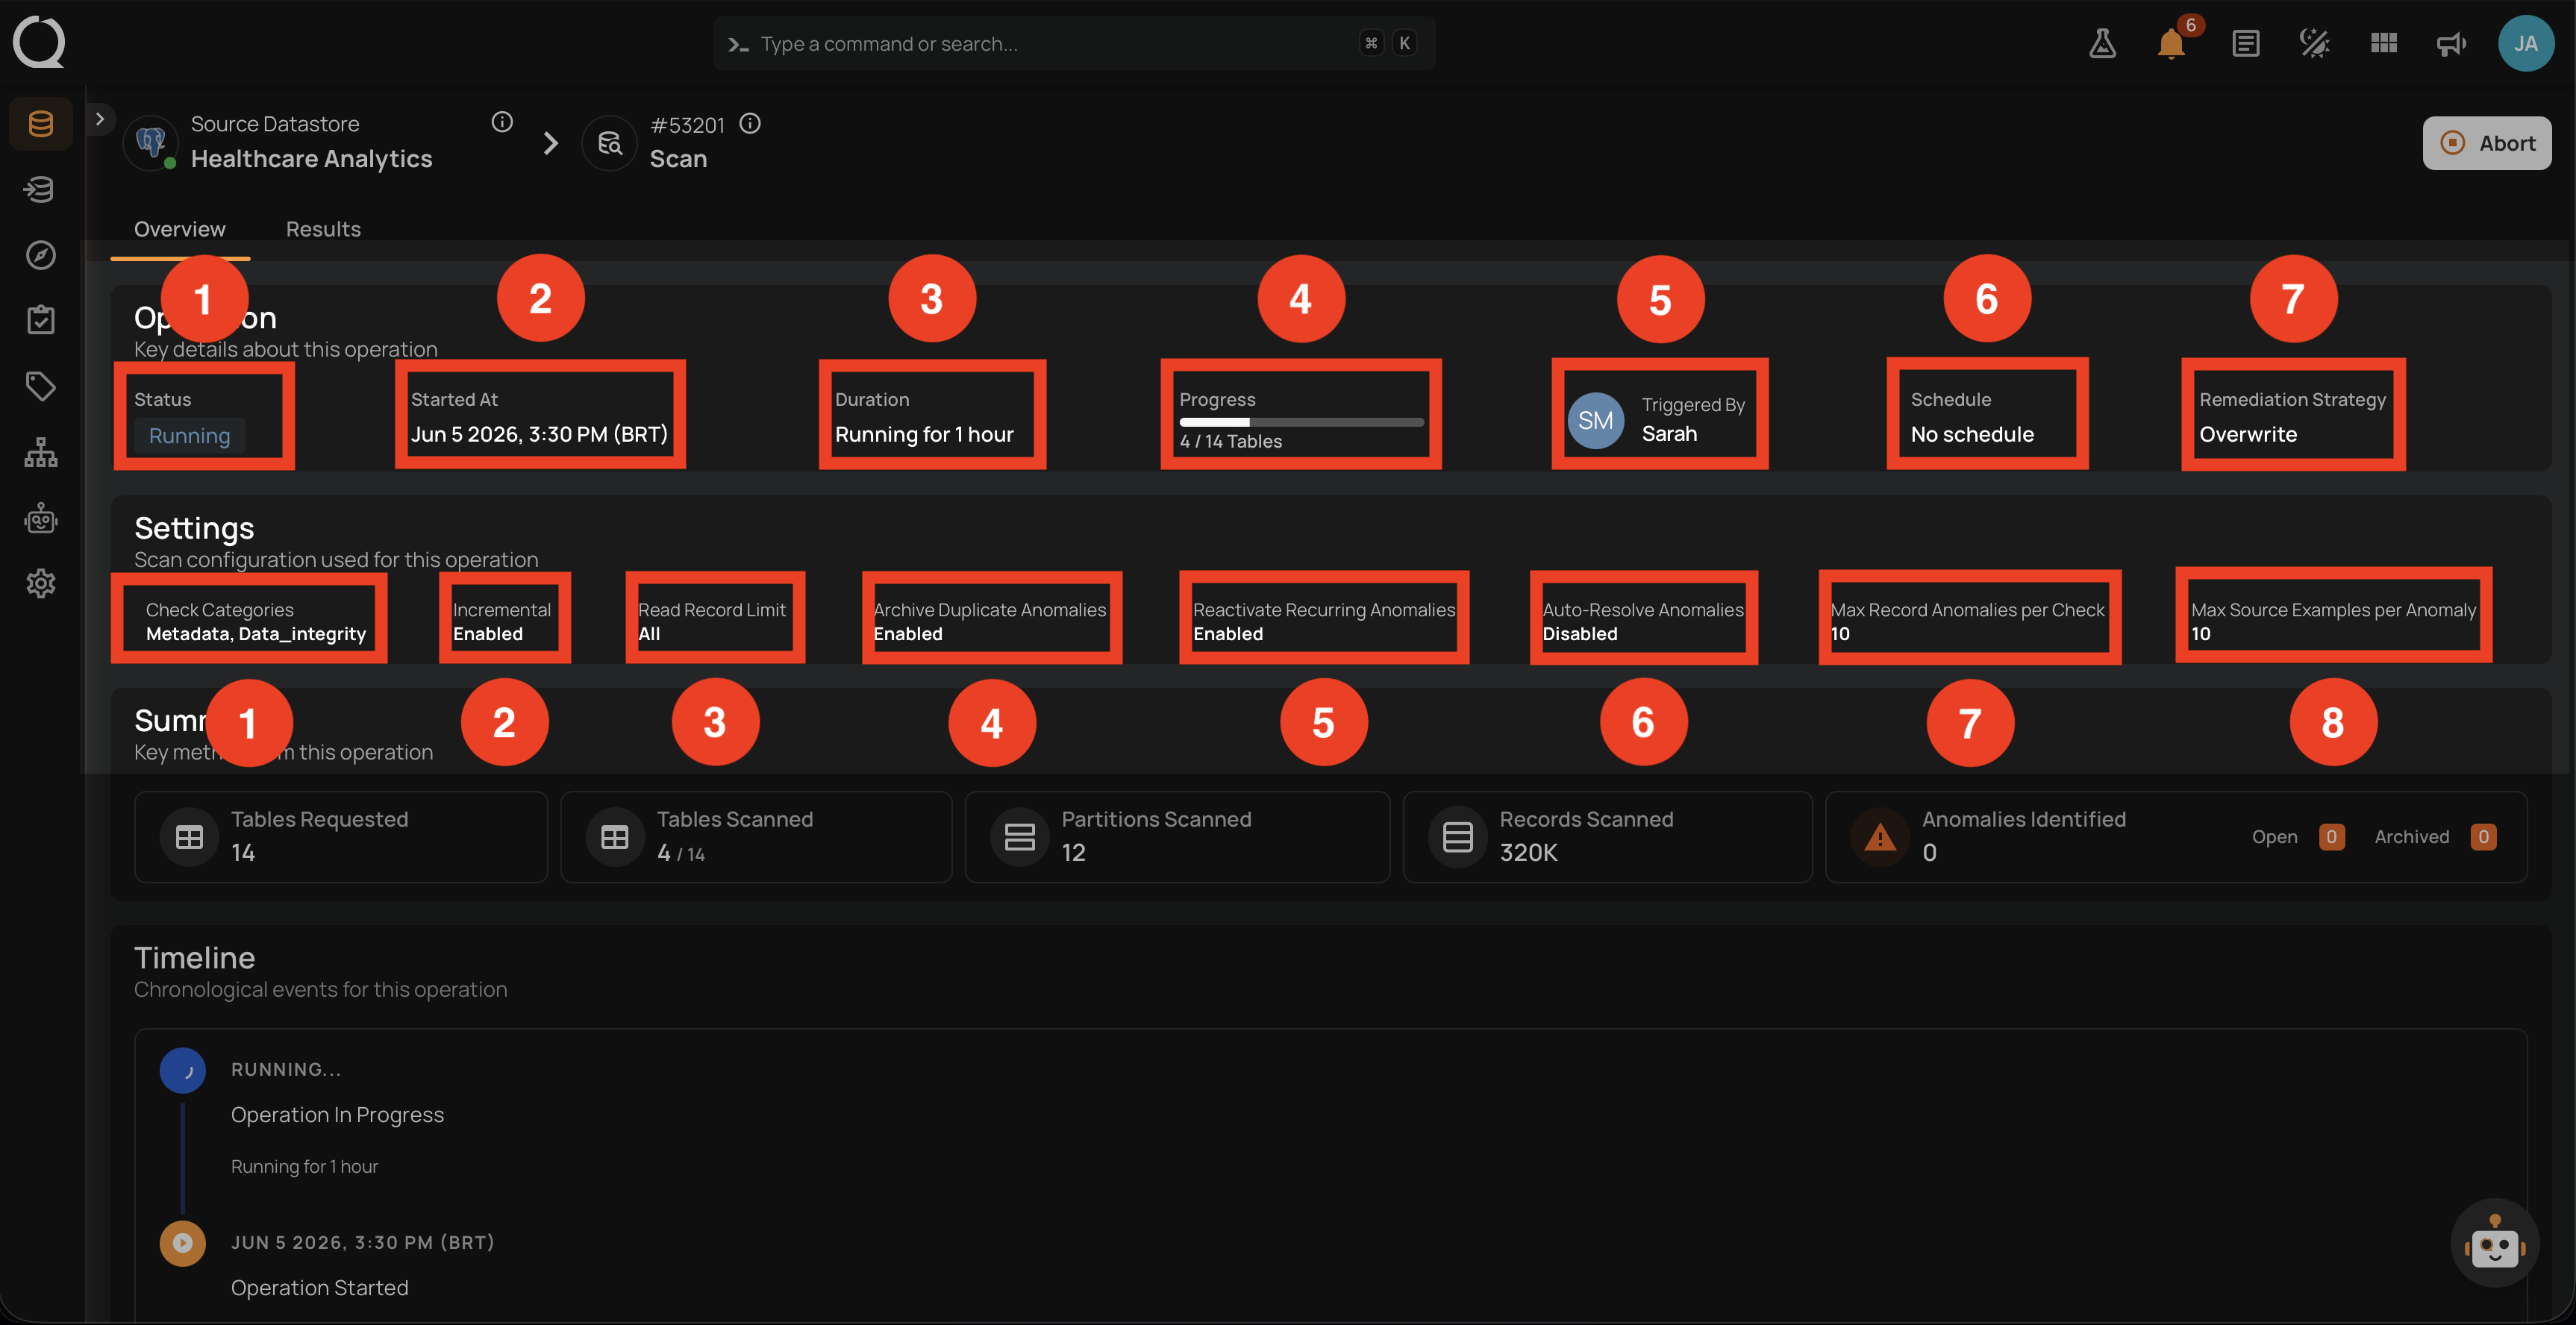
The Operation block at the top carries the properties that summarize the run identity and live outcome.
| No. | Element | What it shows |
|---|---|---|
| 1 | Status | The state badge (Running, orange). |
| 2 | Started At | Exact start timestamp. |
| 3 | Duration | Elapsed time so far, ticking up live (for example, Running for 1 hour). |
| 4 | Progress | Containers processed so far against total requested (4 / 14 Tables); updates live. |
| 5 | Triggered By | User who launched the operation, or schedule. |
| 6 | Schedule | The named schedule (or No schedule). |
| 7 | Remediation Strategy | Effective remediation strategy for the run. |
Settings block
The Settings block lists the scan settings in effect for the run (same fields as the row's Details section, minus the action buttons).
| No. | Setting | What it shows |
|---|---|---|
| 1 | Check Categories | Categories selected in Step 2 (for example, Metadata, Data_Integrity). |
| 2 | Incremental | Whether Incremental is the read strategy (Enabled/Disabled). |
| 3 | Read Record Limit | Per-container record cap (All if uncapped). |
| 4 | Archive Duplicate Anomalies | Setting from Step 4 (Enabled/Disabled). |
| 5 | Reactivate Recurring Anomalies | Setting from Step 4. |
| 6 | Auto-Resolve Anomalies | Setting from Step 4 (Full scans only). |
| 7 | Max Record Anomalies per Check | Rollup threshold in effect. |
| 8 | Max Source Examples per Anomaly | Source examples cap in effect. |
Together, the Operation and Settings blocks act as the canonical "what is happening" snapshot of the run. If the operation looks wrong, this is the first place to check the inputs.
Summary block
Scrolling down on the Overview tab shows the Summary block, which exposes live metrics that update as containers complete.
| No. | Element | What it shows |
|---|---|---|
| 1 | Tables Requested | Total containers targeted (fixed for the run). |
| 2 | Tables Scanned | Containers that have completed so far (updates live). |
| 3 | Partitions Scanned | Partitions read so far (updates live). |
| 4 | Records Scanned | Records processed so far (updates live). |
| 5 | Anomalies Identified | Anomalies detected so far, split into Open and Archived (updates live). |
Timeline block
The Timeline is the most up-to-date view of progress: it streams new events as containers start and complete. Each entry follows the same structure.
| Part | Element | What it shows |
|---|---|---|
| Status icon | Marker on the left | A marker colored by event type. While the operation is running, only in-progress and container icons appear; the terminal icon (Success, Failure, or Aborted) is added once the operation completes. See the legend below. |
| Timestamp | Date and time | When the event was recorded, in the viewer's timezone. Sorted from most recent at the top to oldest at the bottom. |
| Event title | Short label | The event identity (for example, Operation Started, Container scan started, Container scan completed). |
| Event detail | Context line | Additional information specific to the event: the user who triggered the operation, the container name involved, partition progress, or other event-specific data. |
Timeline icon legend:
- Operation Success terminal entry (added when the run completes successfully).
- Operation Failure terminal entry (added on fatal error).
- Operation Aborted terminal entry (added when stopped by user or system).
- Operation In Progress (active while Running, animated in the UI).
- Operation Started.
- Per-container entries inherit the same icon and color based on each container's own outcome (Success/Failure/Aborted/Running).
For an in-flight Running scan, the typical events are:
Container scan started/Container scan completedentries appearing live as each container is picked up and finishes.Operation Startedat the bottom, withTriggered by <user>.- No terminal
Operation Success/Operation Failed/Operation Abortedevent yet; that entry is added at the top once the run finishes.
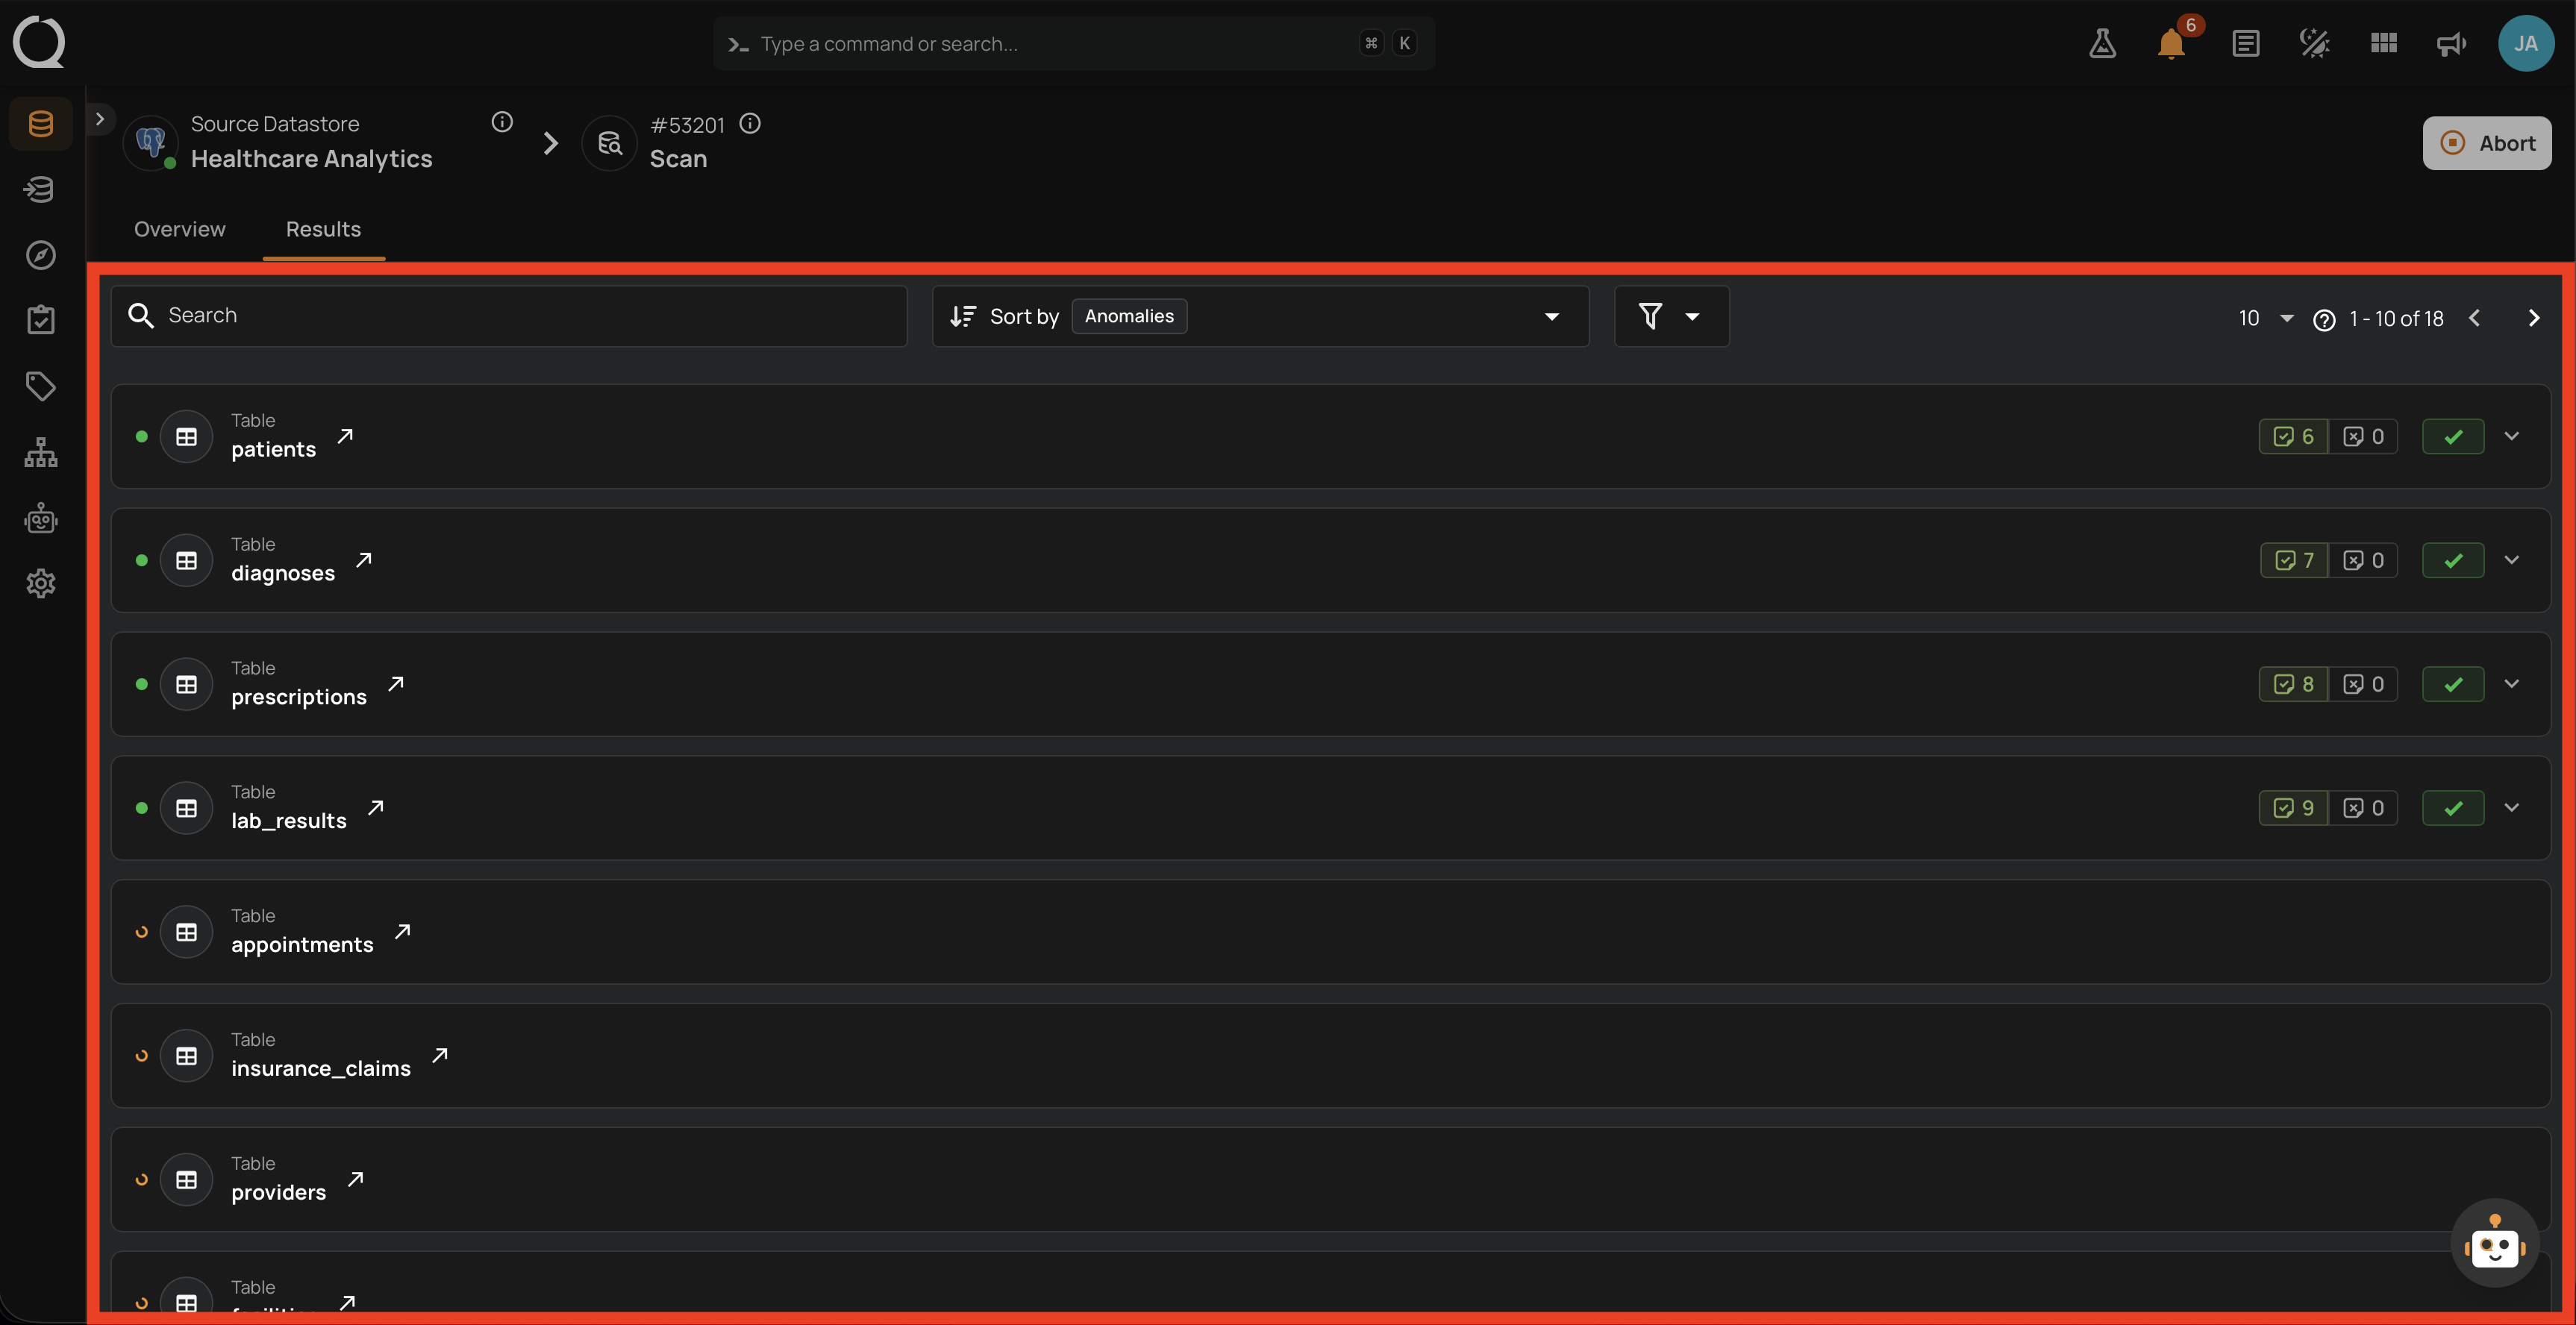
Results tab
The Results tab lists every container that has been processed so far. Containers still in queue appear with a pending indicator. Each row links to the container's detail page.
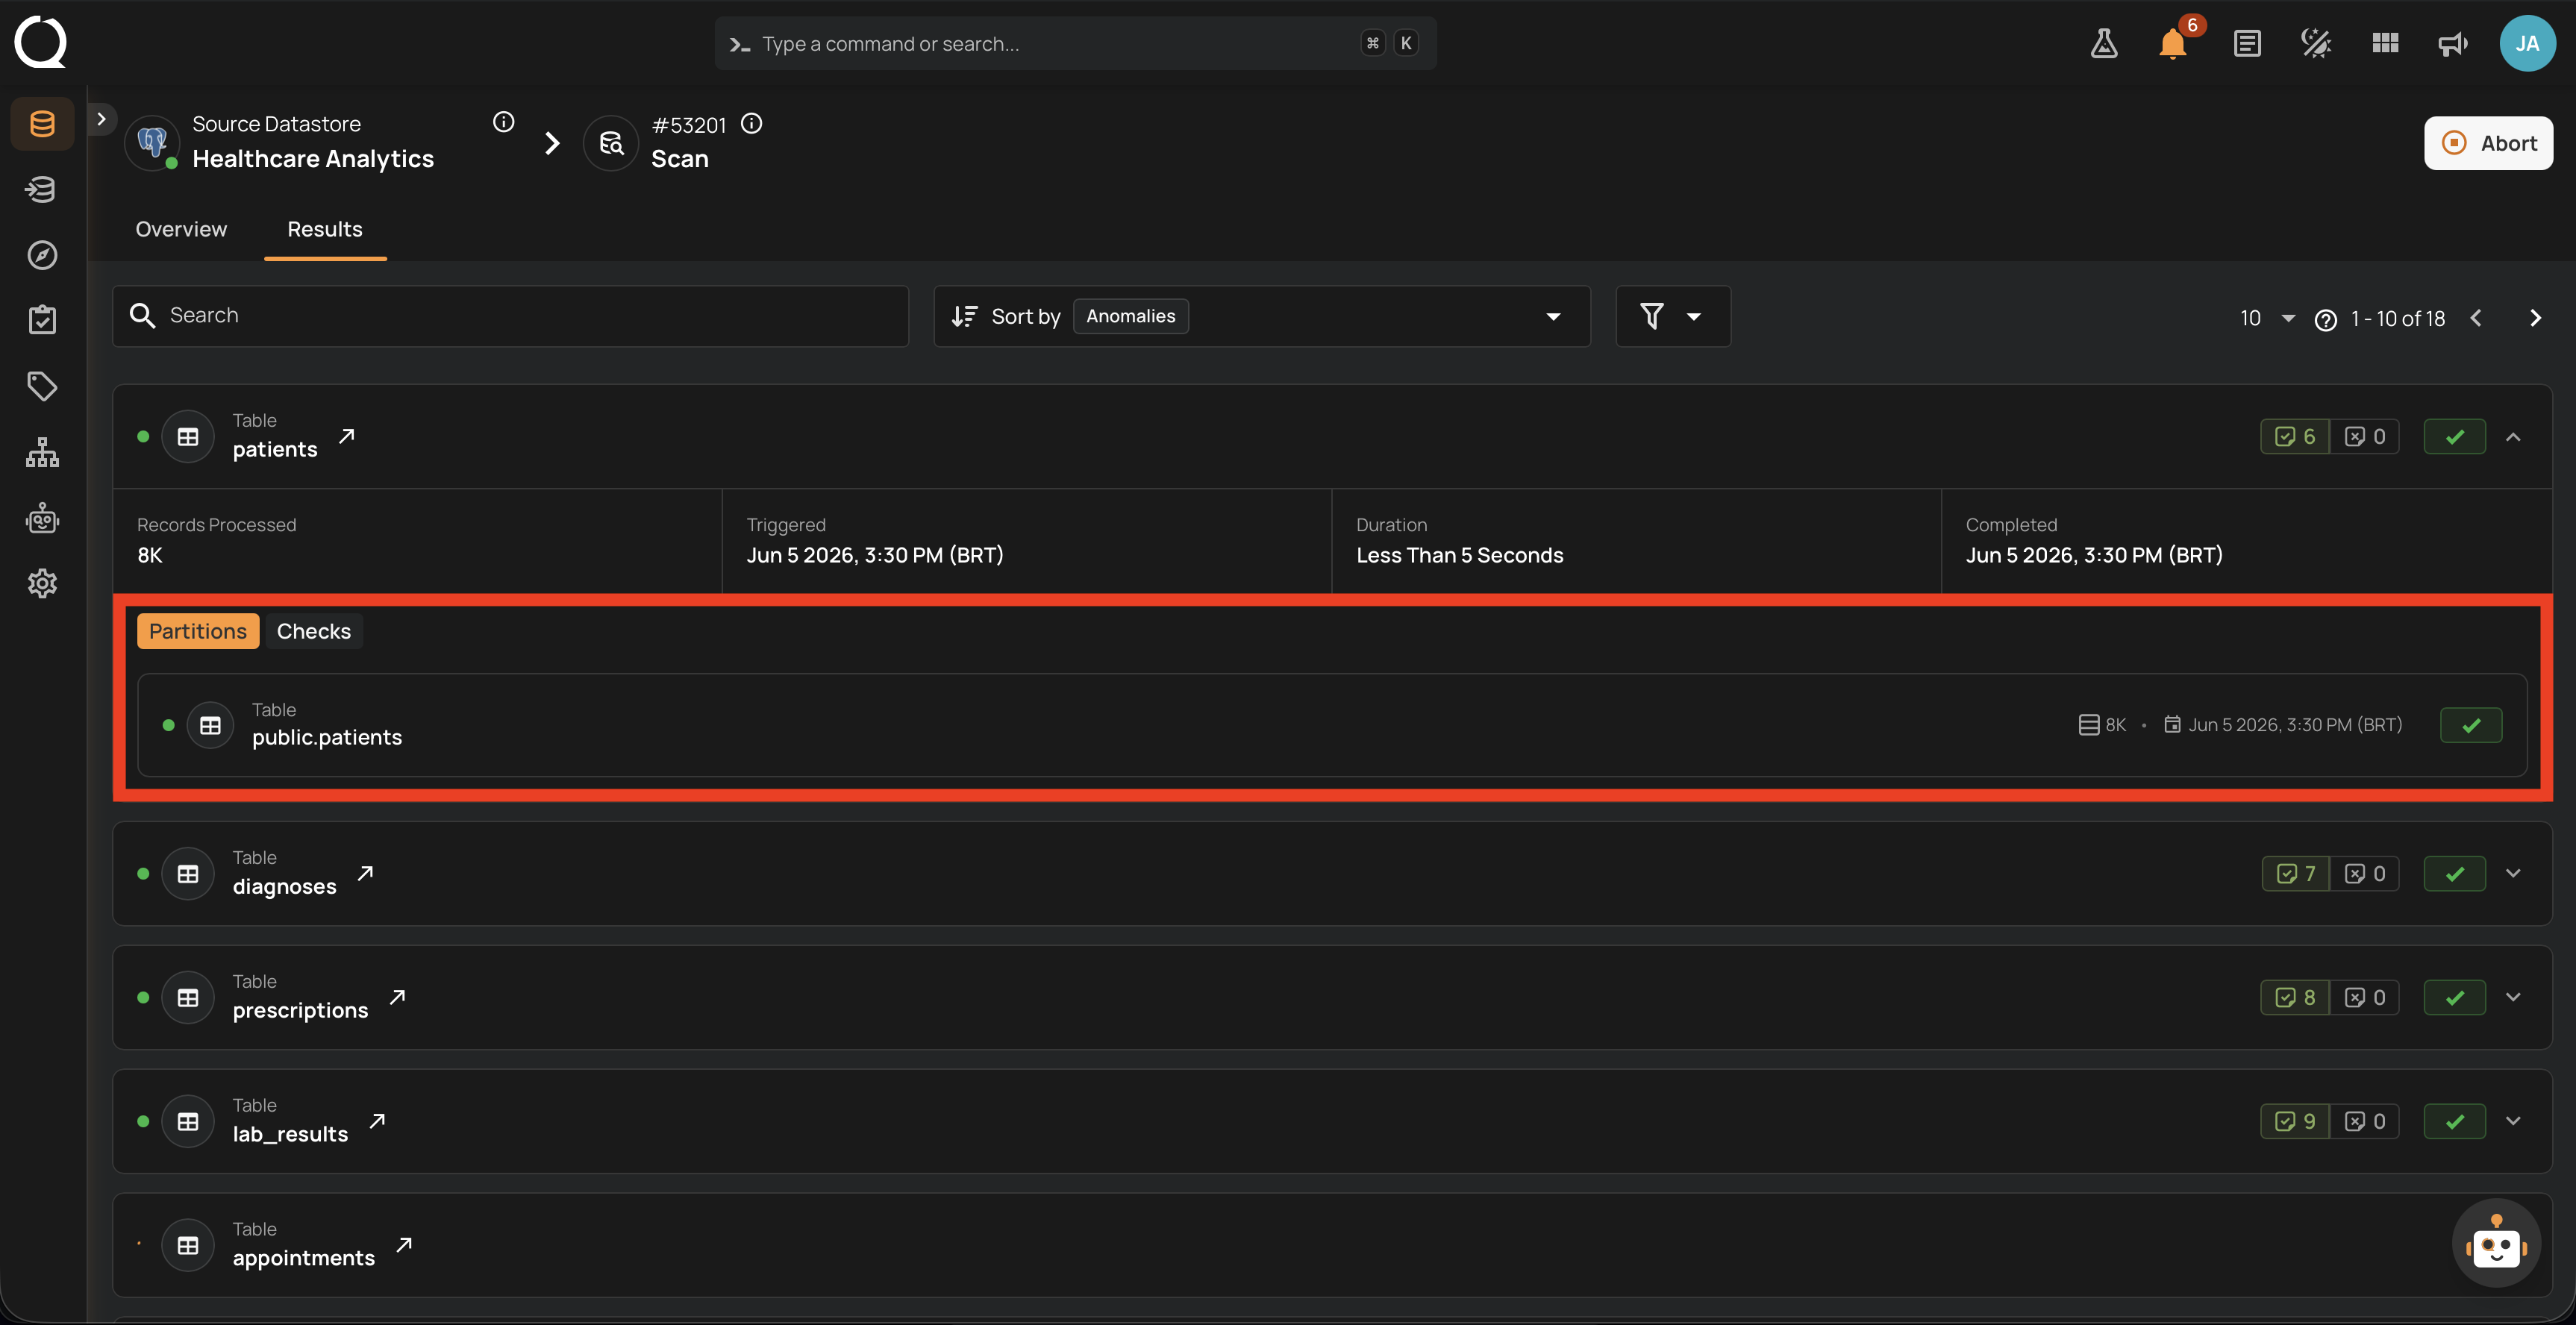
Container sub-tabs
Expanding a container row reveals two sub-tabs that drill into the live per-container results. A Source Records sub-tab is not exposed for Running operations.
Partitions
Lists every partition read for this container so far, with size, read timestamp, completion time, and per-partition counters (records processed, anomalies emitted). Useful to monitor progress on a container that is still being processed.
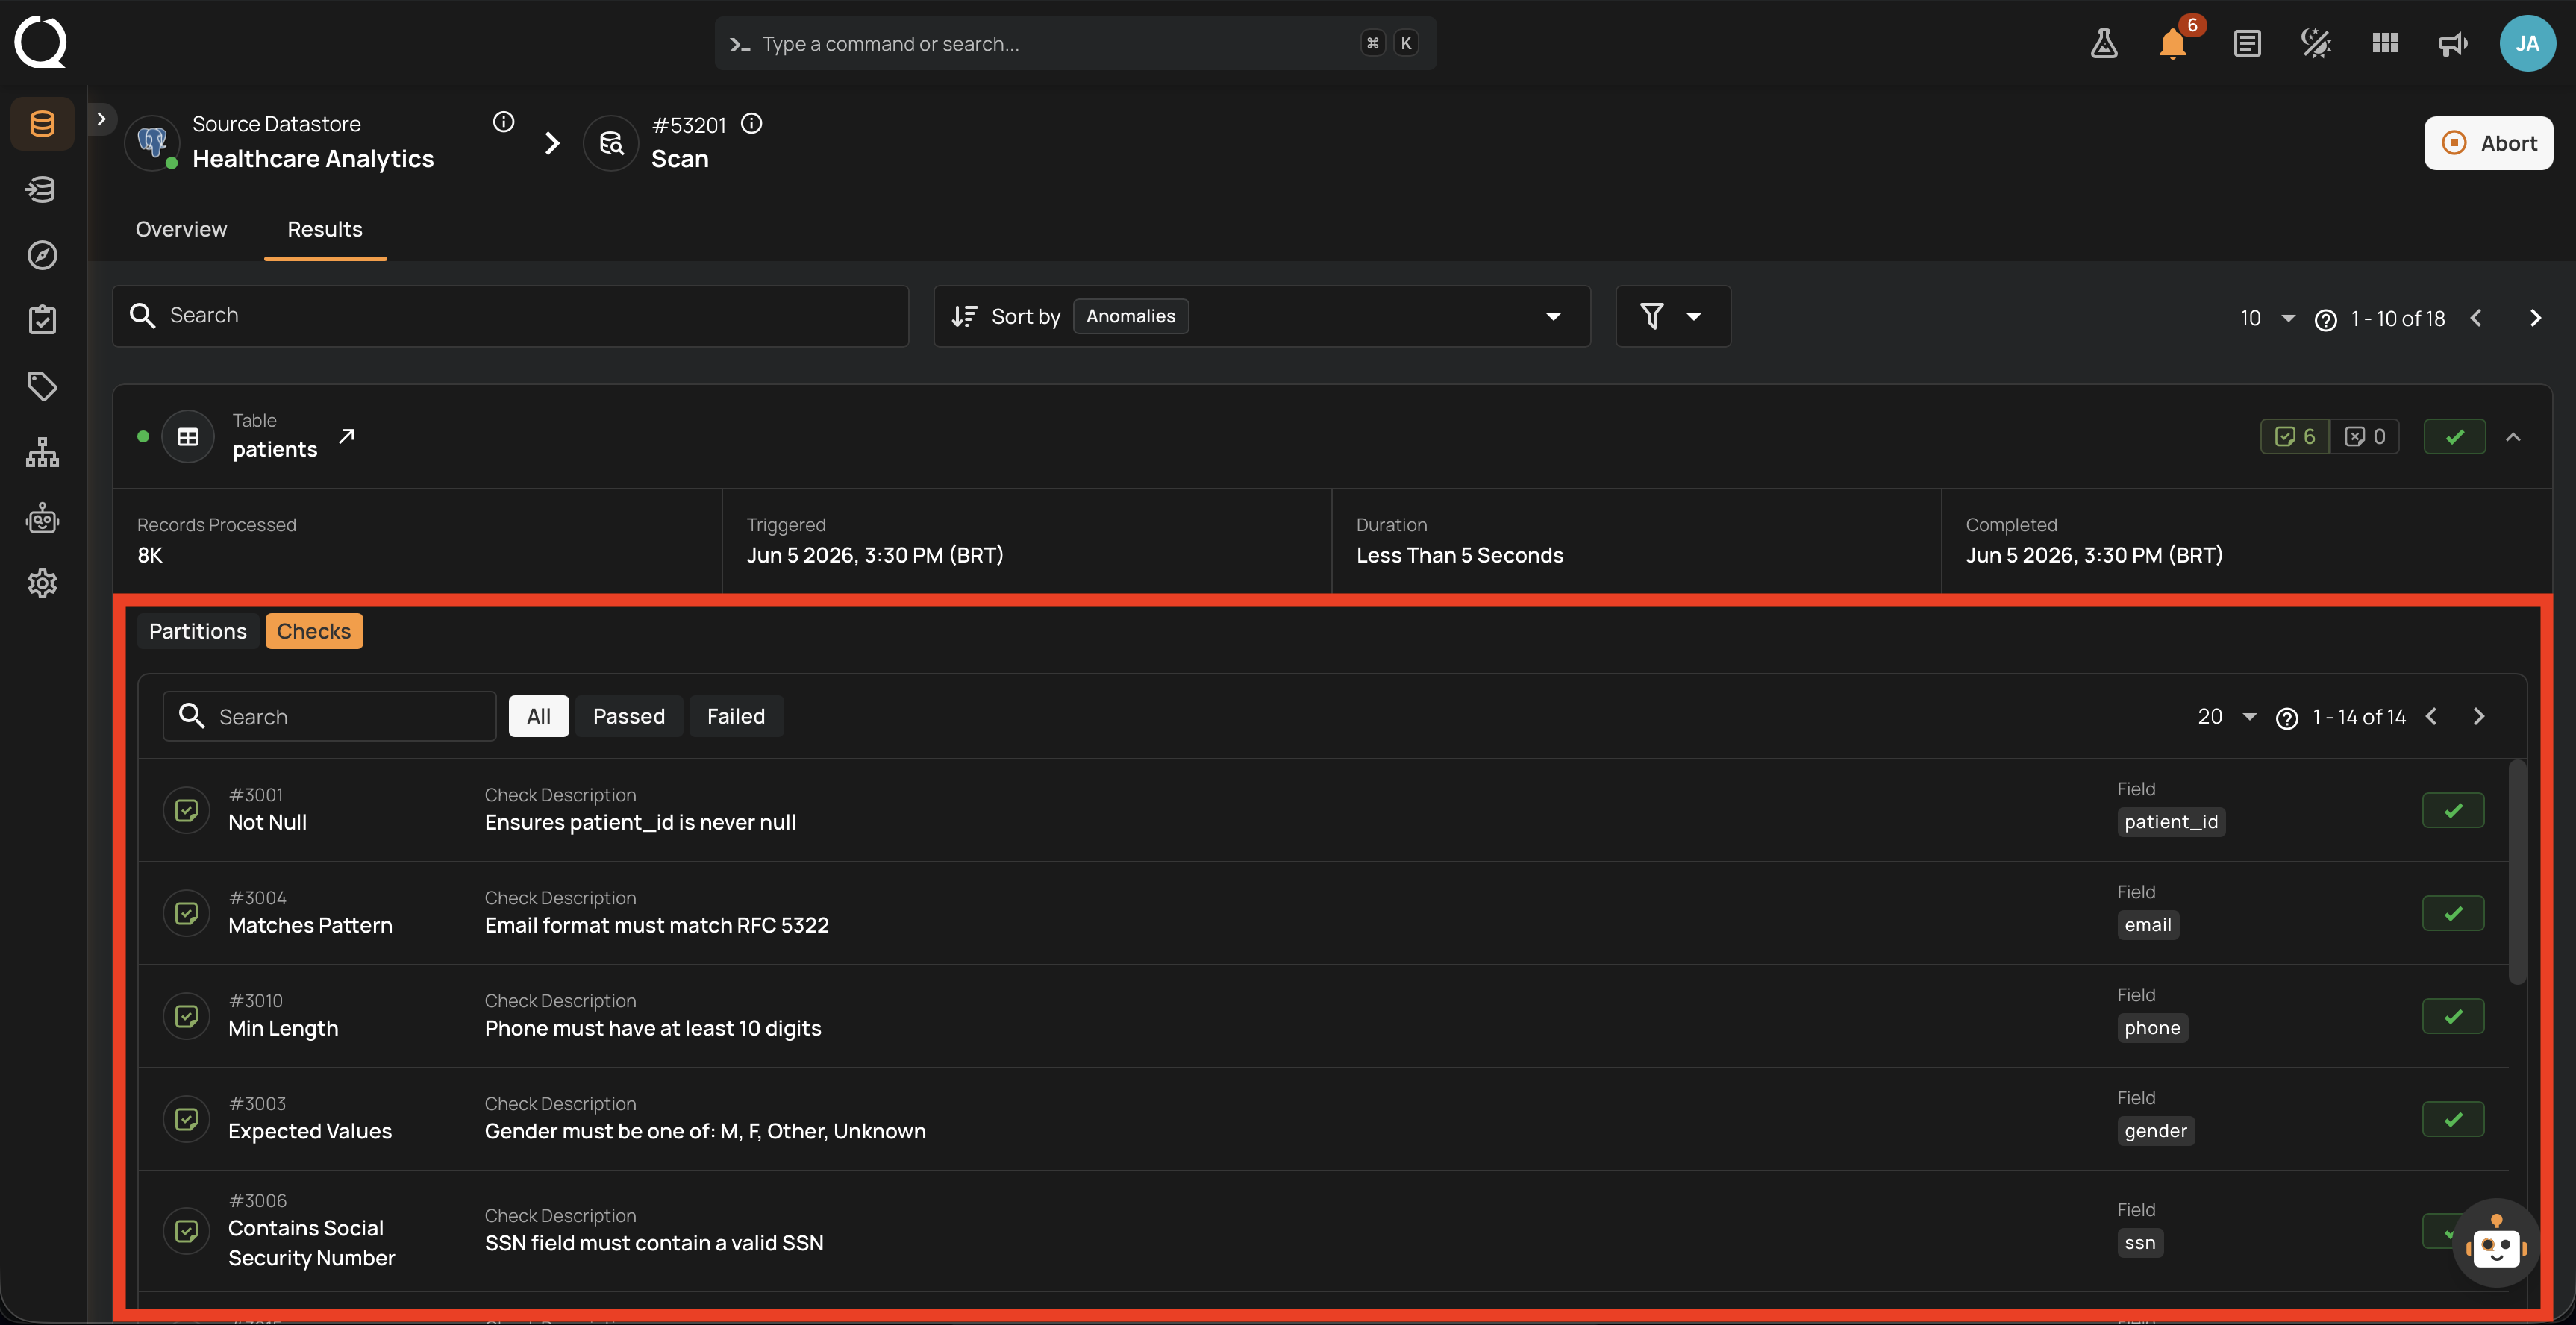
Checks
Lists every check that has been asserted against this container so far, with check ID, name, description, target field, and pass/fail status. Filters at the top (All / Passed / Failed) let you focus on the checks that did not pass. While the operation is running, additional checks are added to the list as the container finishes processing them.
See also
-
Success
The Run finished cleanly with full results.
-
Success with Warning
The Run finished cleanly but the worker recorded log entries during execution.
-
Failure
The Run stopped because of an unrecoverable error.
-
Aborted
A user or the system stopped the Run before completion.
-
Queued
The Run is registered but no worker has picked it up yet.
-
Lifecycle
State diagram, transitions, and per-operation-type lifecycle.
-
Available Actions
Abort, Resume, Rerun, and Delete: when each one is shown.