Scan: Success with Warning
Some Success operations complete cleanly but the worker recorded log entries during execution (skipped partitions, container errors that did not abort the operation, anomalies whose checks ran with reduced coverage). The Status badge still shows the green Success state.
An additional icon appears next to the Run ID with the tooltip "Warning: Completed with logs". The underlying status remains Success, and the Run is treated as a terminal Success everywhere downstream (Auto-Resolve eligibility, summary metrics, schedules). The indicator only flags that the operation log is worth opening before relying on the result.
Action buttons available: Results, Rerun, Delete.
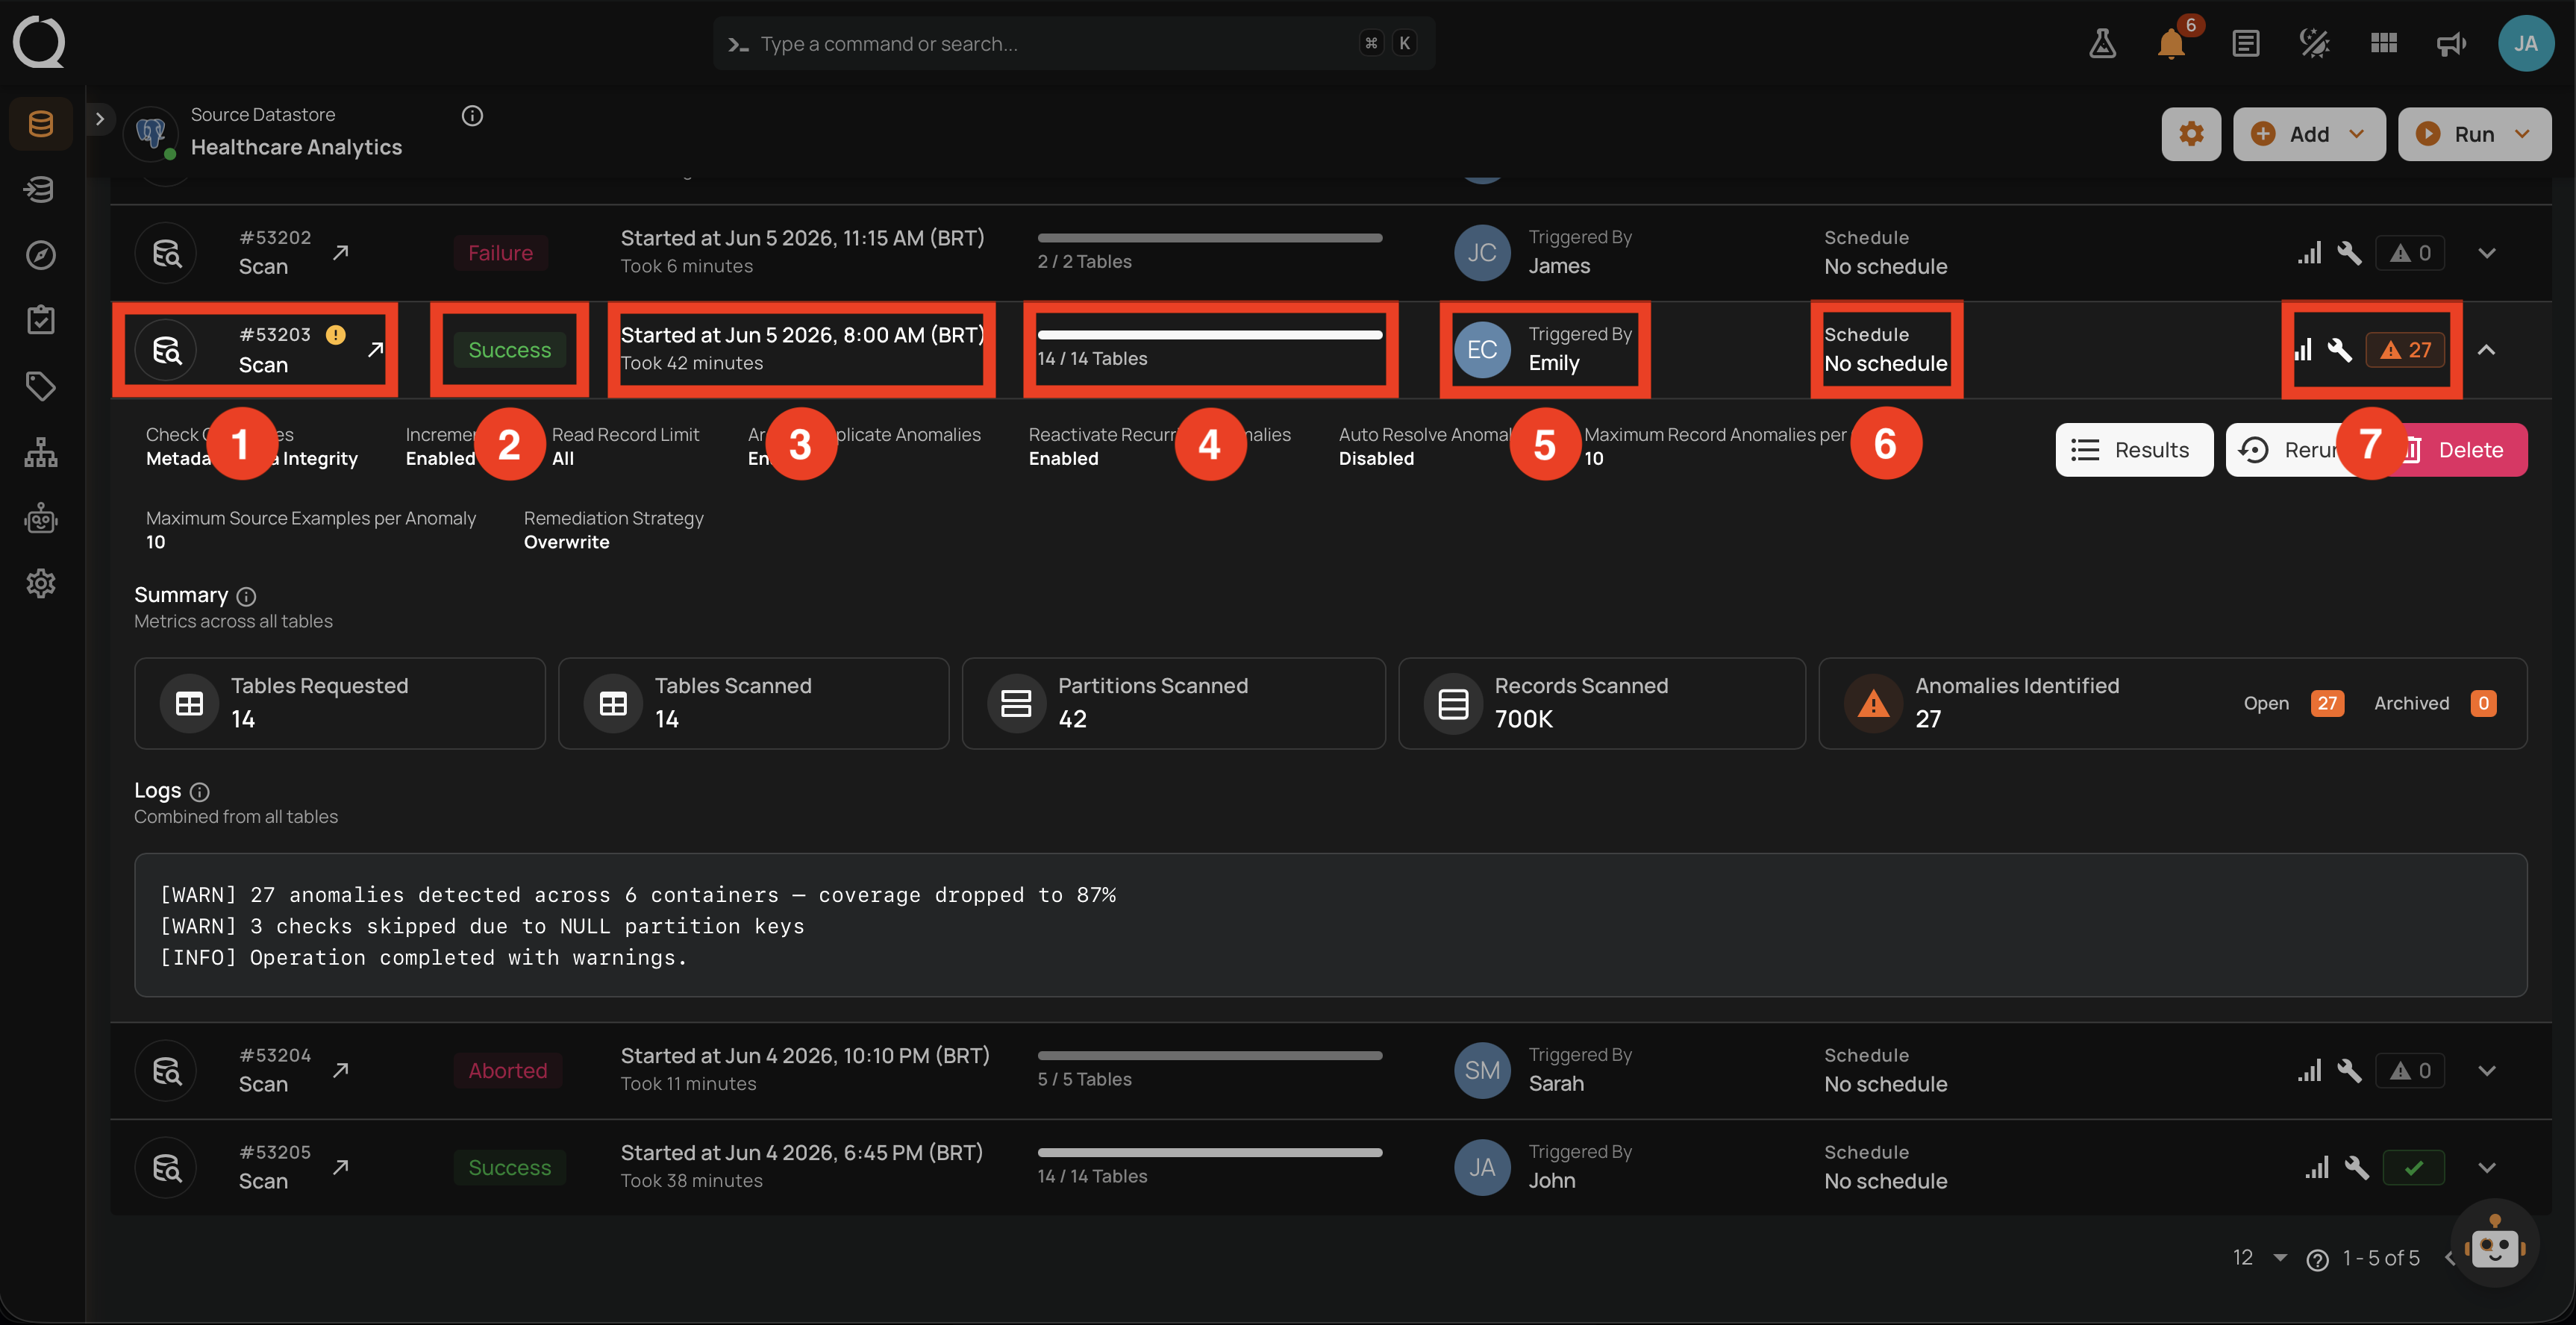
Expanded row in the operations list
Header of the operation
| No. | Element | What it shows |
|---|---|---|
| 1 | Operation ID and type | The unique identifier (for example #53201) and the operation type (Scan). The icon next to the ID links to the dedicated Overview of the operation. |
| 2 | Status badge | The green Success badge. An indicator appears next to the Run ID (in cell No. 1) with the tooltip "Warning: Completed with logs", signaling that the worker recorded log entries during the run. The Status badge itself stays green. |
| 3 | Time info | The operation's timing: Started At (for example Started at Jun 5 2026, 11:15 AM (BRT)) and Duration (for example Took 14 minutes). |
| 4 | Progress | Containers processed against the total requested (1 / 14 Tables). |
| 5 | Triggered by | The user (avatar and name) who launched the operation, or the schedule that triggered it. |
| 6 | Schedule | The named schedule if recurring, otherwise No schedule. |
| 7 | Quick stats icons | A cluster of small status icons on the right of the row. Each icon shows a tooltip on hover summarizing configuration and result counters at a glance. See the Right-side icons (No. 7) in detail breakdown below this table. Not the row action buttons. |
Right-side icons (No. 7) in detail
For this operation the cluster shows three icons, left to right:
| Icon | Tooltip | What this screenshot shows |
|---|---|---|
| Incremental Field | Filled, indicating the Incremental read strategy was Enabled for this run. | |
| Remediation Strategy | Filled, indicating a remediation strategy is set (Overwrite in this run). |
|
| Anomalies Identified | Orange triangle with the count 27, indicating 27 anomalies were detected. Hovering surfaces the breakdown into Open and Archived. |
The Anomalies Auto-Resolved indicator () is not shown in this screenshot because Auto-Resolve only applies to Full scans, and this operation ran in Incremental mode.
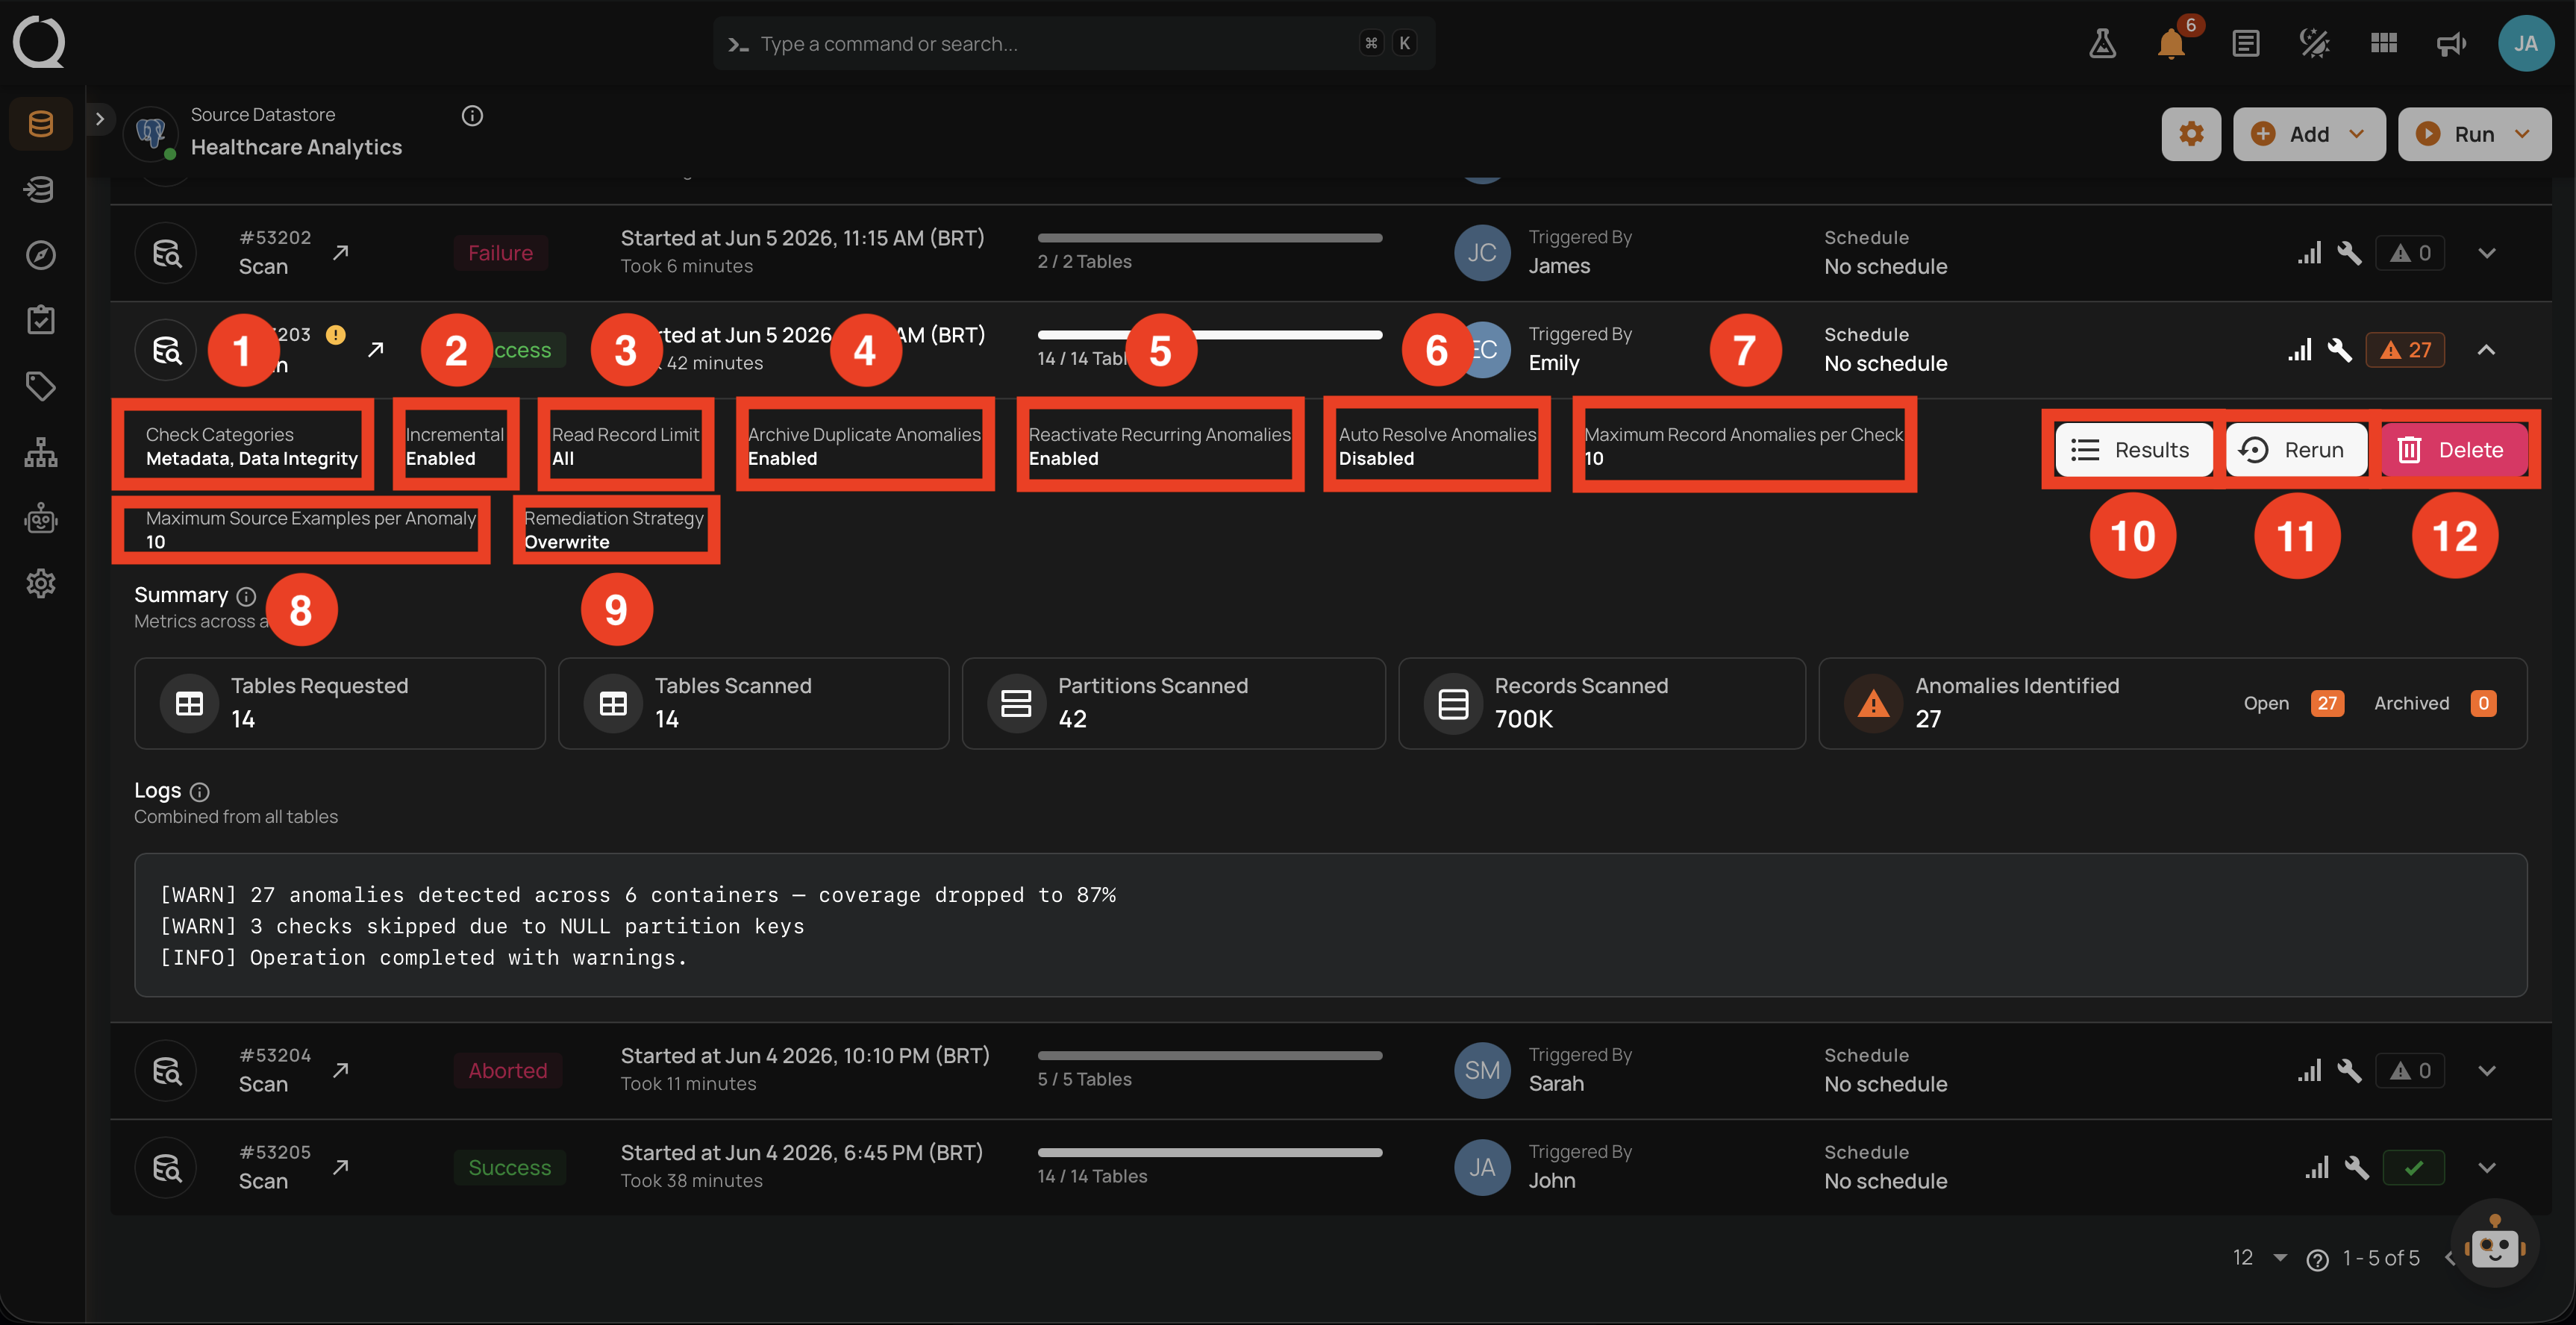
Details of the operation
Expanding the row reveals the Settings used for the run (read-only) and the inline action buttons (Results, Rerun, Delete).
| No. | Setting | What it shows |
|---|---|---|
| 1 | Check Categories | Which categories ran. |
| 2 | Incremental | Read strategy used (Enabled/Disabled). |
| 3 | Read Record Limit | Per-container record cap. |
| 4 | Archive Duplicate Anomalies | Setting from Step 4. |
| 5 | Reactivate Recurring Anomalies | Setting from Step 4. |
| 6 | Auto Resolve Anomalies | Setting from Step 4 (Full scans only). |
| 7 | Maximum Record Anomalies per Check | The rollup threshold used. |
| 8 | Maximum Source Examples per Anomaly | How many source records were captured per anomaly. |
| 9 | Remediation Strategy | The remediation strategy applied. |
| 10 | Results | Opens the Scan Results modal for the operation. |
| 11 | Rerun | Replays the operation with the same configuration. |
| 12 | Delete | Removes the operation record from the Activity list. Anomalies and other downstream artifacts produced by the Run are preserved. |
For Success-with-Warning operations, the Rerun button is the typical next step after reviewing the Logs and fixing the underlying issue (for example, restoring partition key values that were null during this run).
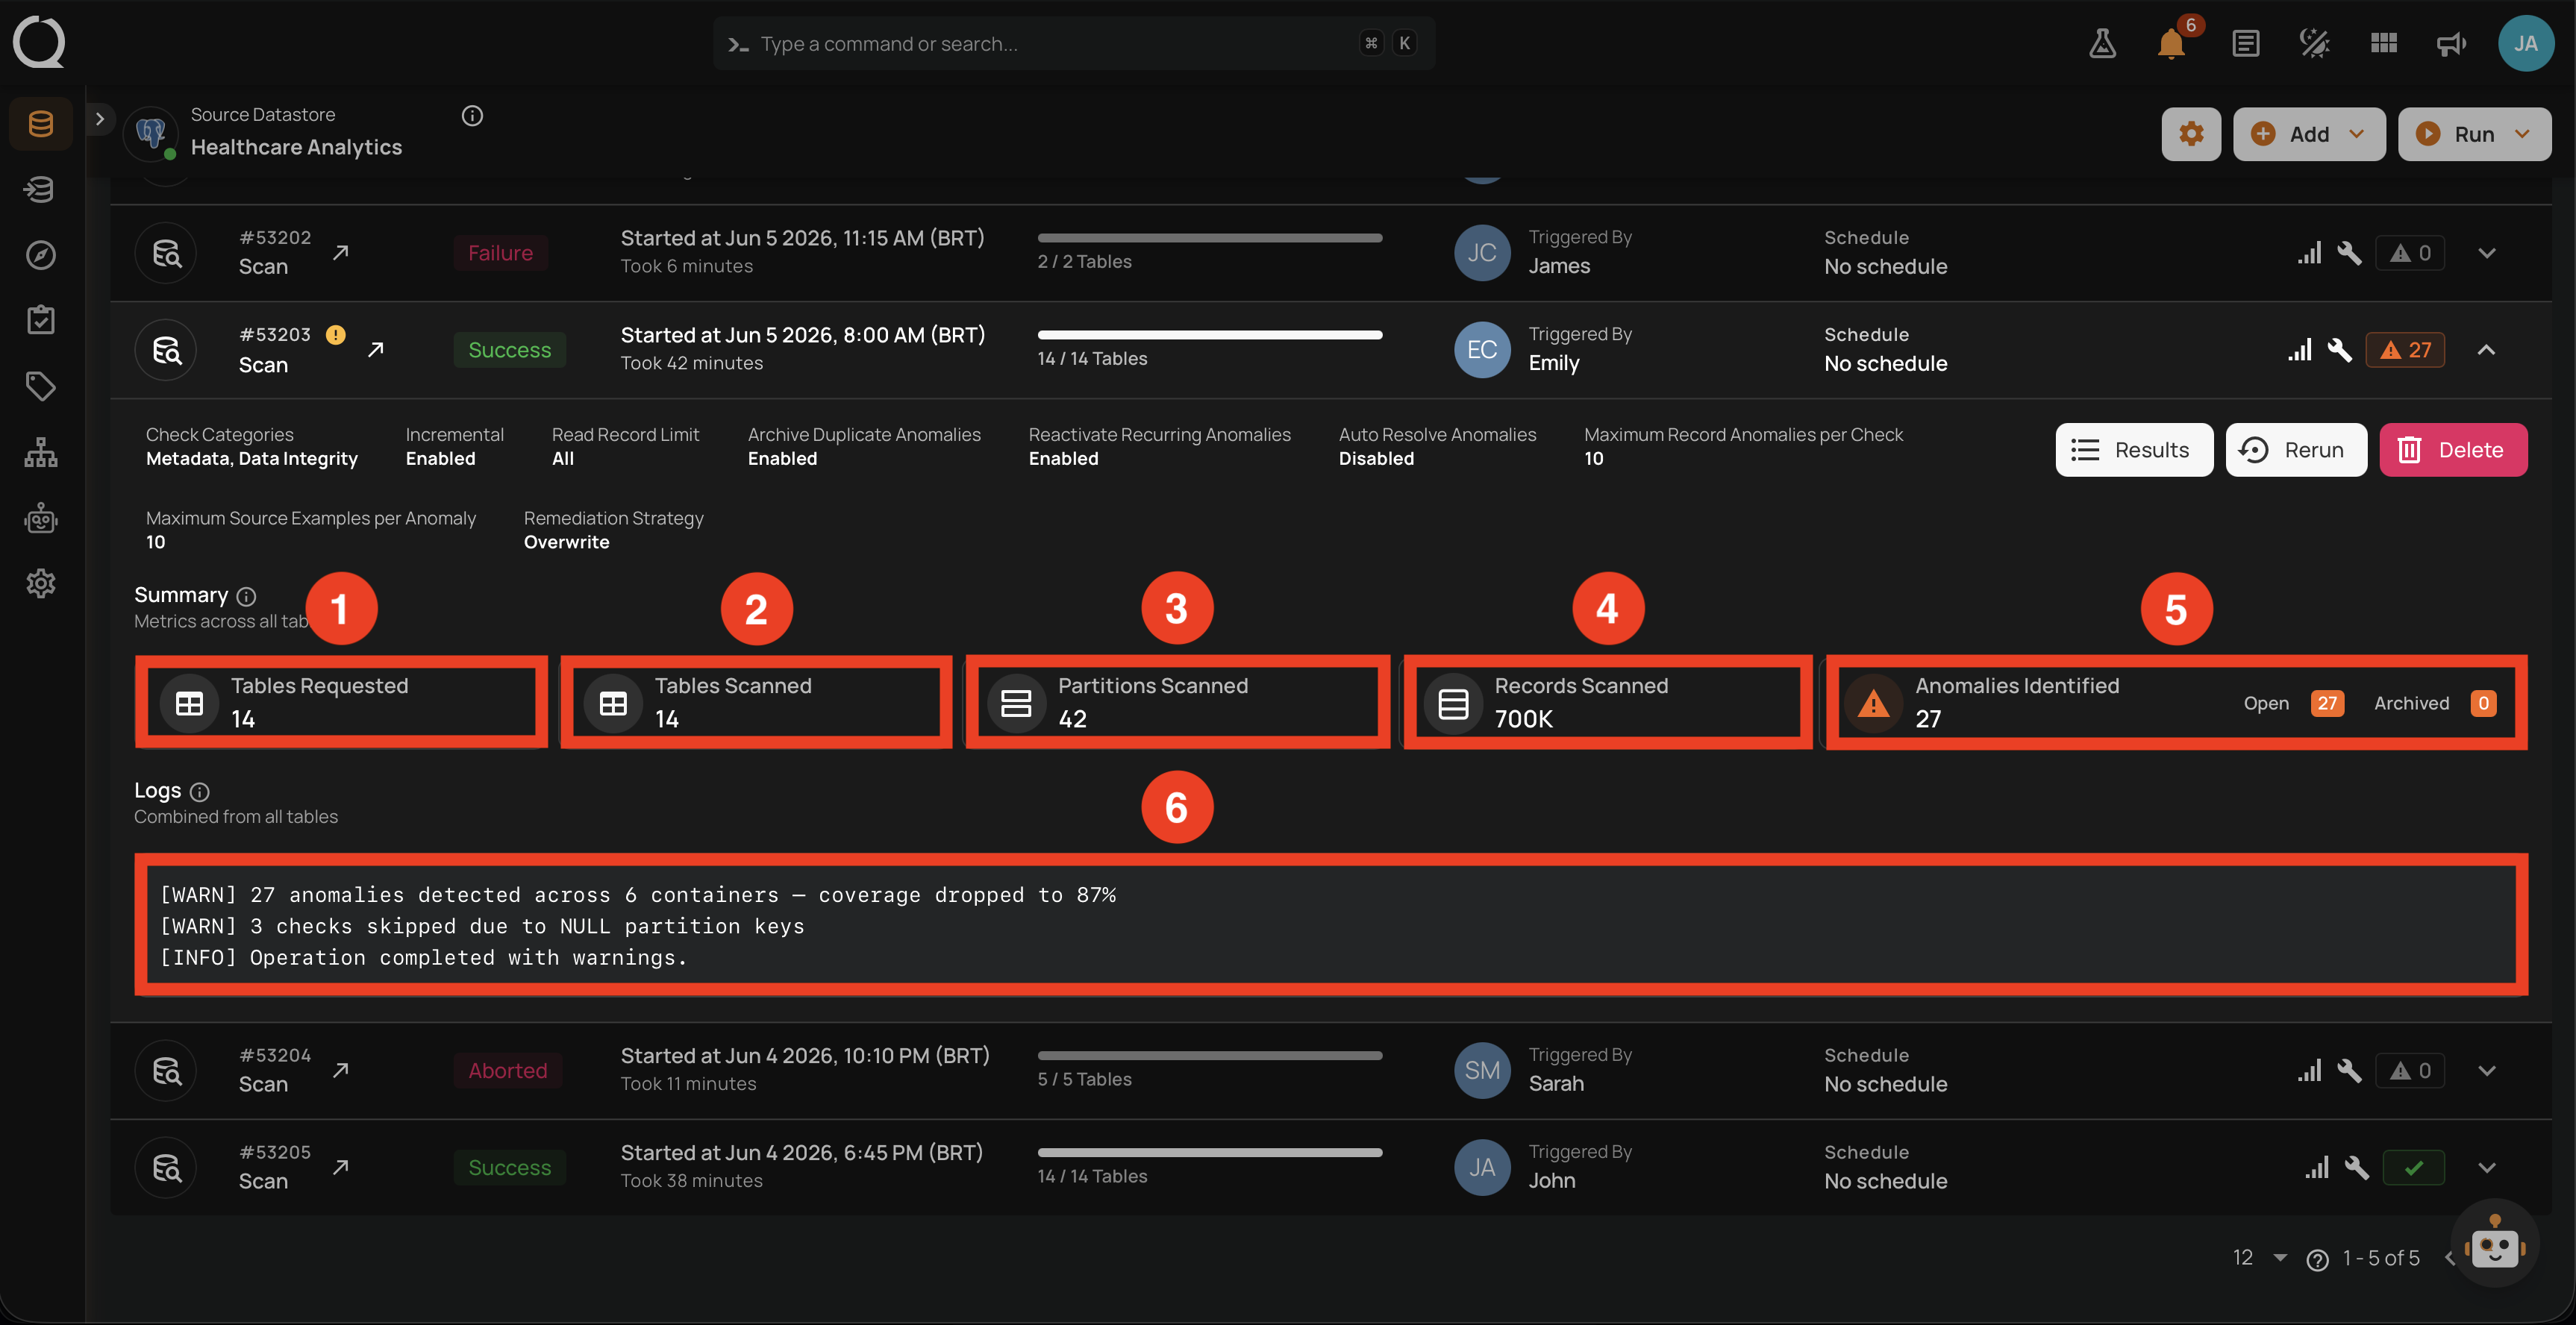
Summary and Logs
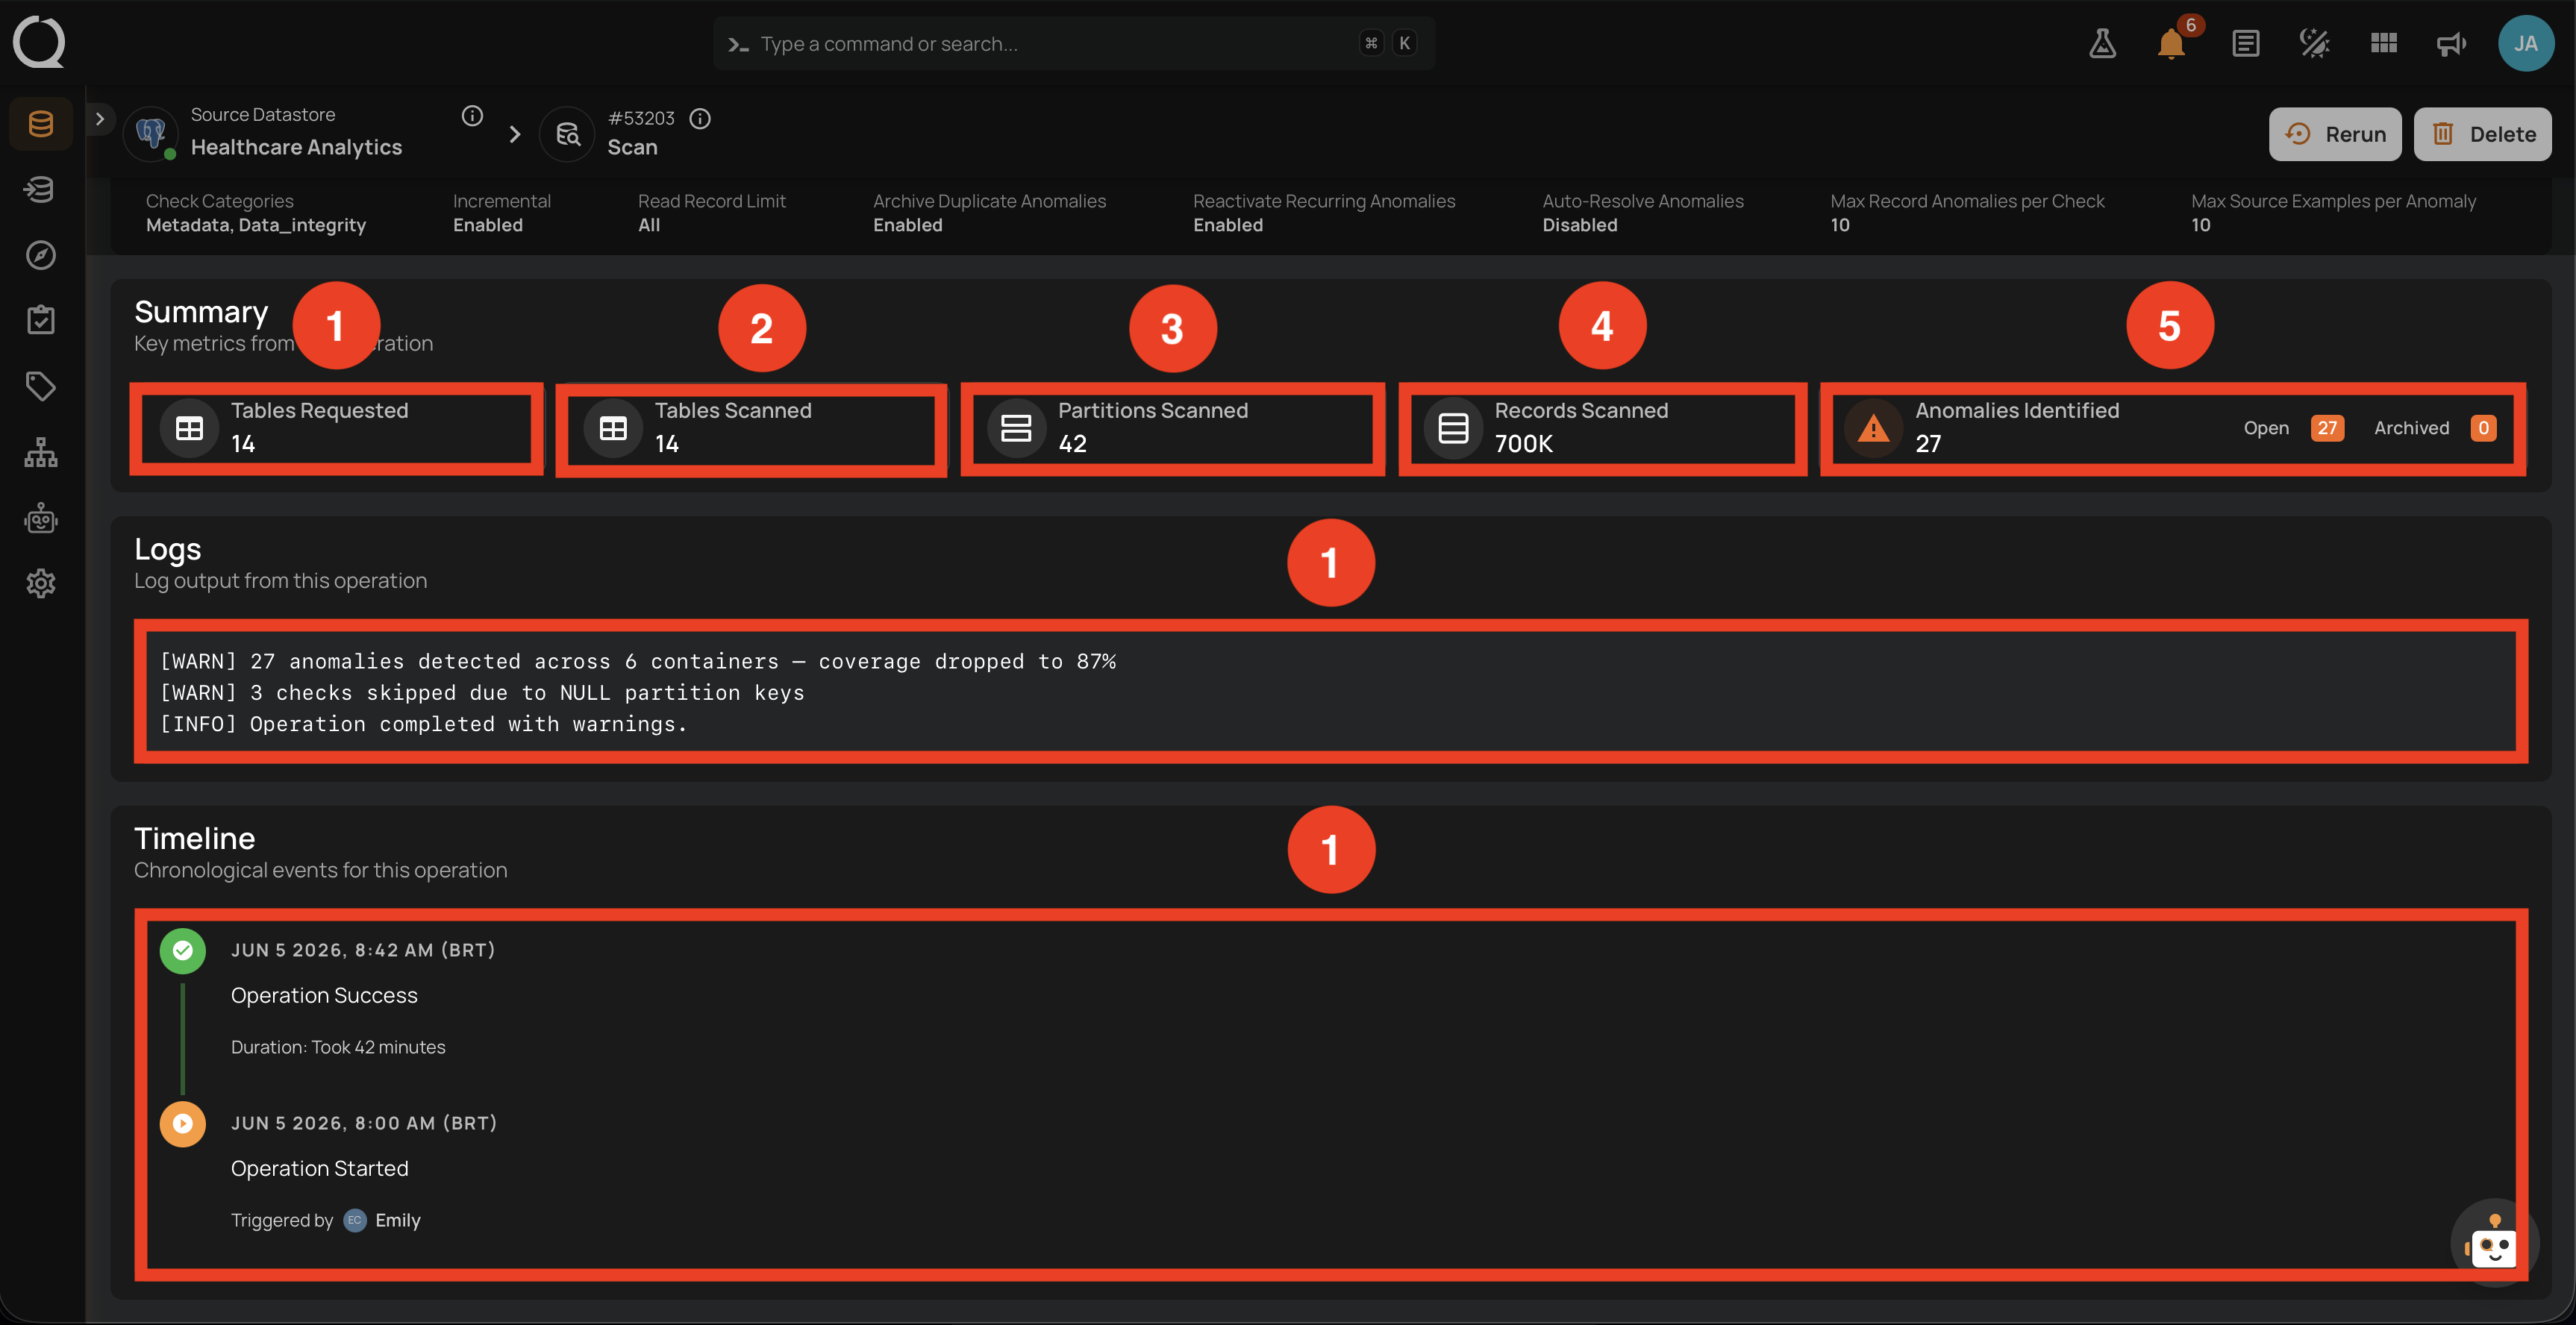
The Summary section reports the headline metrics for the run.
| No. | Element | What it shows |
|---|---|---|
| 1 | Tables Requested | Total containers targeted. |
| 2 | Tables Scanned | Total containers actually scanned. For Success-with-Warning runs, this may be lower than Tables Requested if some containers were skipped. |
| 3 | Partitions Scanned | Total partitions read across all scanned containers. |
| 4 | Records Scanned | Total records processed (formatted with K/M/B suffixes when large). |
| 5 | Anomalies Identified | Total anomalies detected, split into Open and Archived. |
| 6 | Logs block | Inline block listing every [WARN] and [INFO] message emitted during the run, in chronological order. The same block is surfaced on the operation detail page. |
The Logs block is what surfaces the Warning indicator next to the Run ID. Typical messages include anomaly-coverage drops below 100%, skipped partitions due to null keys, and container-level errors that did not propagate to a full failure.
The Logs explain why the run carries the Warning indicator. Review them before deciding whether to Rerun.
Operation detail page
Clicking the row opens the dedicated operation detail page, which has two top-level tabs: Overview and Results. The Overview tab presents the operation's properties, settings, headline metrics, log entries, and chronological timeline. The Results tab drills into each container scanned by the run.
Overview tab
The Overview tab opens with a snapshot of the run, organized into five blocks: Operation, Settings, Summary, Timeline, and Logs.
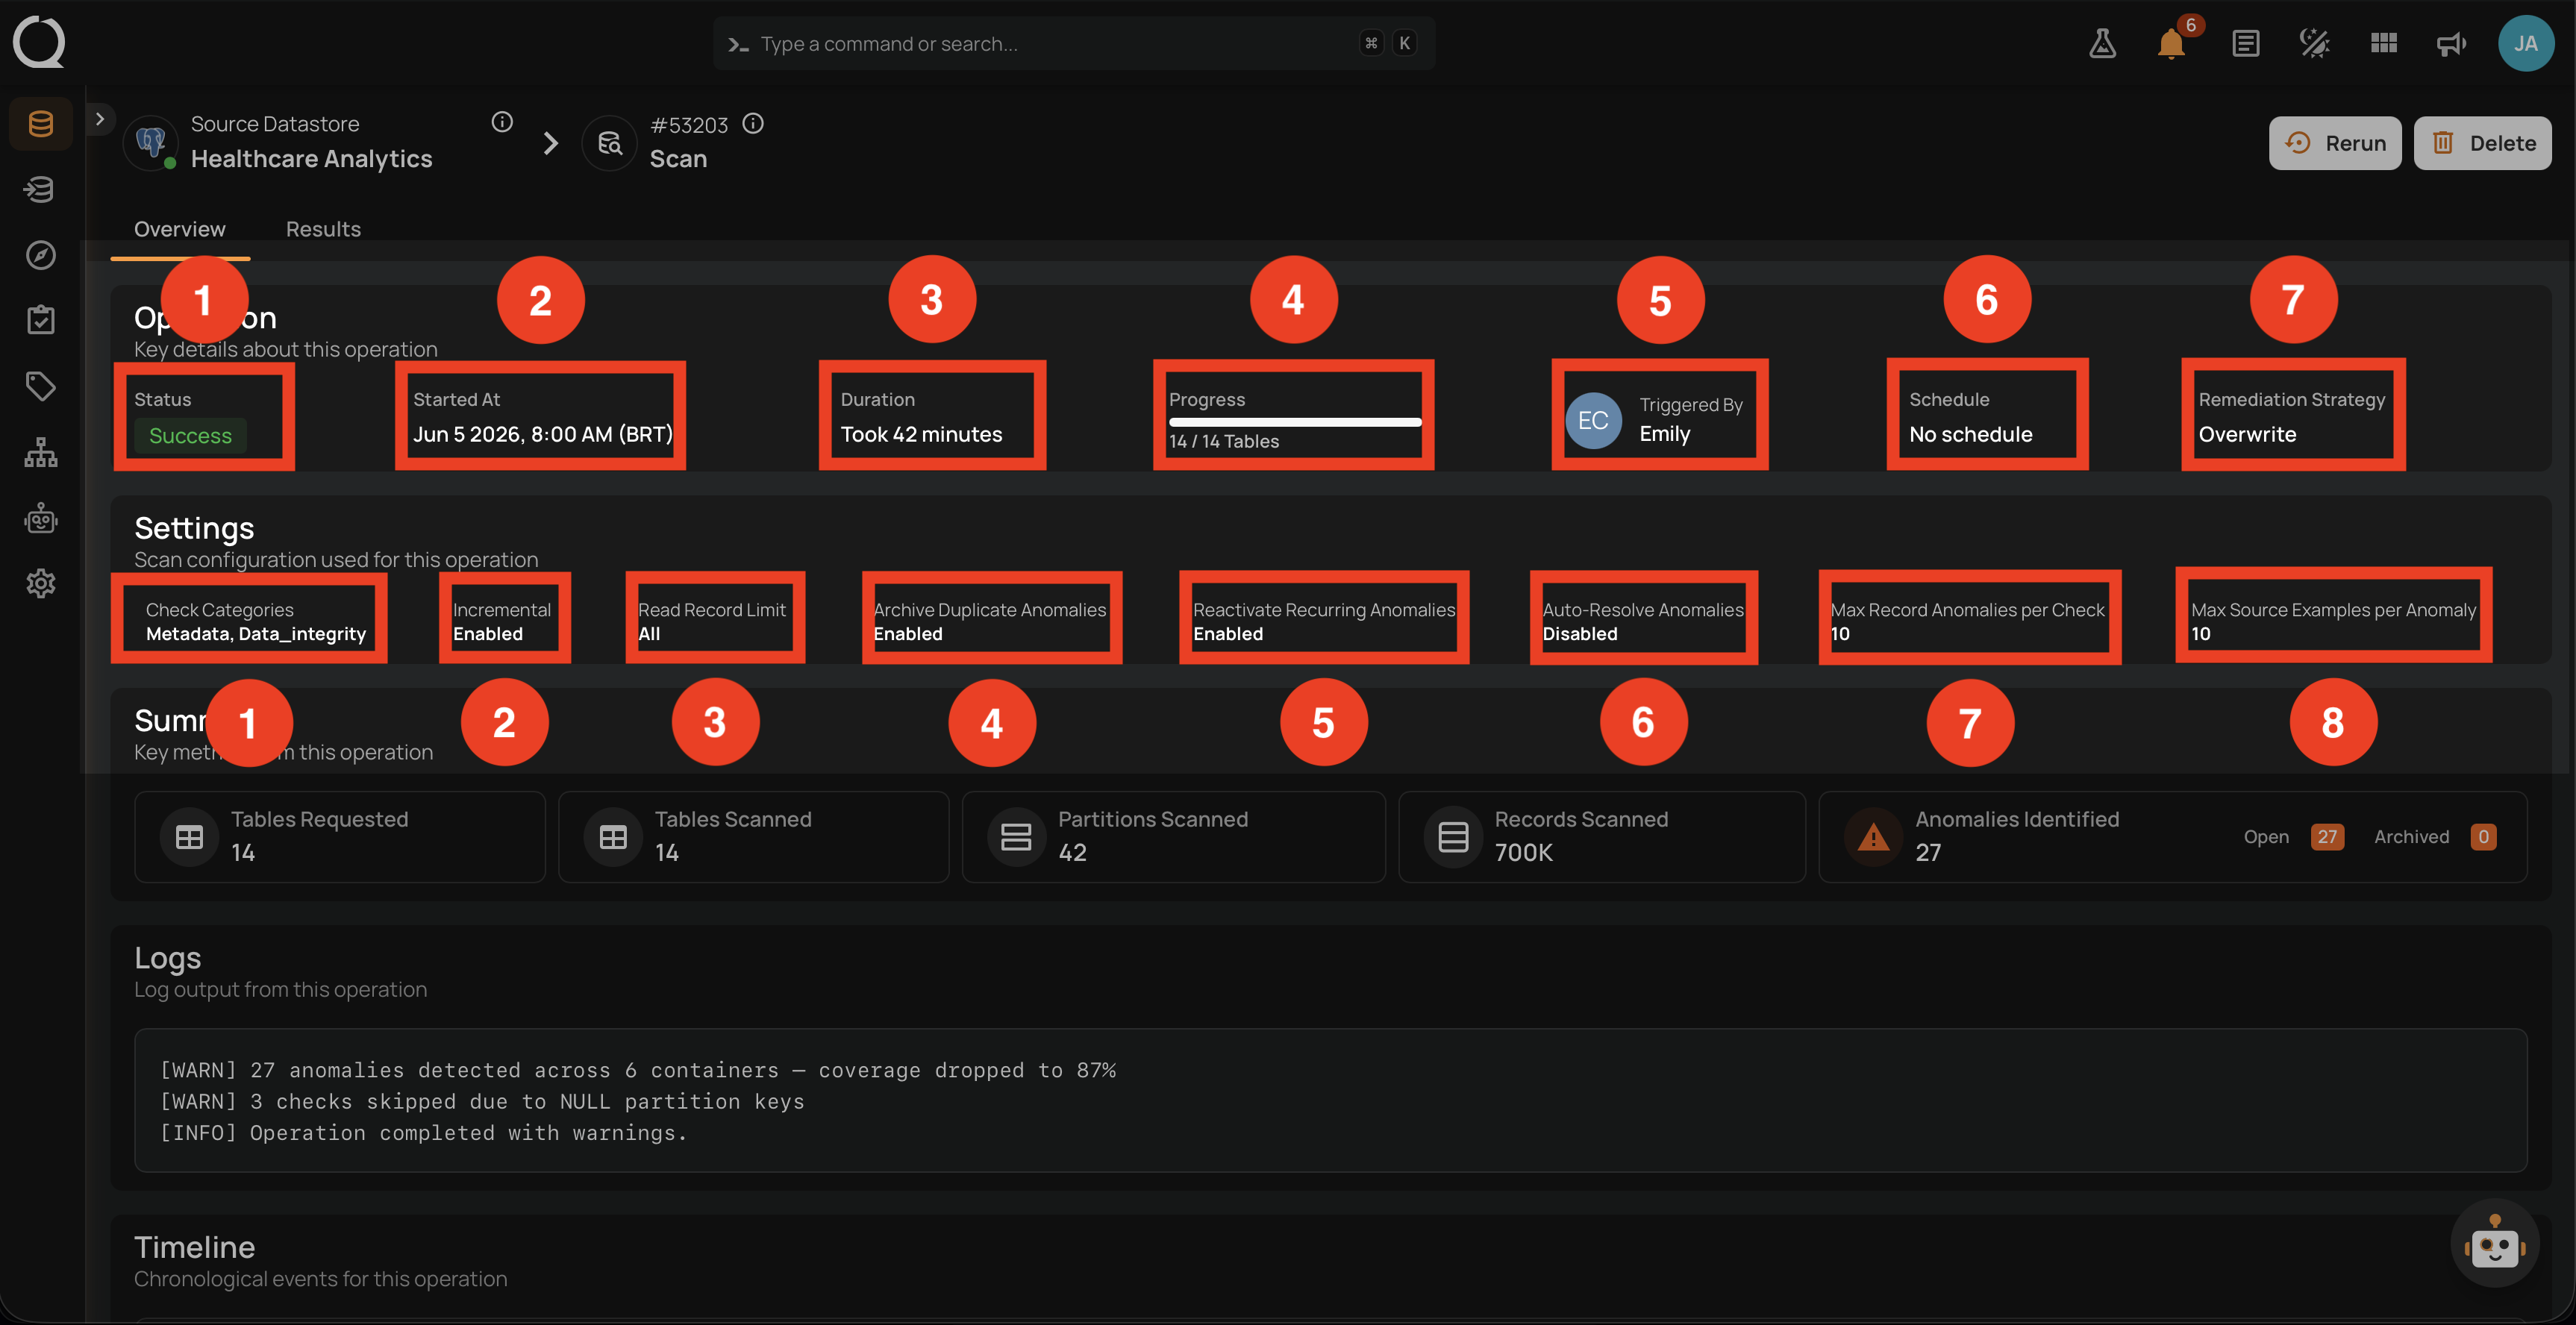
Operation block
The Operation block at the top carries the properties that summarize the run identity and outcome.
| No. | Element | What it shows |
|---|---|---|
| 1 | Status | The green Success badge with the indicator next to the Run ID. |
| 2 | Started At | Exact start timestamp. |
| 3 | Duration | How long the run lasted. |
| 4 | Progress | Containers processed against total requested. |
| 5 | Triggered By | User or schedule. |
| 6 | Schedule | The named schedule (or No schedule). |
| 7 | Remediation Strategy | Effective remediation strategy for the run. |
Settings block
The Settings block lists the scan settings used for the run (same fields as the row's Details section, minus the action buttons).
| No. | Setting | What it shows |
|---|---|---|
| 1 | Check Categories | Categories selected in Step 2 (for example, Metadata, Data_Integrity). |
| 2 | Incremental | Whether Incremental was the read strategy (Enabled/Disabled). |
| 3 | Read Record Limit | Per-container record cap (All if uncapped). |
| 4 | Archive Duplicate Anomalies | Setting from Step 4 (Enabled/Disabled). |
| 5 | Reactivate Recurring Anomalies | Setting from Step 4. |
| 6 | Auto-Resolve Anomalies | Setting from Step 4 (Full scans only). |
| 7 | Max Record Anomalies per Check | Rollup threshold used. |
| 8 | Max Source Examples per Anomaly | Source examples cap used. |
Together, the Operation and Settings blocks act as the canonical "what happened" snapshot of the run. If the operation looks wrong, this is the first place to check the inputs.
Summary block
Scrolling down on the Overview tab shows the Summary block, which repeats the row's metrics.
| No. | Element | What it shows |
|---|---|---|
| 1 | Tables Requested | Total containers targeted. |
| 2 | Tables Scanned | Total containers actually scanned. |
| 3 | Partitions Scanned | Total partitions read. |
| 4 | Records Scanned | Total records processed. |
| 5 | Anomalies Identified | Open and Archived counters. |
Timeline block
The Timeline lists every event recorded for the operation, in reverse chronological order. Each entry follows the same structure.
| Part | Element | What it shows |
|---|---|---|
| Status icon | Marker on the left | A marker colored by event type. See the legend below. |
| Timestamp | Date and time | When the event was recorded, in the viewer's timezone (for example, JUN 5 2026, 11:29 AM (BRT)). Sorted from most recent at the top to oldest at the bottom. |
| Event title | Short label | The event identity (for example, Operation Started, Operation Success, Container scan completed). |
| Event detail | Context line | Additional information specific to the event: duration, the user who triggered the operation, the container name involved, or other event-specific data. |
Timeline icon legend:
- Operation Success terminal entry.
- Operation Failure terminal entry.
- Operation Aborted terminal entry.
- Operation In Progress (Queued or Running, animated in the UI).
- Operation Started.
- Per-container entries inherit the same icon and color based on each container's own outcome (Success/Failure/Aborted/Running).
For a Success-with-Warning scan, the typical events are:
Operation Successat the top, with the total duration.Container scan completedentries for each container that finished.Operation Startedat the bottom, withTriggered by <user>.
Warning reasons appear in the Logs block (below the Timeline), not in the Timeline itself.
Logs block
The Logs block surfaces the same messages from the row summary, in a wider full-screen-friendly view. Each log line has the following structure.
| Part | Element | What it shows |
|---|---|---|
| Severity tag | [WARN], [INFO], or [ERROR] |
Severity of the log line. Success-with-Warning operations typically emit [WARN] for the non-fatal issues that surfaced the Warning indicator, and [INFO] for status confirmations such as "Operation completed with logs." |
| Message | Human-readable text | The narrative explaining what the platform encountered. Examples: "27 anomalies detected across 6 containers; coverage dropped to 87%", "3 checks skipped due to NULL partition keys", "Operation completed with warnings." |
| Order | Position in the block | Lines are listed in chronological order from top (earliest) to bottom (most recent), mirroring the event sequence visible on the Timeline. |
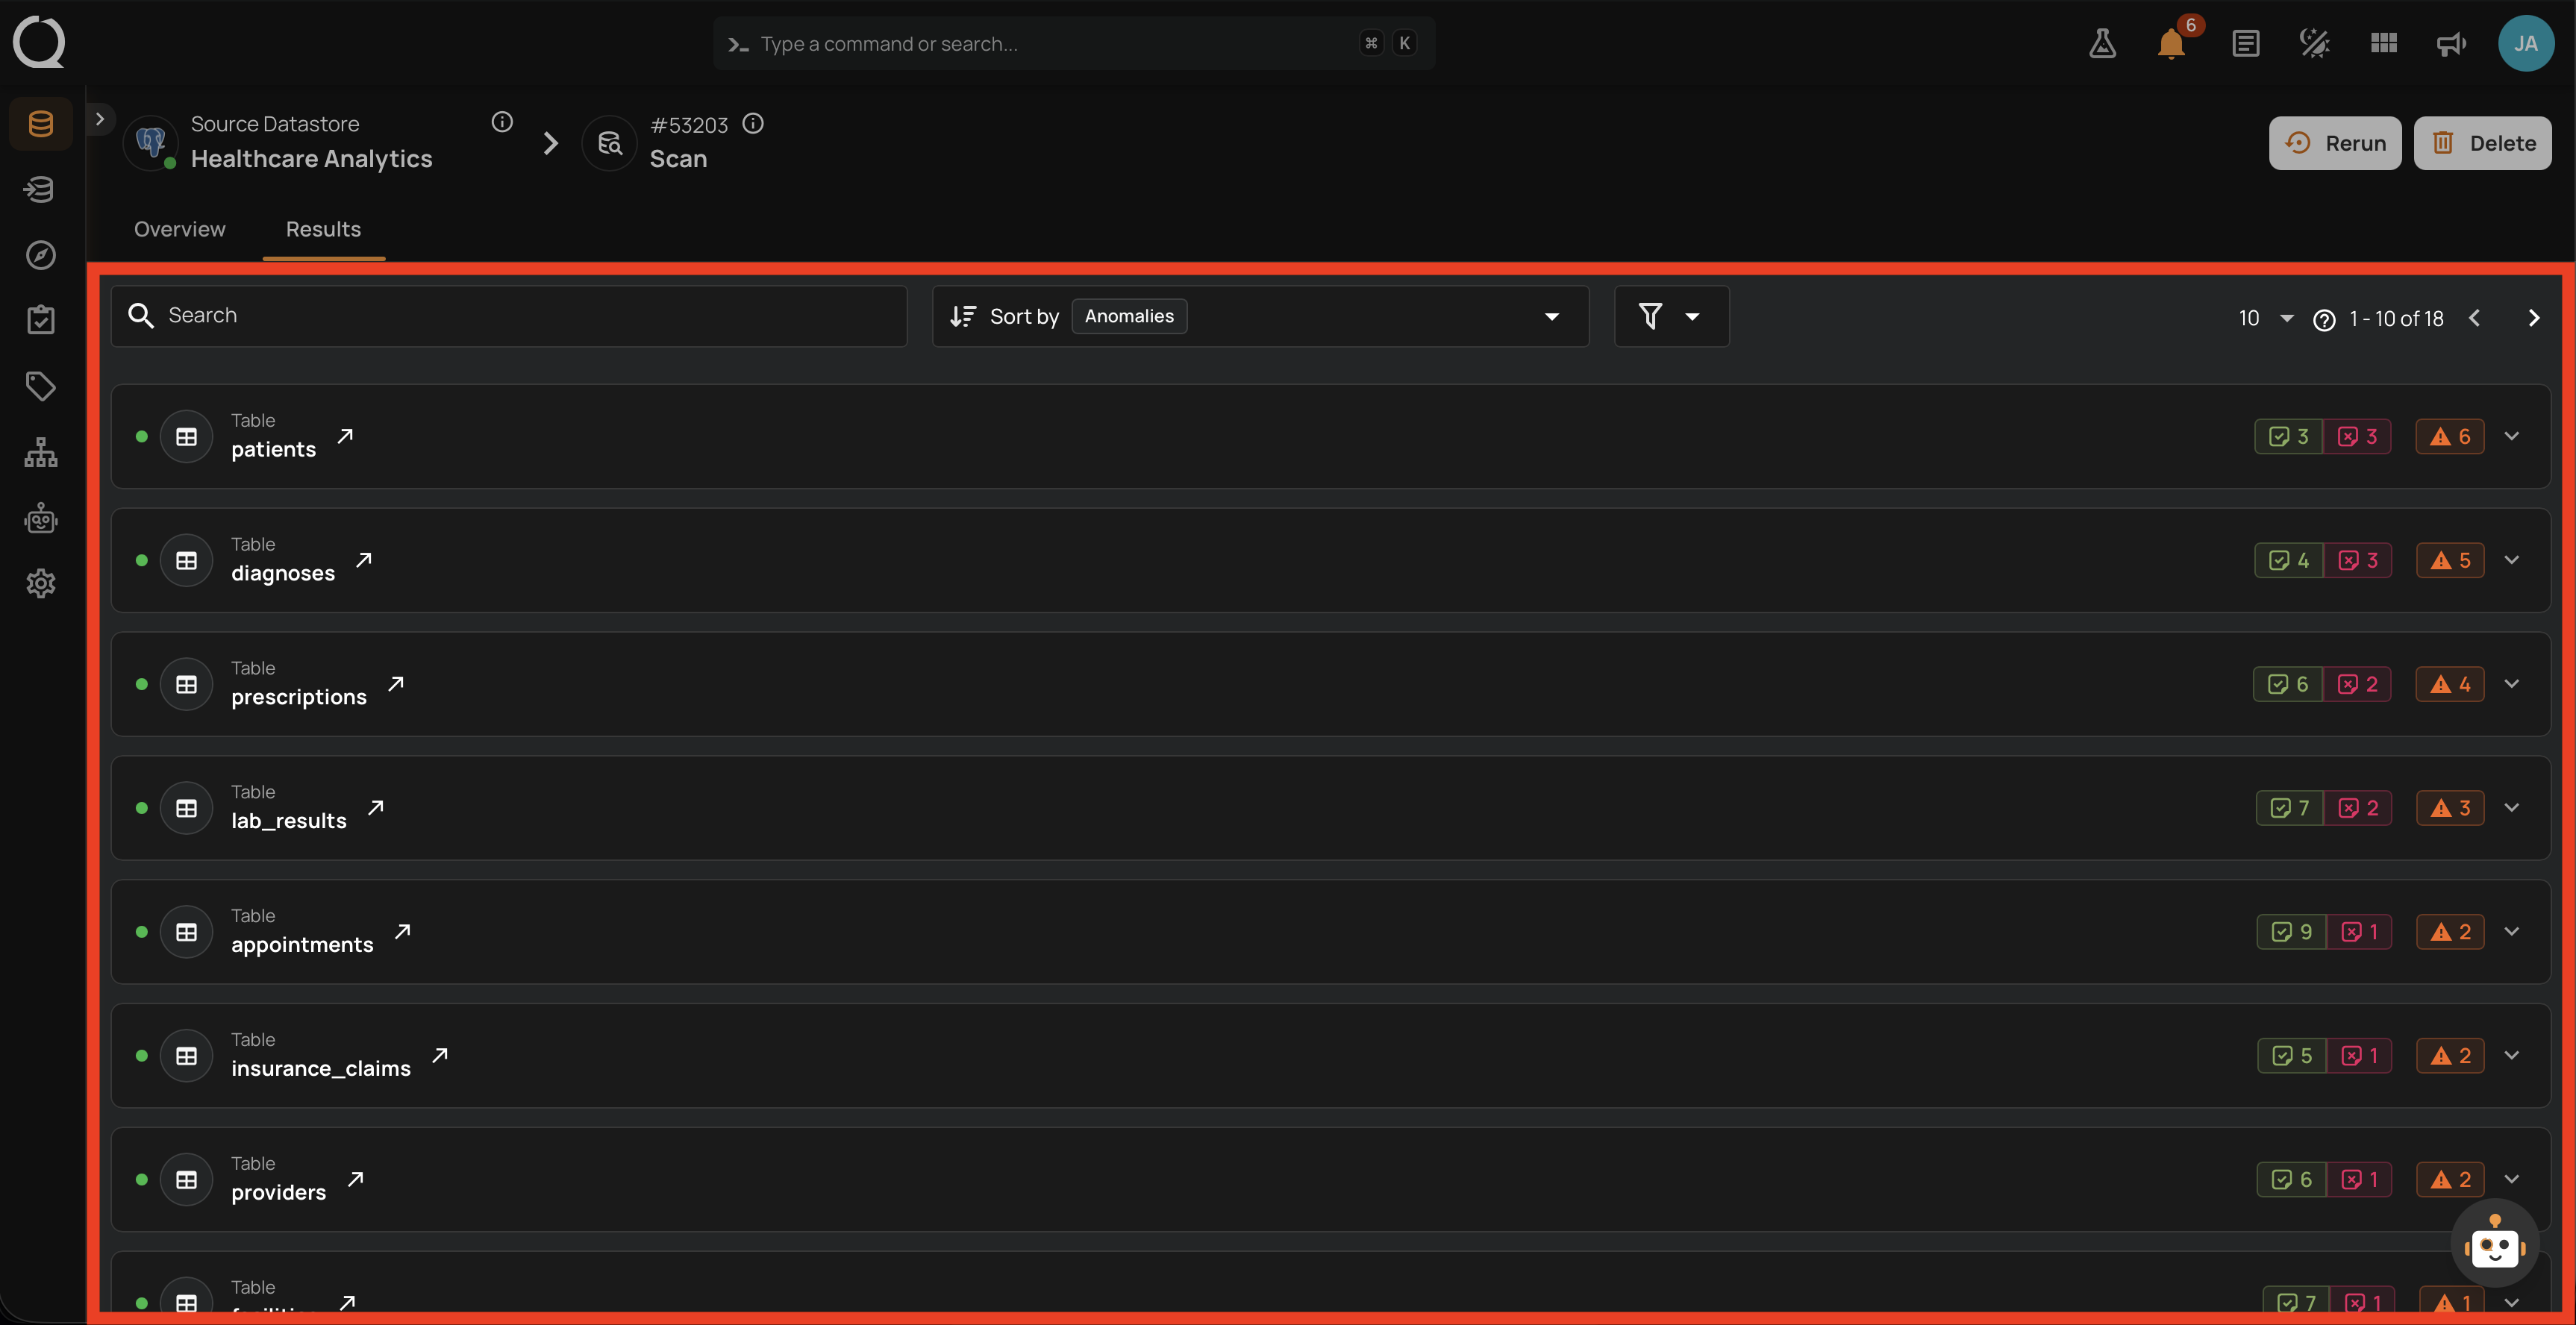
Results tab
The Results tab lists every container scanned by this Success-with-Warning operation. Each row links to the container's detail page.
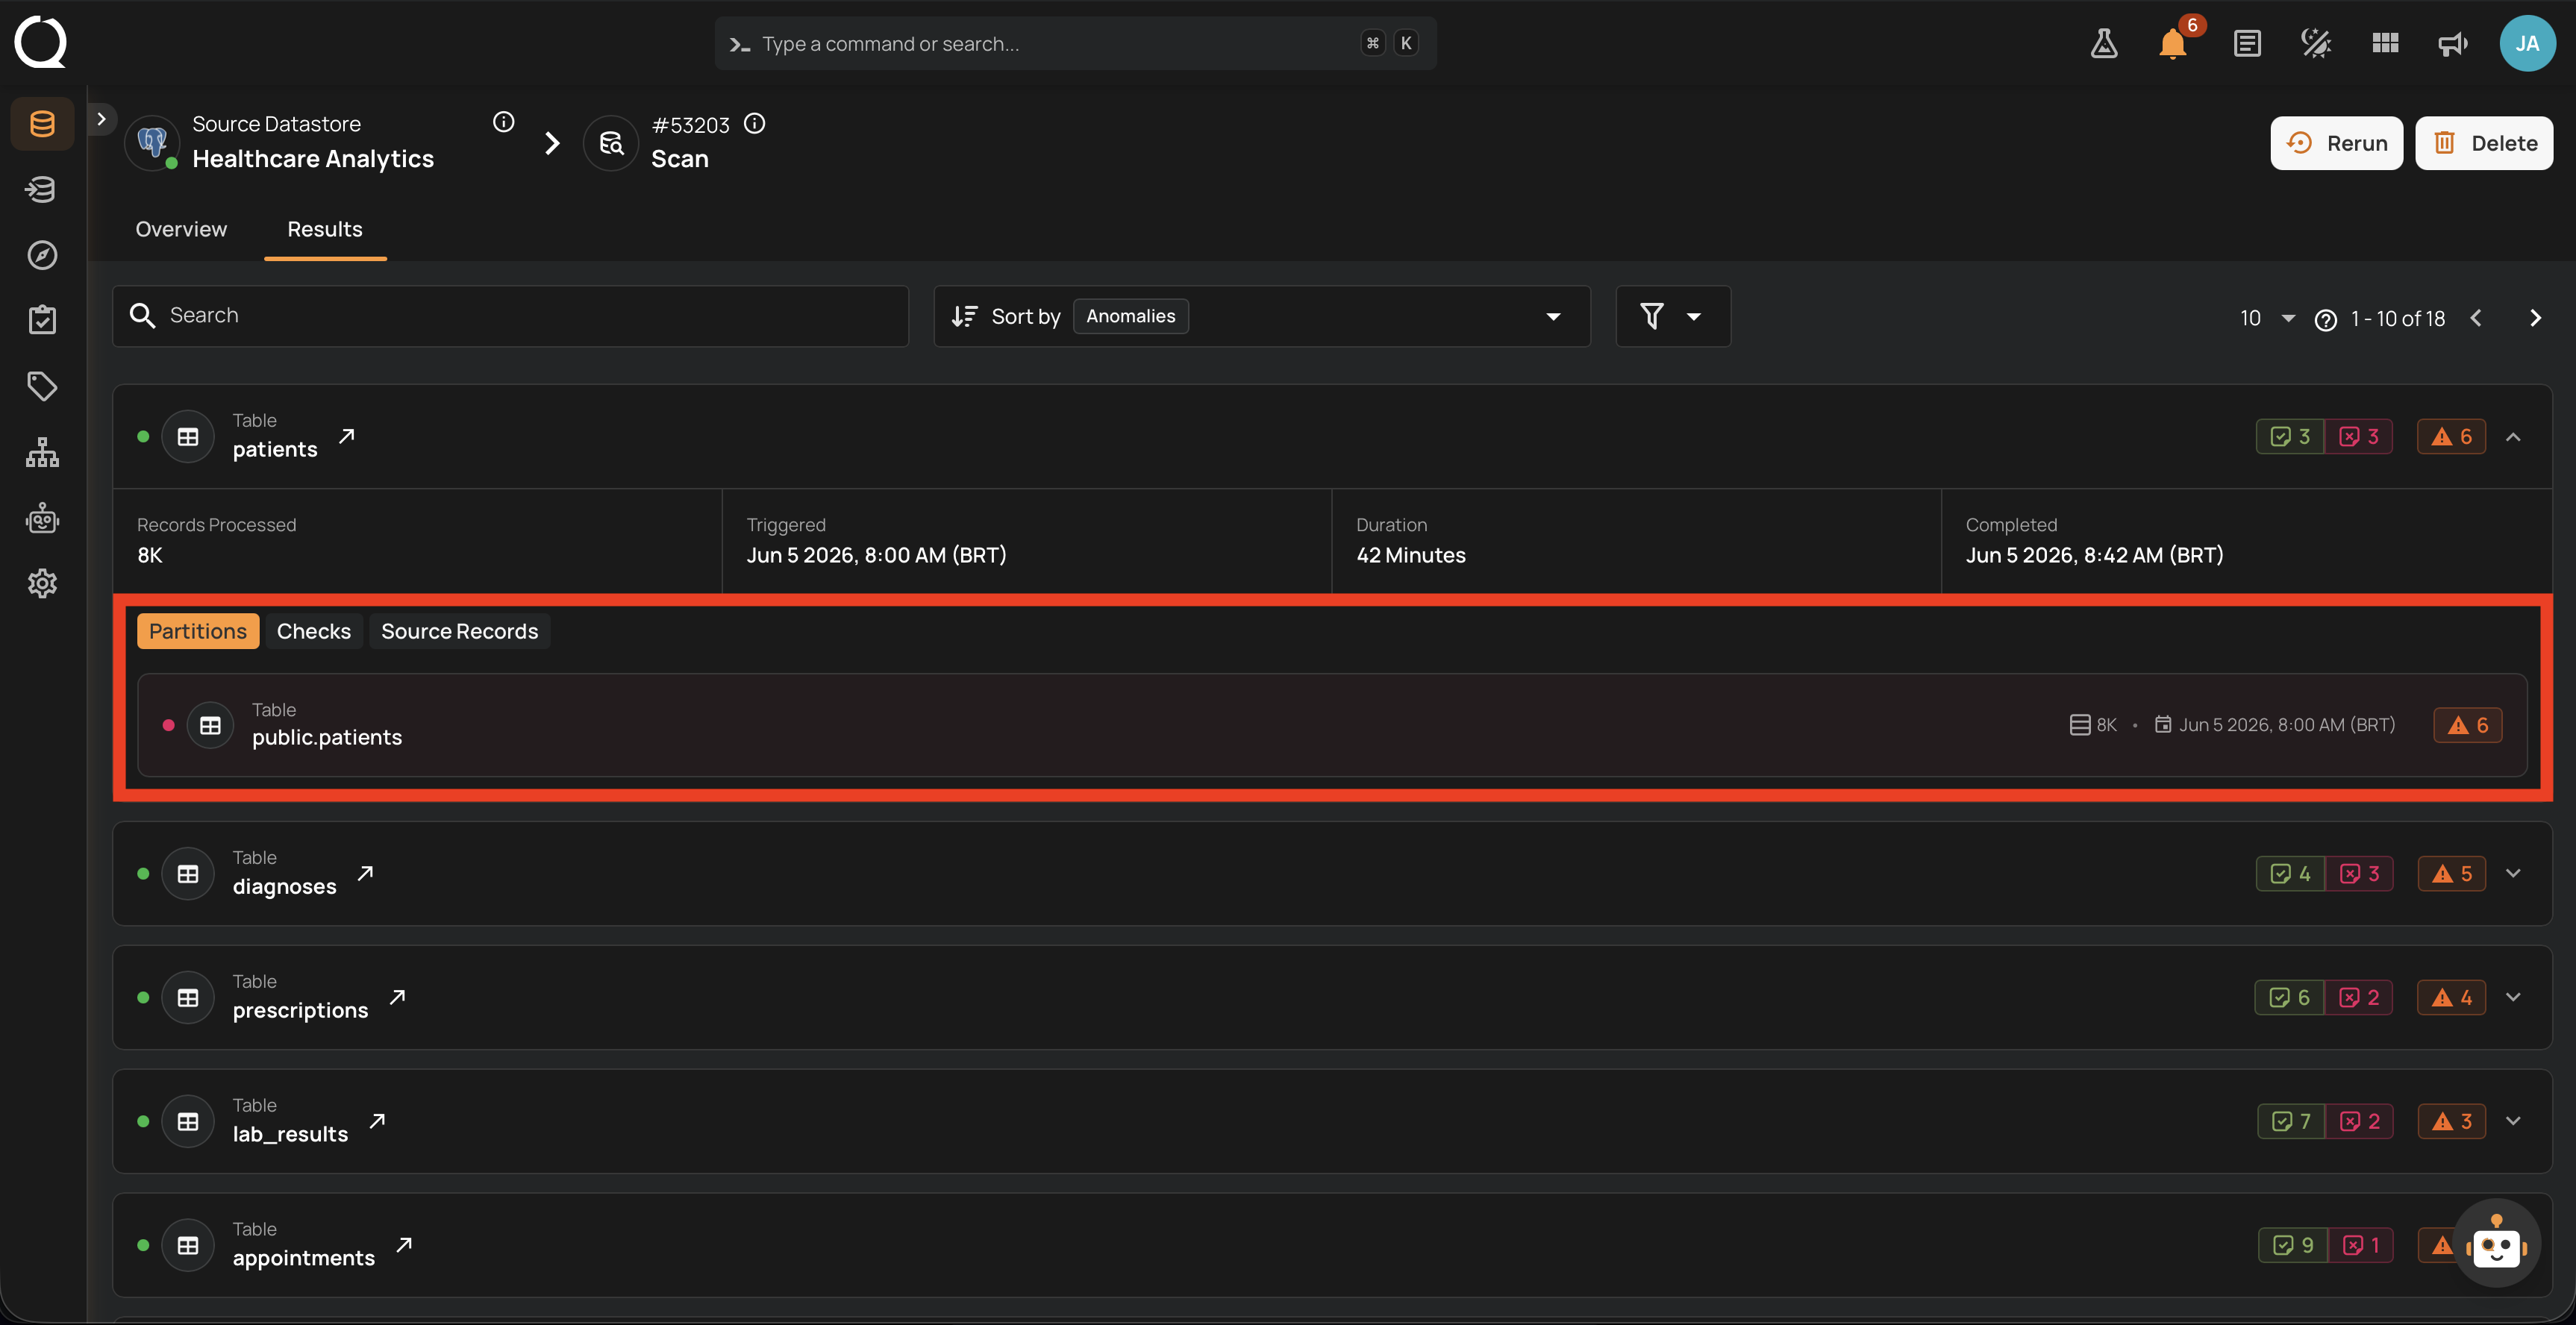
Container sub-tabs
Expanding a container row reveals three sub-tabs that drill into the per-container results.
Partitions
Lists every partition read for this container, with size, read timestamp, completion time, and per-partition counters (records processed, anomalies emitted). Use this view to confirm coverage when a container is processed across many partitions, especially after a Success-with-Warning run where the Logs may have flagged skipped partitions. The partition list loads on demand when the sub-tab opens and is paginated, and a toolbar above the list adds a search box and status filters (All, Passed, Failed) so you can jump straight to the partitions that need attention. The toolbar is hidden for JDBC containers, which scan as a single partition.
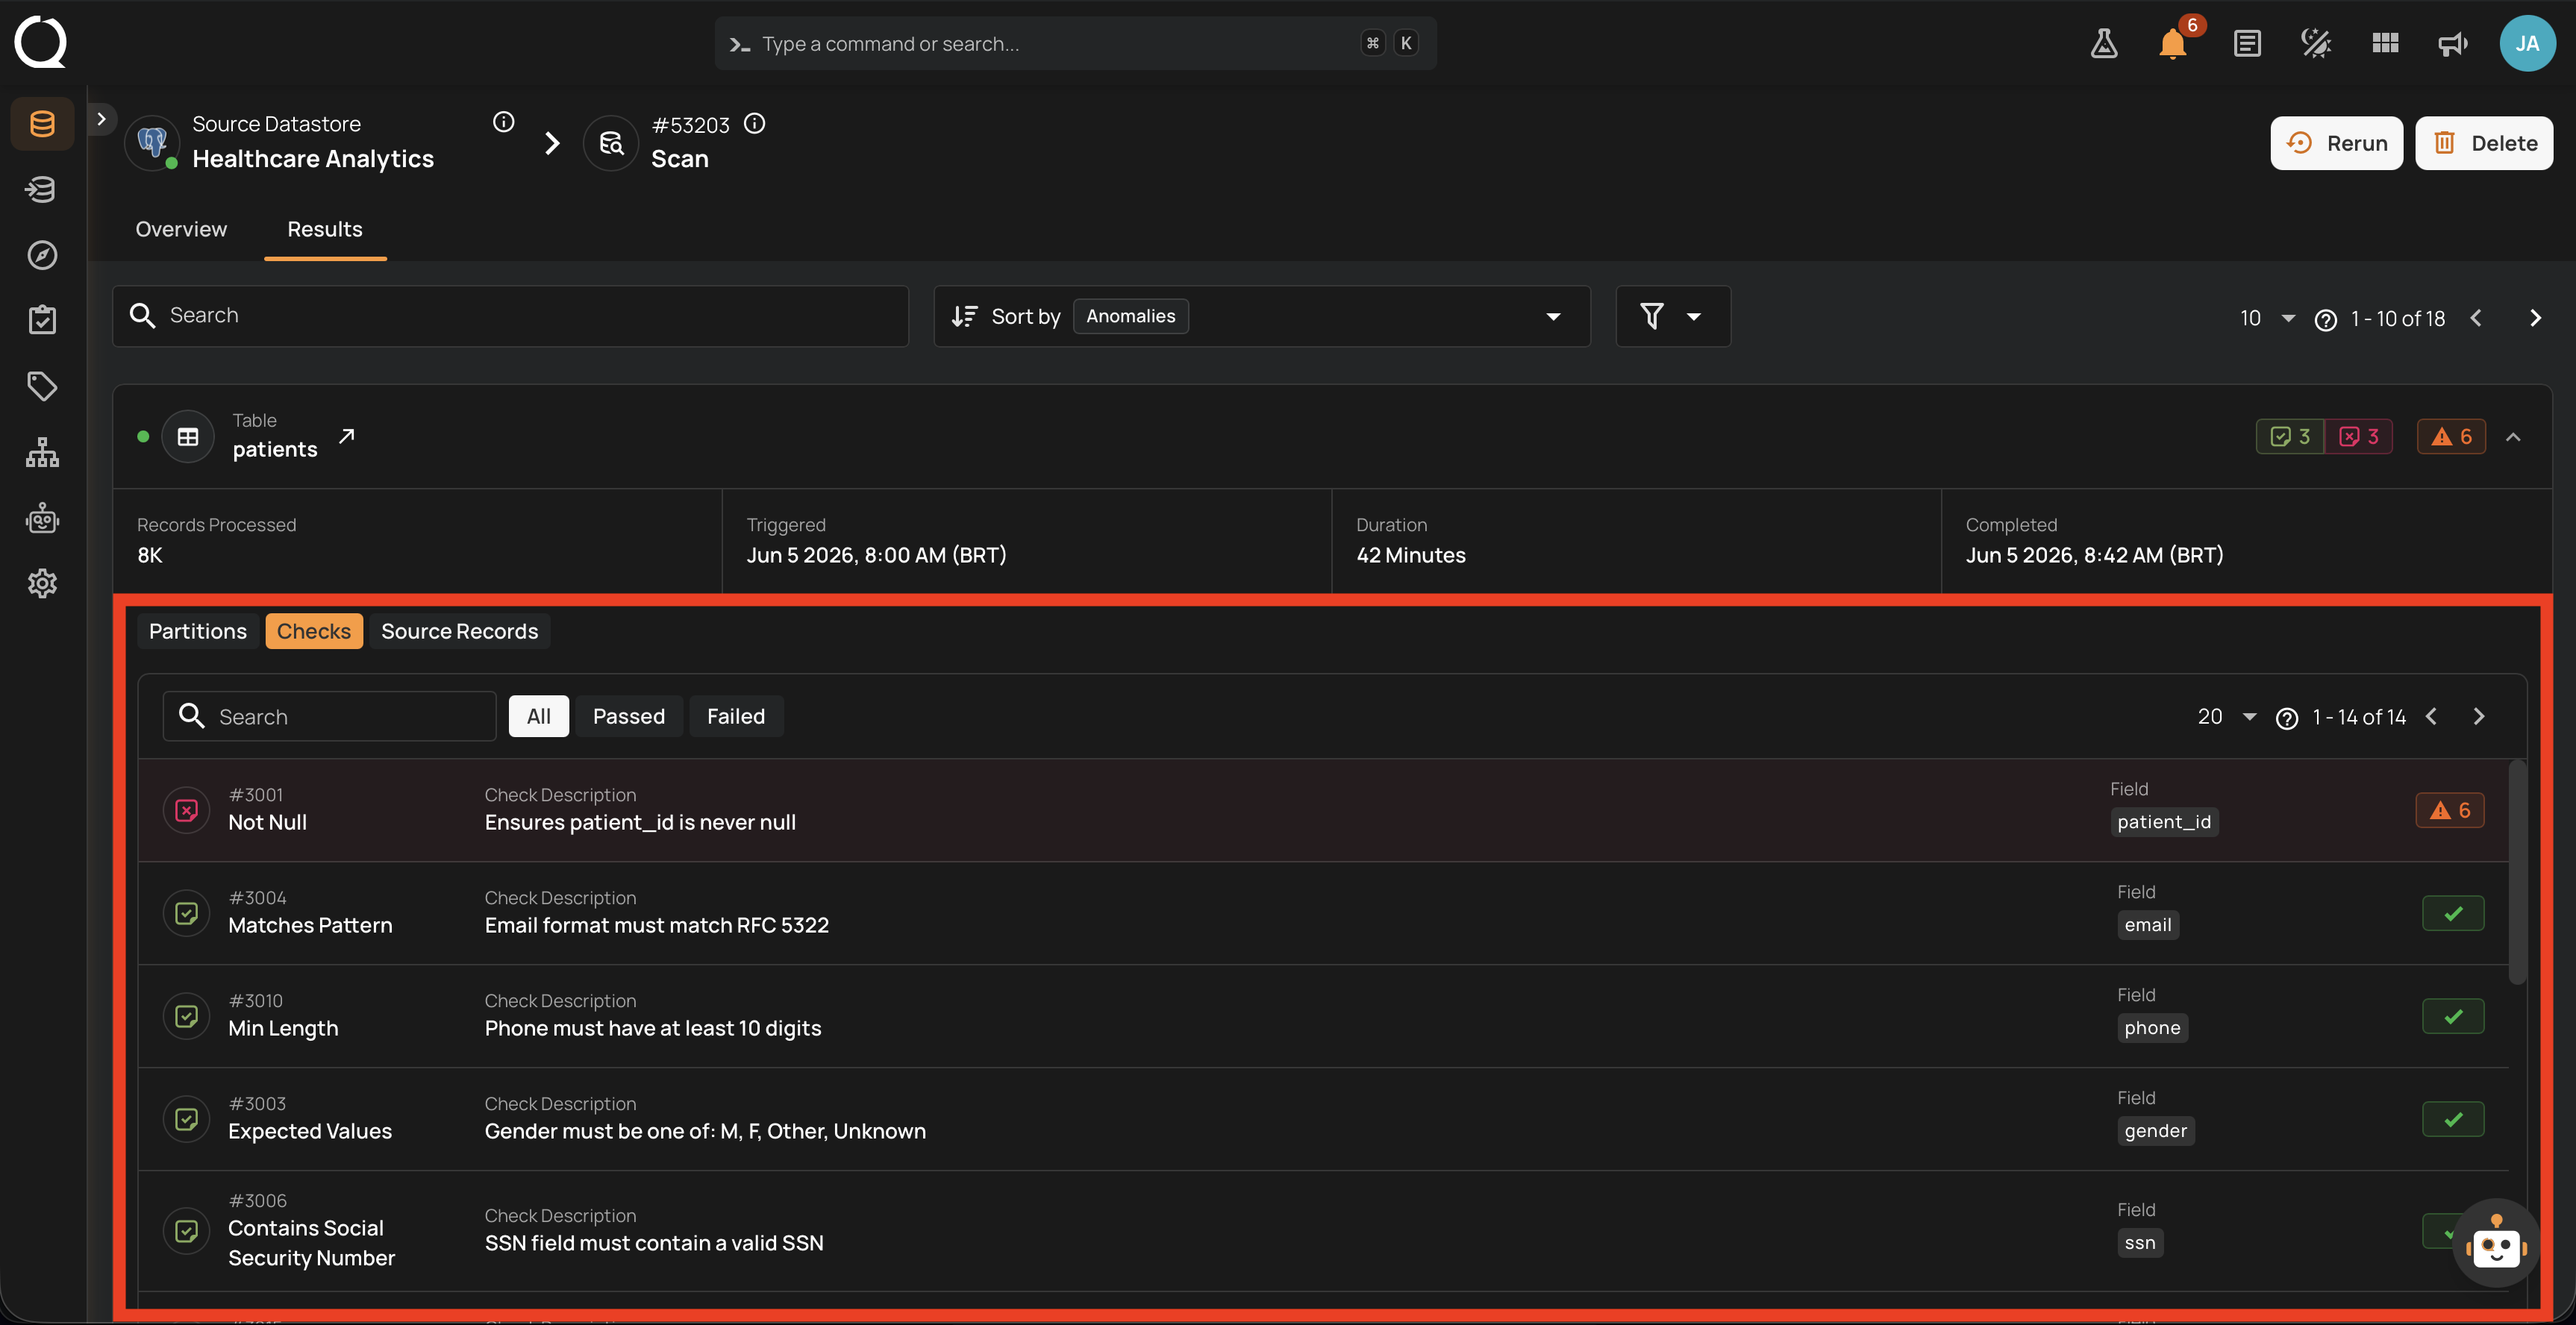
Checks
Lists every check that was asserted against this container, with check ID, name, description, target field, and pass/fail status. A toolbar above the list provides a search box and status filters (All, Passed, Failed) so you can focus on the checks that did not pass. This is the most actionable view: it tells you exactly which expectations broke on this container during this scan.
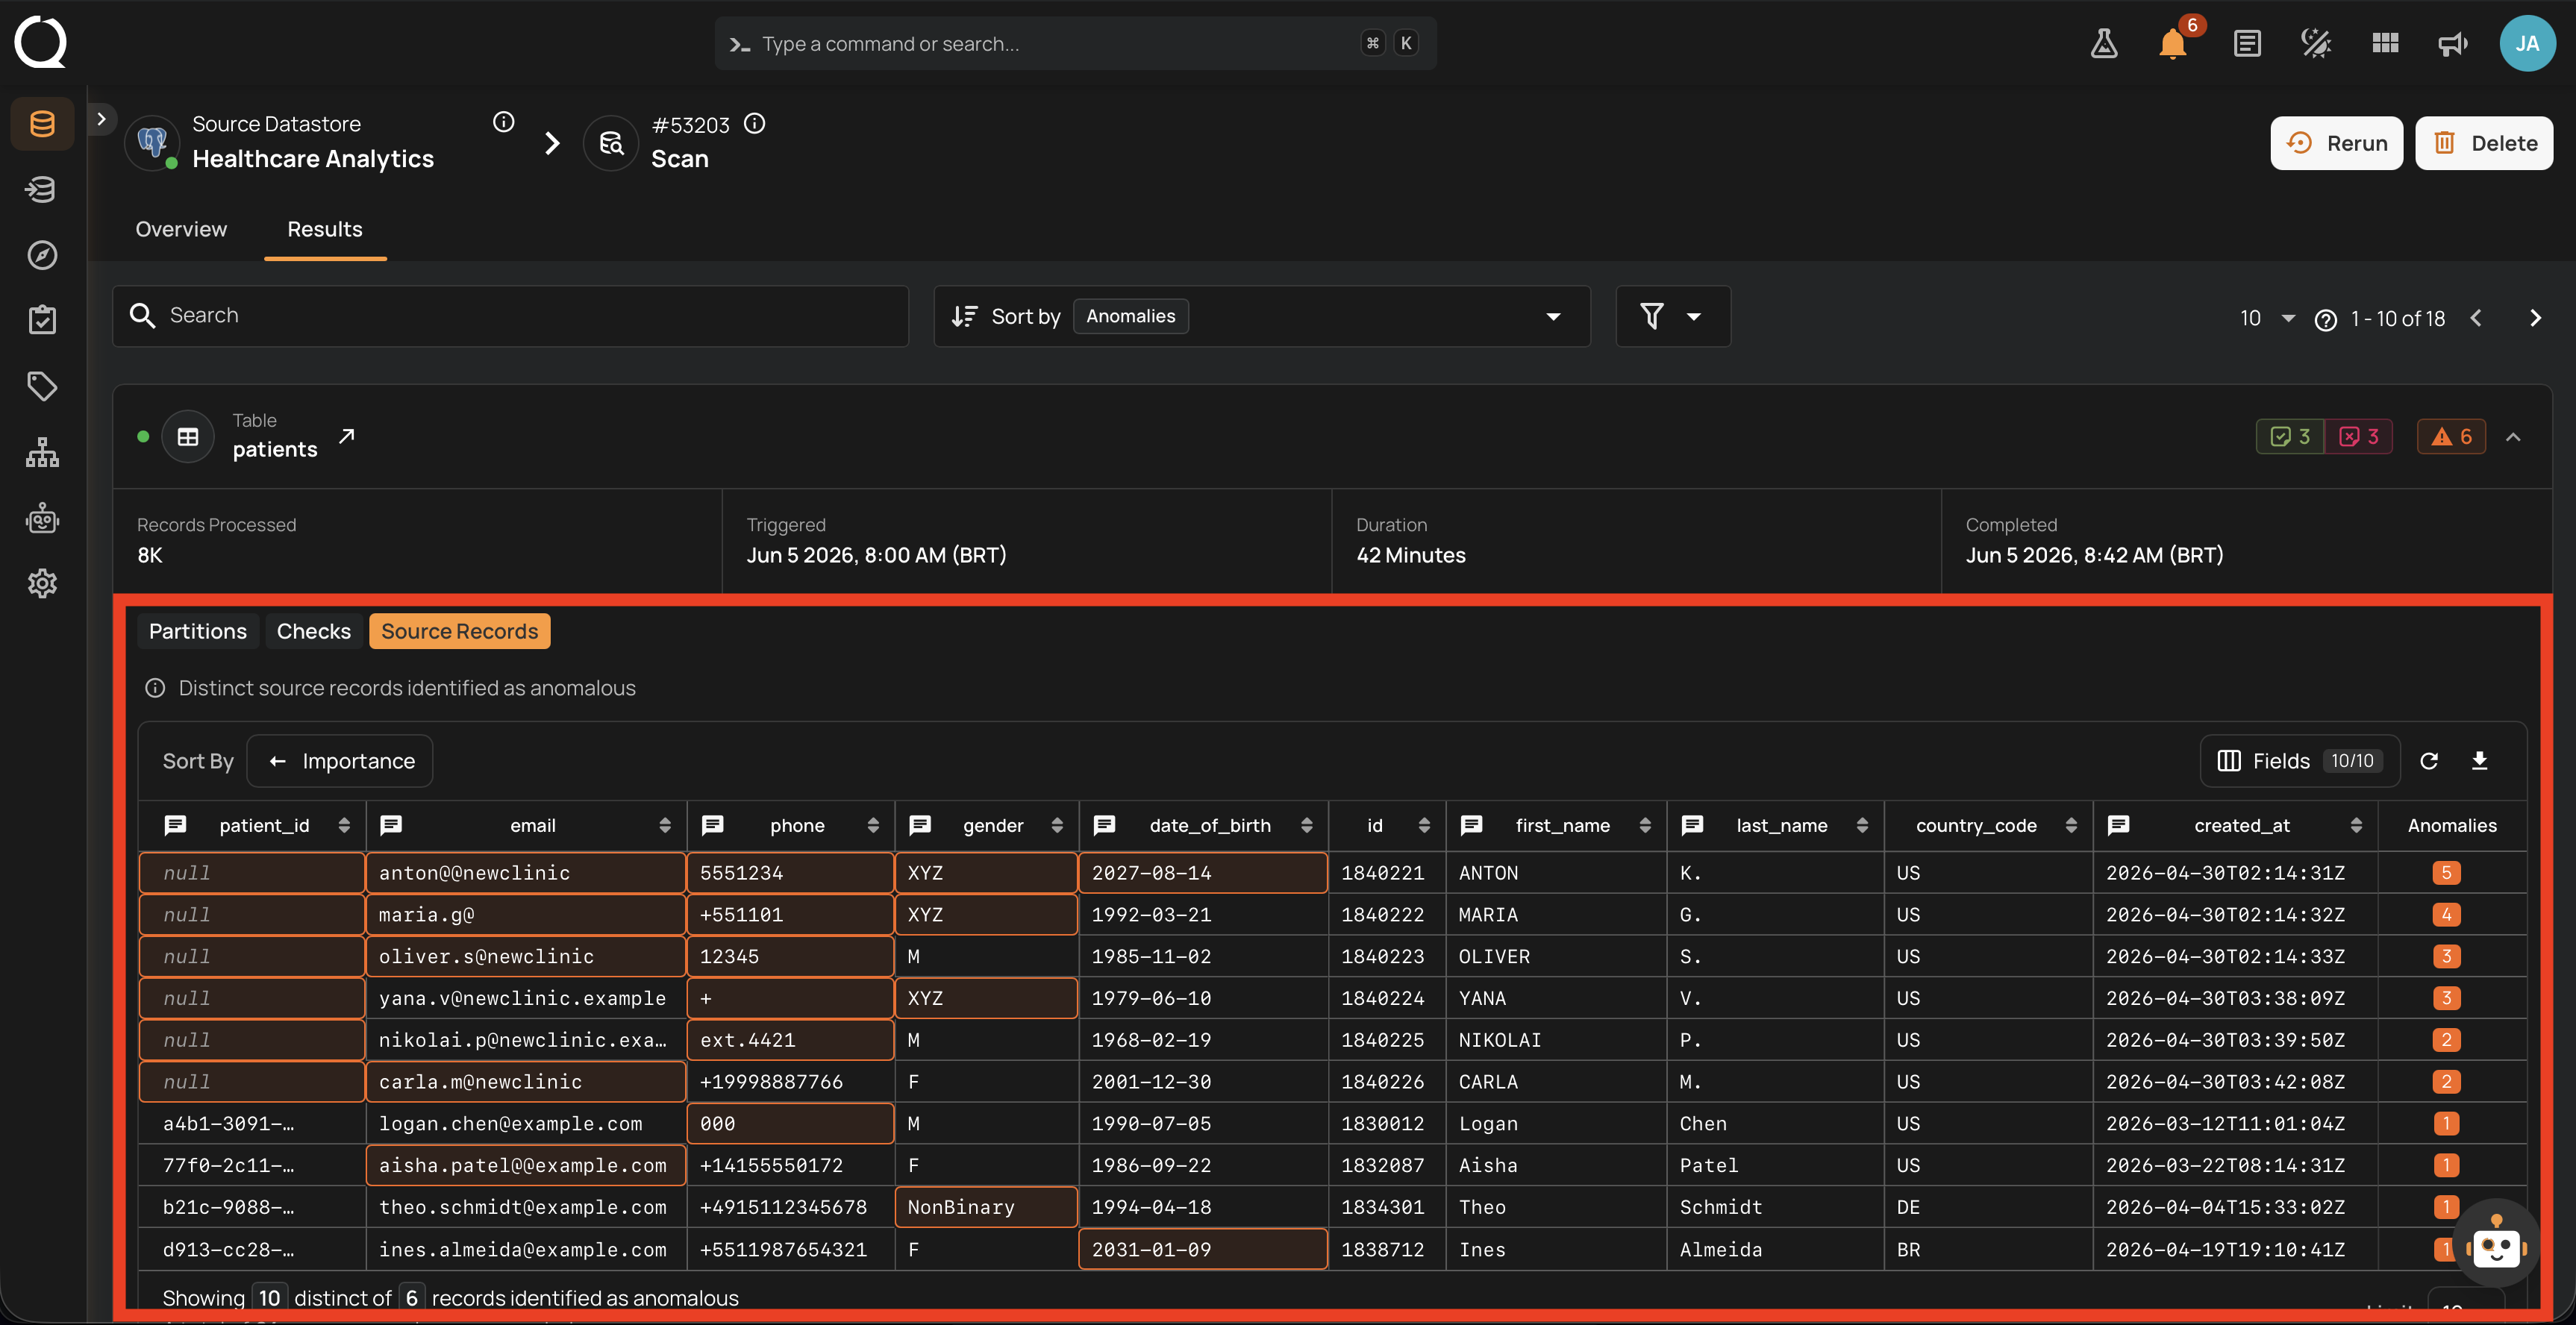
Source Records
Lists the distinct source records identified as anomalous for this container. Each row is a distinct record with a counter of how many anomalies are tied to it, and the same anomaly can appear on multiple records. The empty state reads "No source records available for this container scan" when nothing was captured. Records are bounded by the Maximum Source Examples per Anomaly cap set in Step 4. Use the toolbar to Sort By any field, toggle Field visibility, Reveal masked values (when masked fields are present and you have permission), Refresh the table, or Download the records for offline analysis.
See also
-
Success
The Run finished cleanly with full results.
-
Failure
The Run stopped because of an unrecoverable error.
-
Aborted
A user or the system stopped the Run before completion.
-
Running
A worker is actively processing the Run; counters update live.
-
Queued
The Run is registered but no worker has picked it up yet.
-
Lifecycle
State diagram, transitions, and per-operation-type lifecycle.
-
Available Actions
Abort, Resume, Rerun, and Delete: when each one is shown.