Data Preview
Data Preview in Qualytics makes it easy for users to view and understand their container data. It provides a clear snapshot of the data's structure and contents, showing up to 100 rows from the source. With options to filter specific data, refresh for the latest updates, and download records, it helps users focus on the most relevant information, troubleshoot issues, and analyze data effectively. The simple grid view ensures a smooth and efficient way to explore and work with your data.
Let’s get started 🚀
Navigation
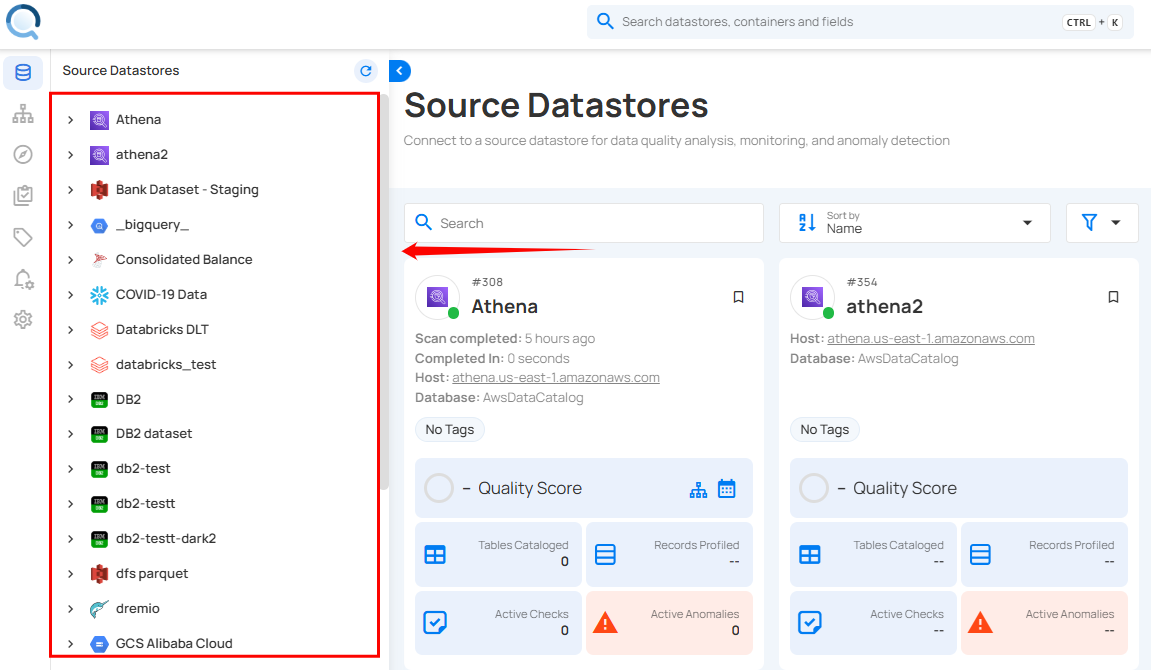
Step 1: Log in to your Qualytics account and select the source datastore (JDBC or DFS) from the left menu that contains the data you want to preview.
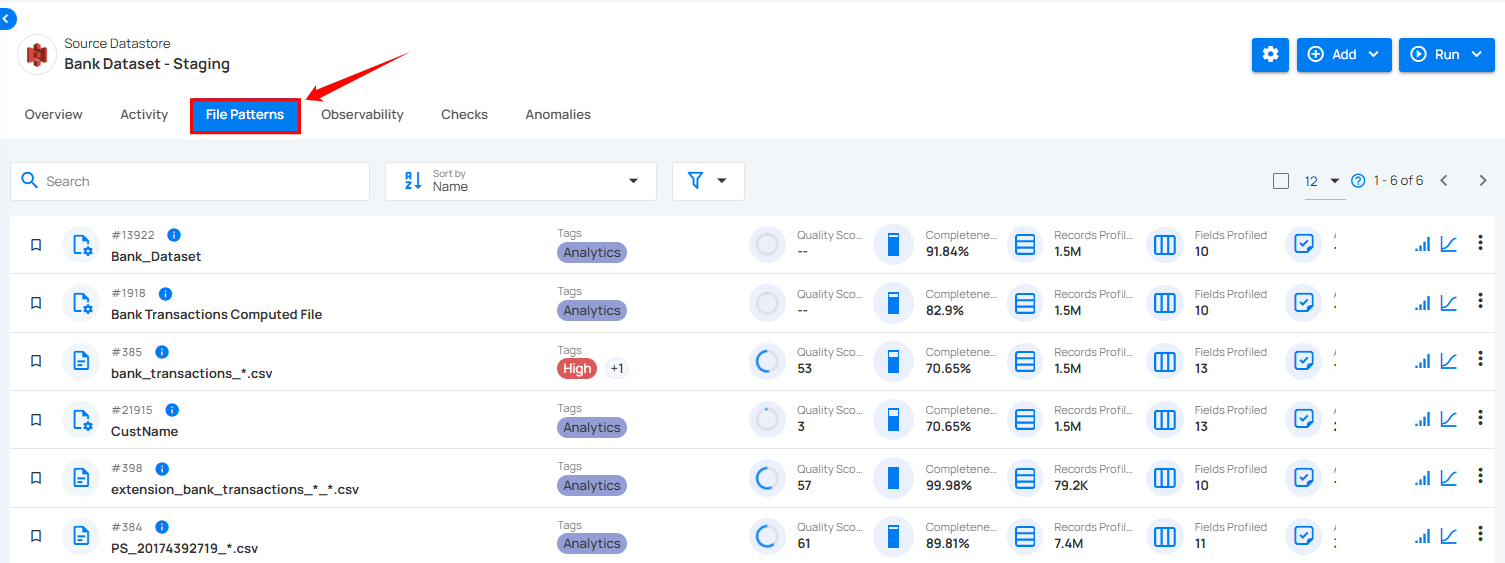
Step 2: Select Tables (if a JDBC datastore is connected) or File Patterns (if a DFS datastore is connected) from the Navigation tab at the top.
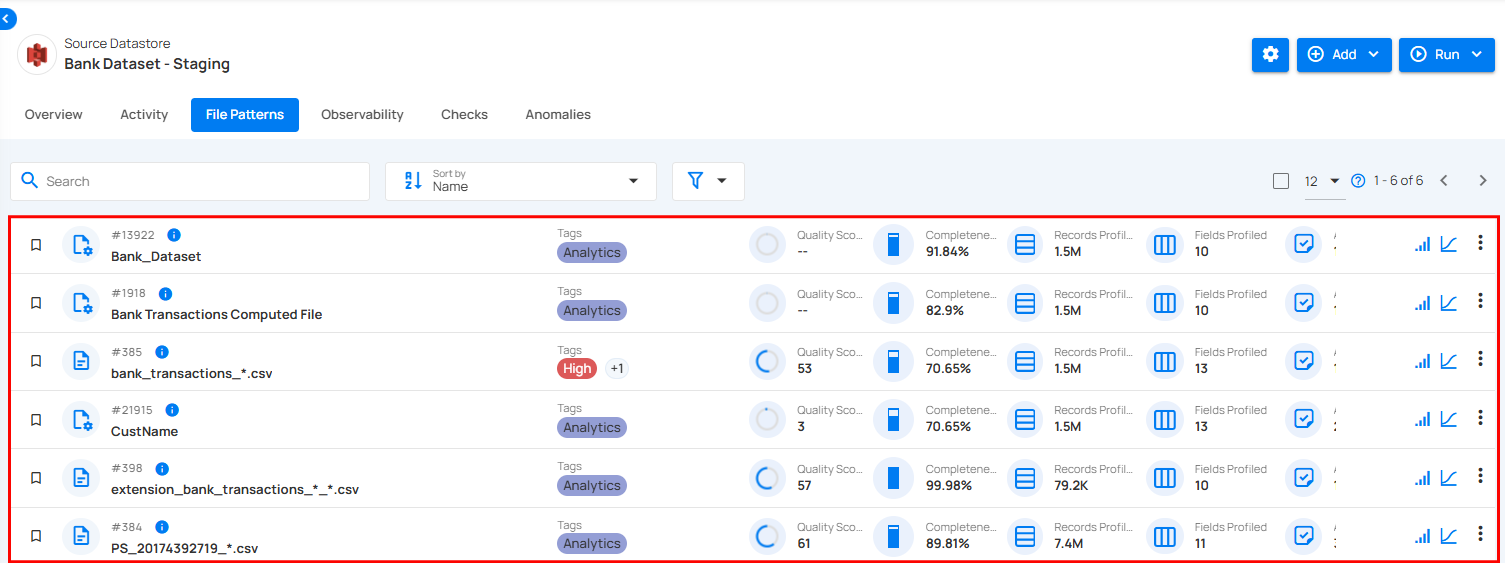
Step 3: You will view the full list of tables or files belonging to the selected source datastore. Select the specific table or file whose data you want to preview.
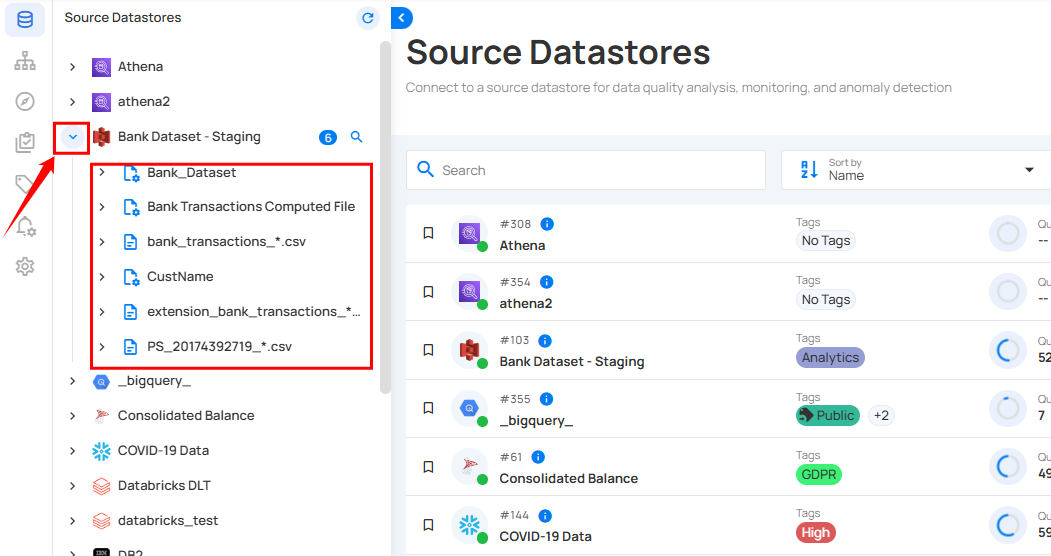
Alternatively, you can access the tables or files by clicking the drop-down arrow on the selected datastore. This will display the full list of tables or files associated with the selected source datastore. From there, select the specific table or file whose data you want to preview.
Step 4: After selecting the specific table or file, click on the Data Preview tab.
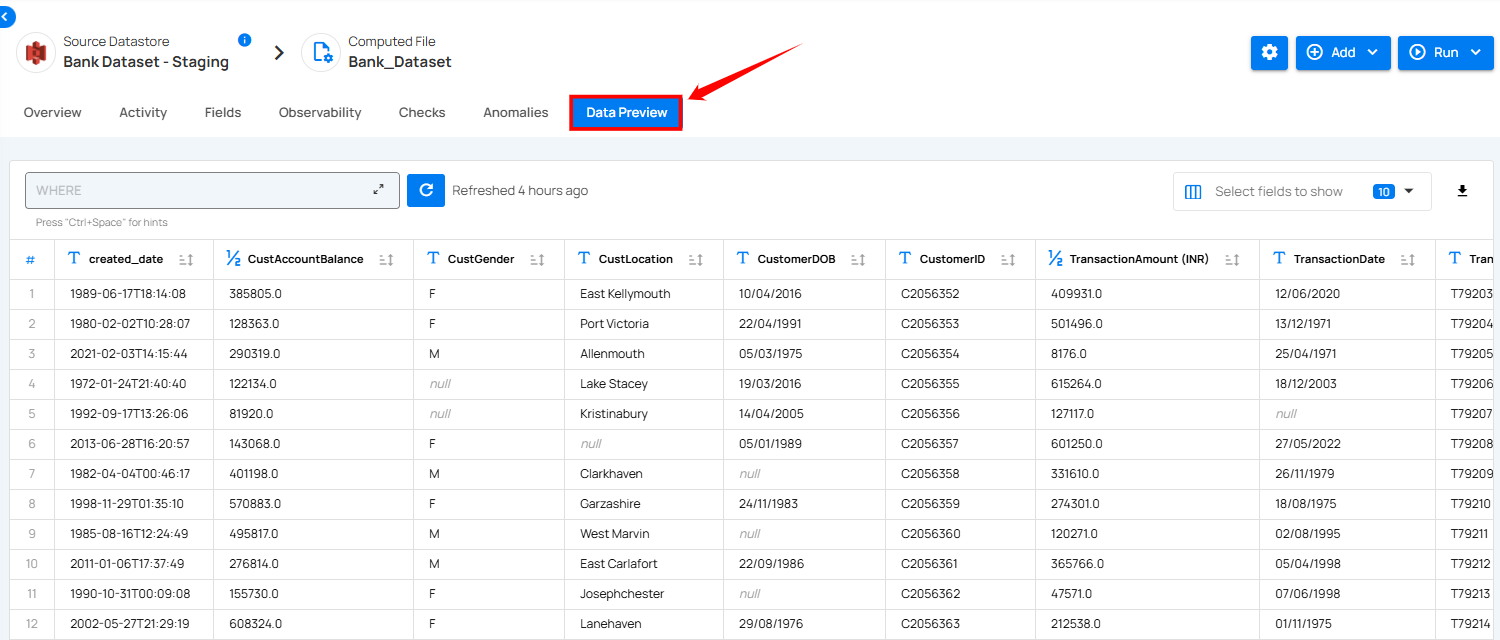
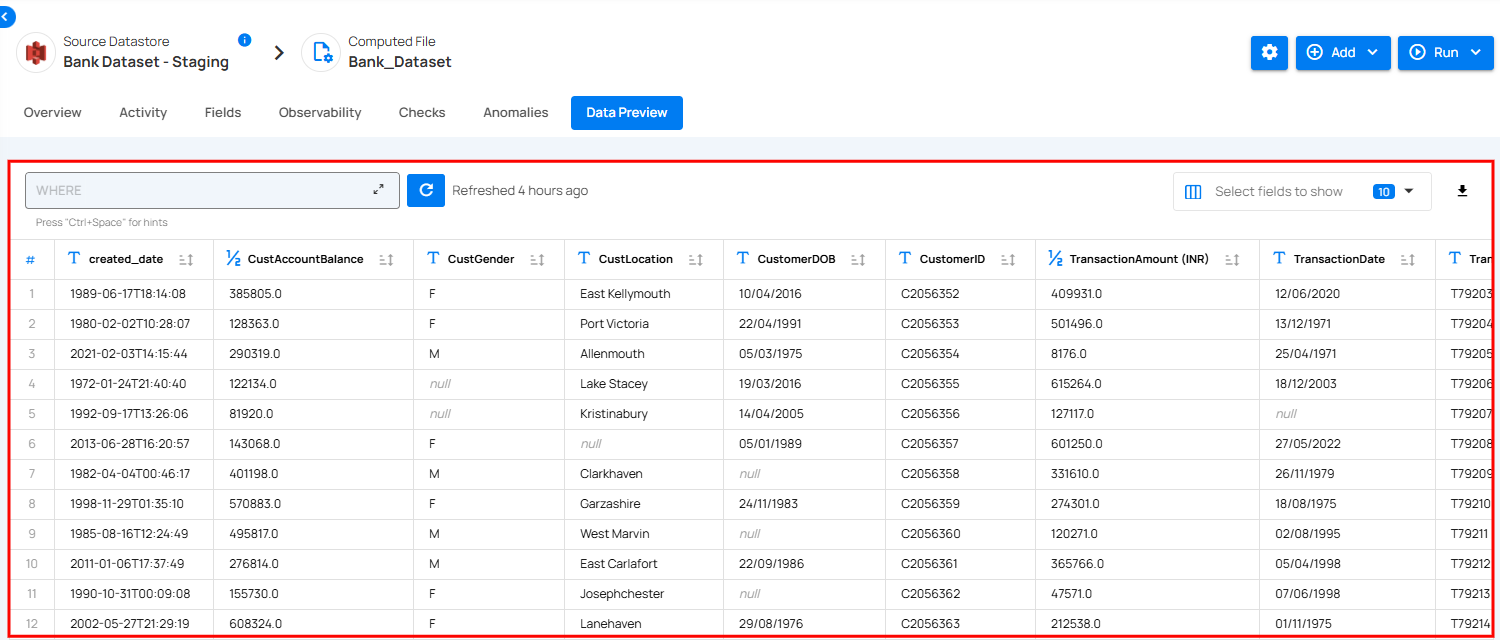
You will see a tabular view of the data, displaying the field names (columns) and their corresponding data values, allowing you to review the data's structure, types, and sample records.
UI Caching
Upon initial access to the Data Preview section, the data may not be stored (cached) yet, which can cause longer loading times. How long it takes to load depends on the type of datastore being used (like DFS or JDBC) and whether the data warehouse is serverless. However, the next time you access the same data, it will load faster because it will be cached, meaning the data is stored temporarily for quicker access.
Filter Clause and Refresh
The Data Preview tab includes filter functionality that enables users to focus on specific fields by applying filter clauses. This refines the displayed rows based on specific criteria, enhancing data analysis and providing more targeted insights and includes a Refresh button to update the data view with the latest data.
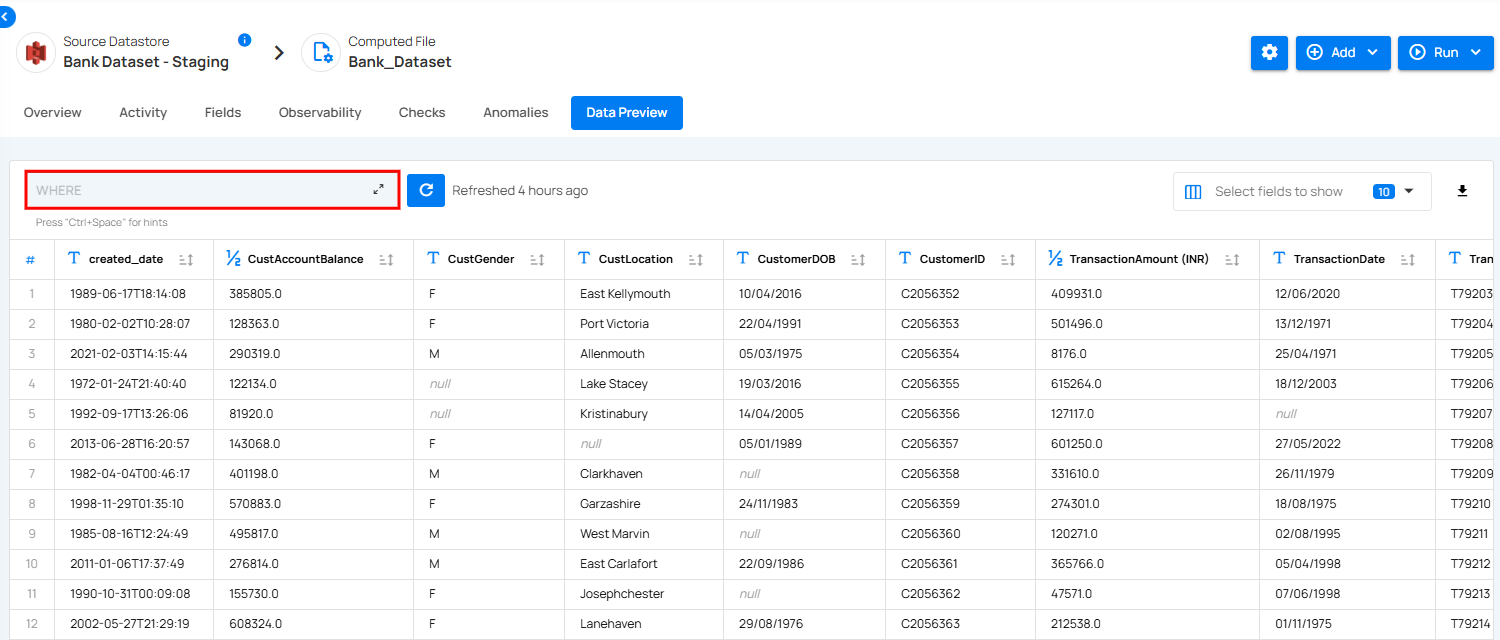
Filter Clause
Use the Filter Clause to narrow down the displayed rows by applying specific criteria, allowing for focused and precise data analysis.
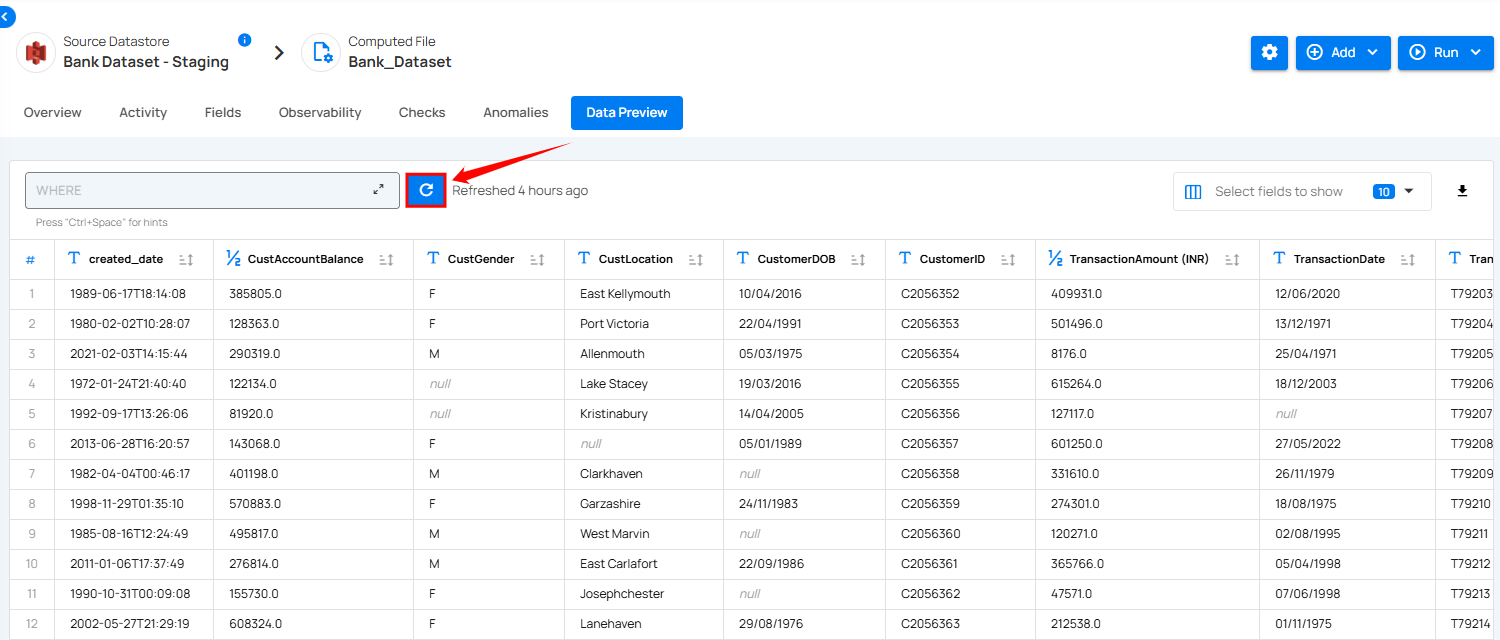
Refresh
Click the Refresh button to update the data view with the latest information, ensuring accuracy and relevance.
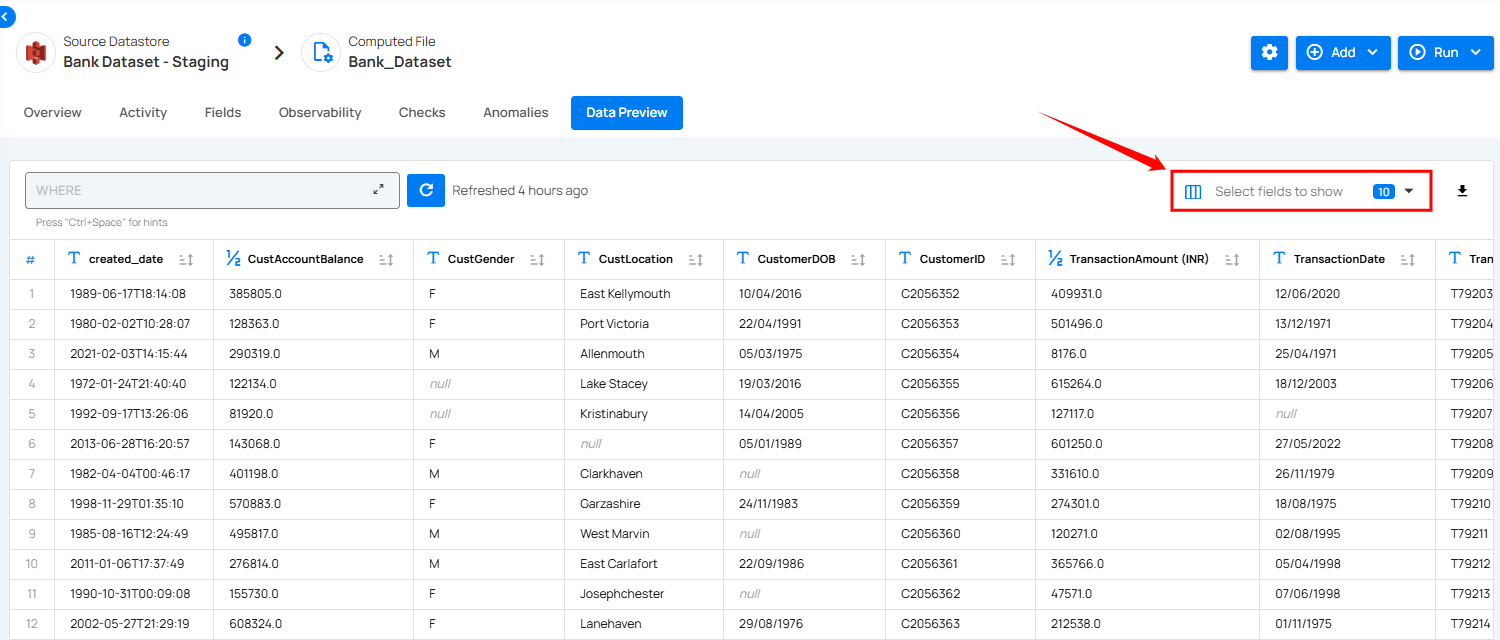
Select Specific Fields
Select specific fields to display, allowing you to focus on the most relevant data for analysis. Click on the Select Fields to Show dropdown and choose specific fields you want to review by checking or unchecking options.
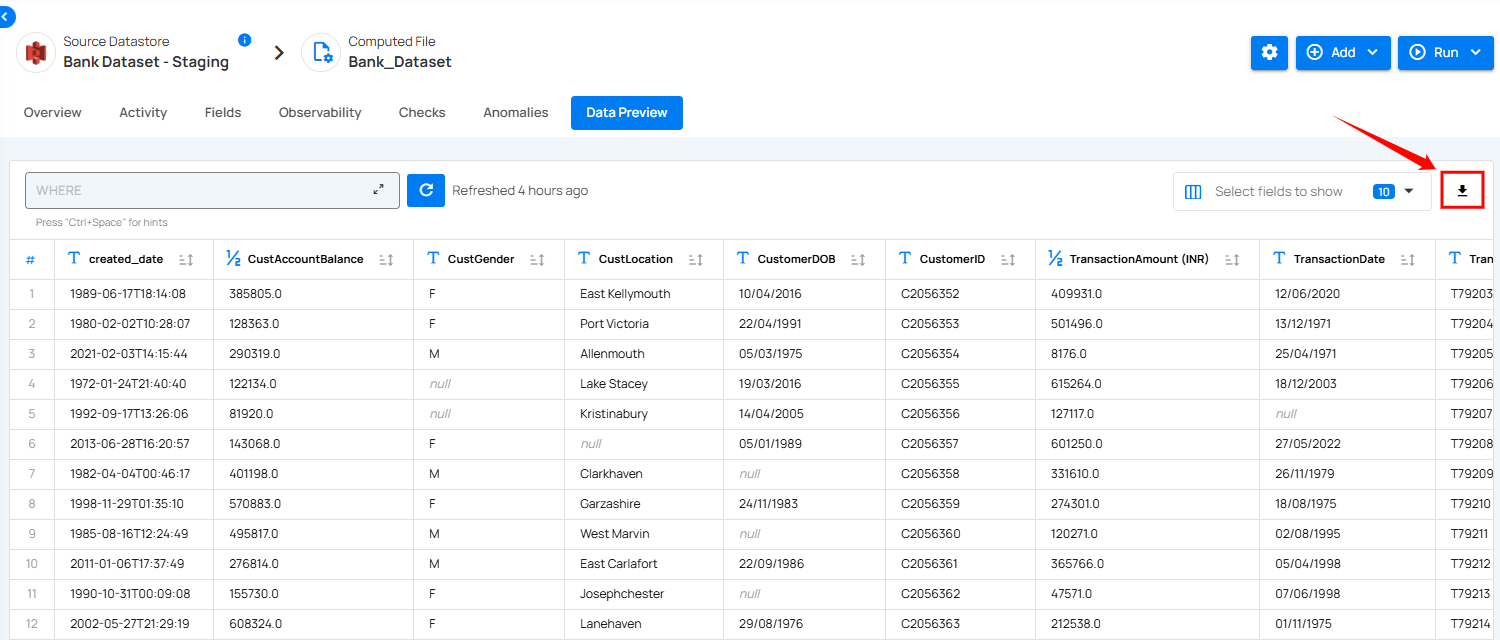
Download Records
The Download Records feature in Qualytics allows users to easily export all source records from the selected enrichment dataset. This functionality is essential for performing deeper analysis outside the platform or for sharing data with external tools and teams.
Masked Fields in Data Preview
If a container contains masked fields, their values are obfuscated in the data preview grid by default.
Users with Editor permission can reveal all masked values for the current view by clicking the Show masked values button that appears in the toolbar when masked fields are present. Every reveal action is recorded in the masking audit log with the user identity, timestamp, IP address, and the specific fields accessed — this log is reviewable by Administrators.
Use Cases
Debugging Checks
One of the primary use cases of the Data Preview tab is for debugging checks. Users can efficiently inspect the first 100 rows of container data to identify any anomalies, inconsistencies, or errors, facilitating the debugging process and improving data quality.
Data Analysis
The Data Preview tab also serves as a valuable tool for data analysis tasks. Users can explore the dataset, apply filters to focus on specific subsets of data, and gain insights into patterns, trends, and correlations within the container data.
Examples
Example 1: Debugging Data Import
Suppose a user encounters issues with importing data into a container. By utilizing the Data Preview tab, the user can quickly examine the first 100 rows of imported data, identify any formatting errors or missing values, and troubleshoot the data import process effectively.
Example 2: Filtering Data by Date Range
In another scenario, a user needs to analyze sales data within a specific date range. The user can leverage the filter support feature of the Data Preview tab to apply date range filters, displaying only the sales records that fall within the specified timeframe. This allows for targeted analysis and informed decision-making.