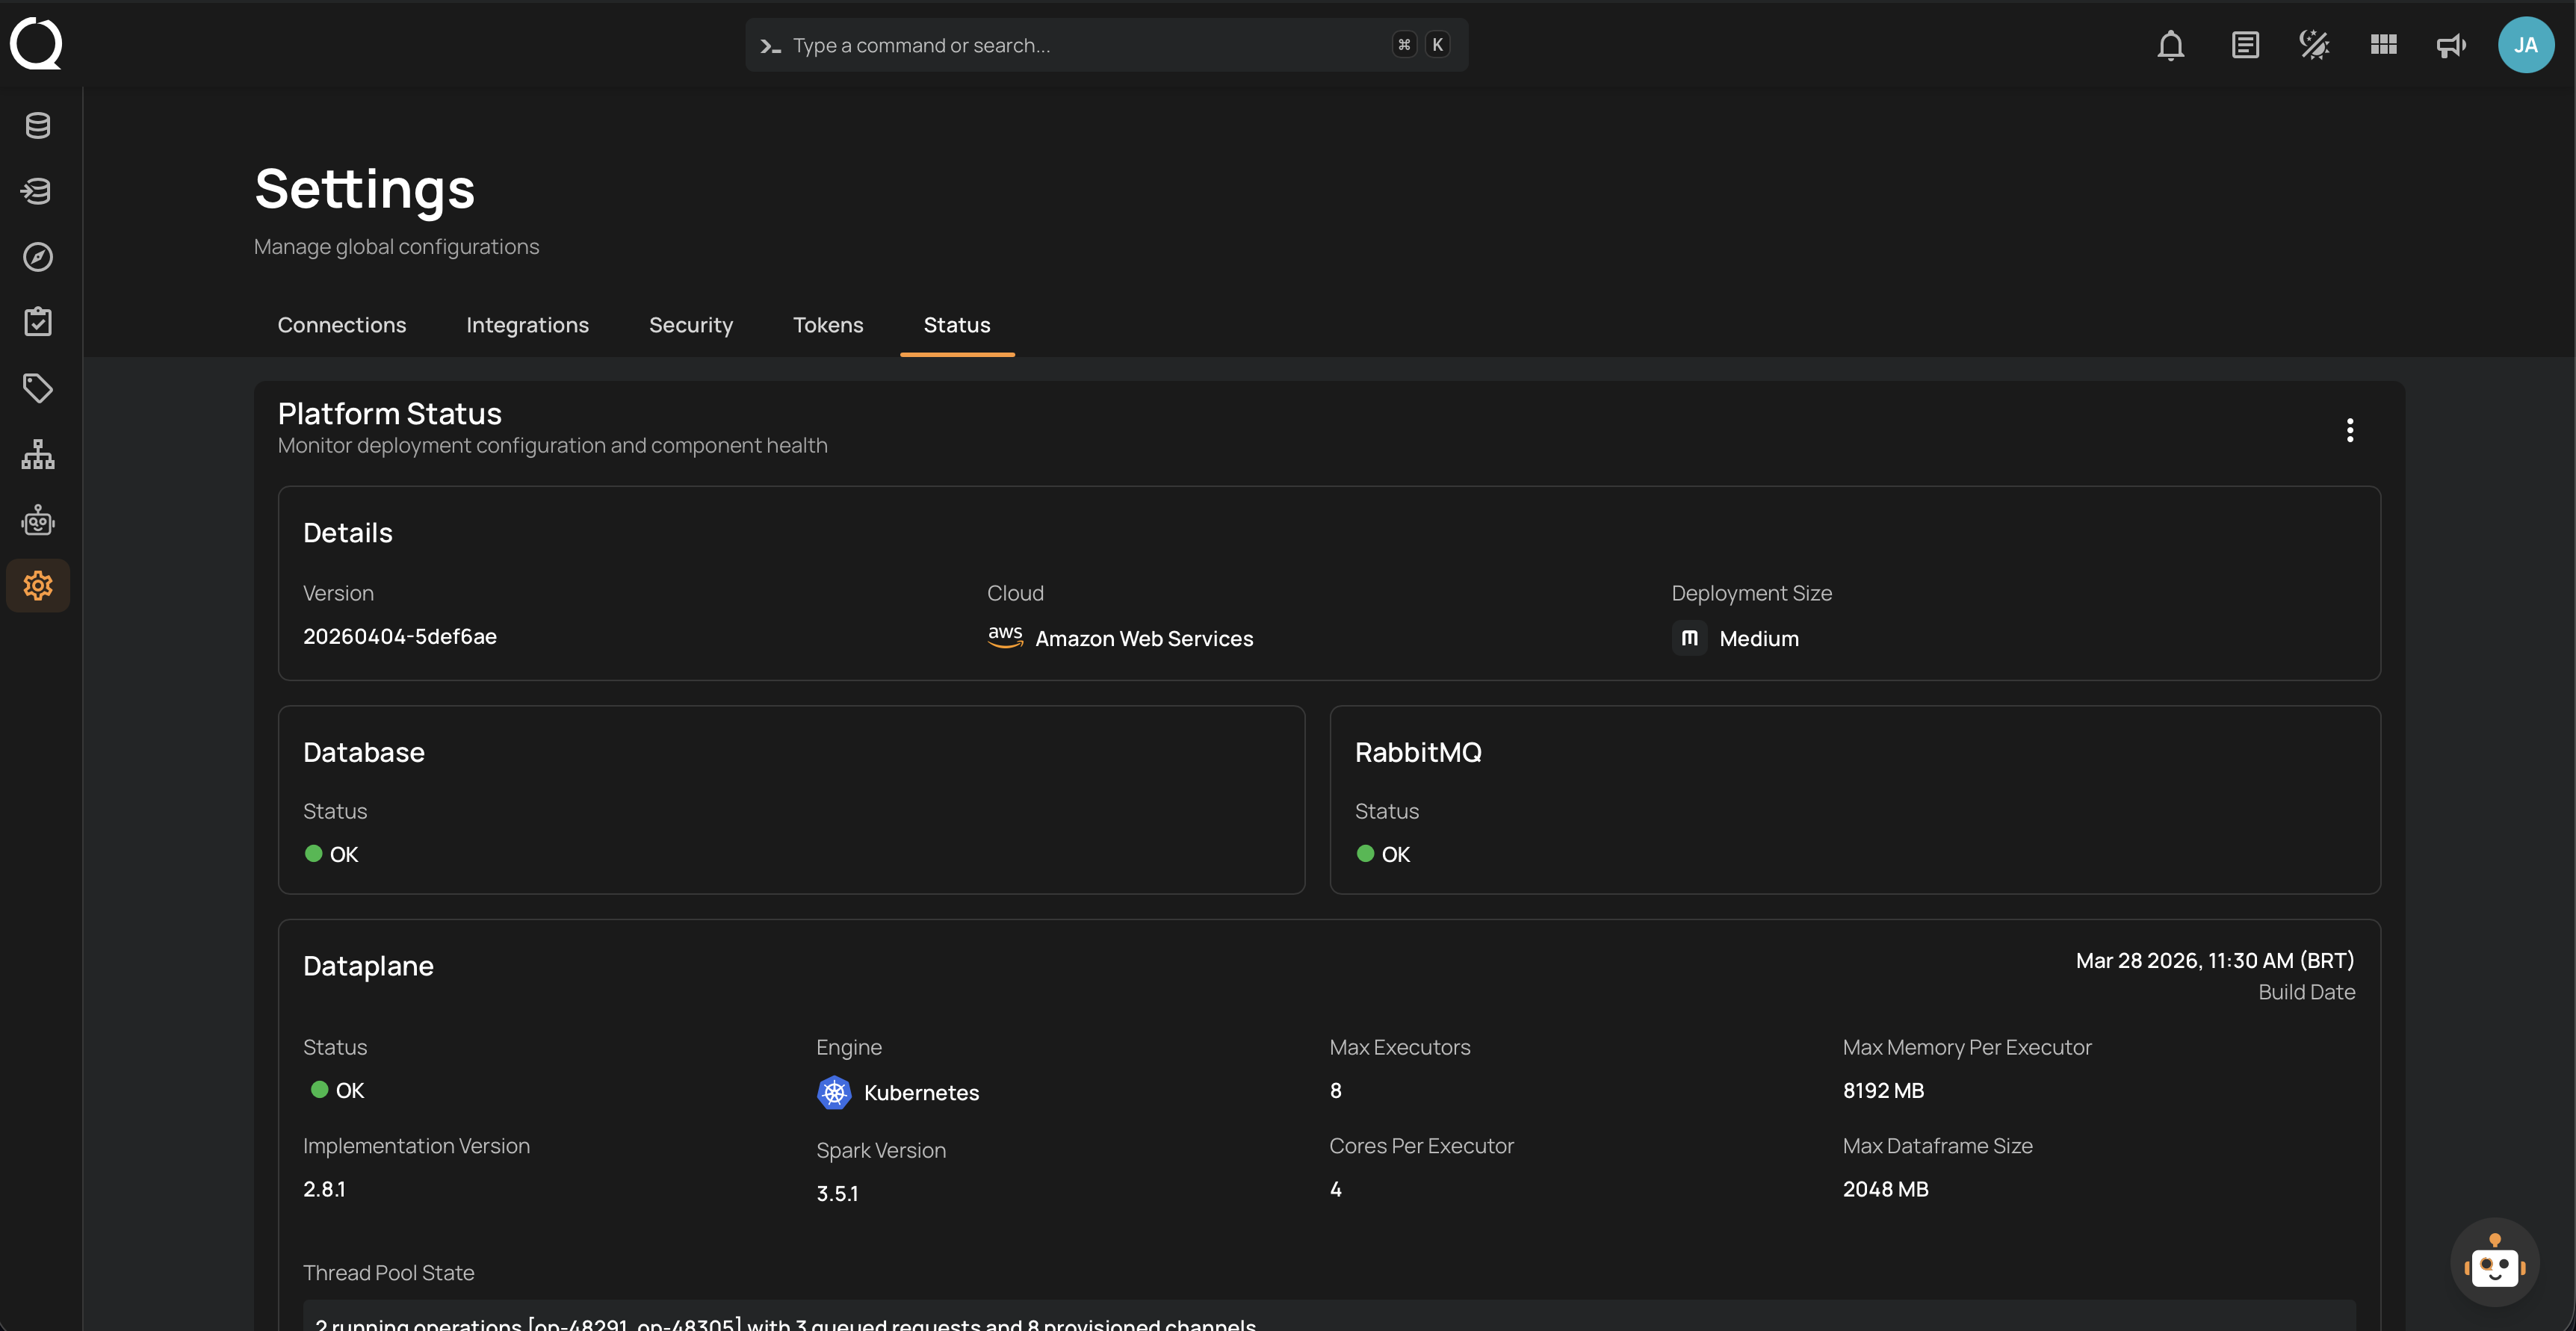
Platform Status
The Platform Status page provides a real-time overview of your deployment's configuration and component health. It is the central place to verify that all critical services — the database, message broker, and analytics engine — are operating correctly.
This page is useful when:
- Diagnosing connectivity or processing issues before they impact data quality operations.
- Verifying deployment details such as version, cloud provider, and resource allocation.
- Confirming that the dataplane is healthy and has sufficient resources for your workload.
- Sharing a status summary with support teams for troubleshooting.
Permissions
Users with the Manager or Admin role can view the Platform Status page. Restarting the dataplane requires the Admin role. For a full breakdown of status-related permissions, see the Permissions page.
Details
The Details section provides a quick overview of your deployment's identity, infrastructure, and capacity tier. These values are set during deployment and reflect the environment where your Qualytics instance is running.
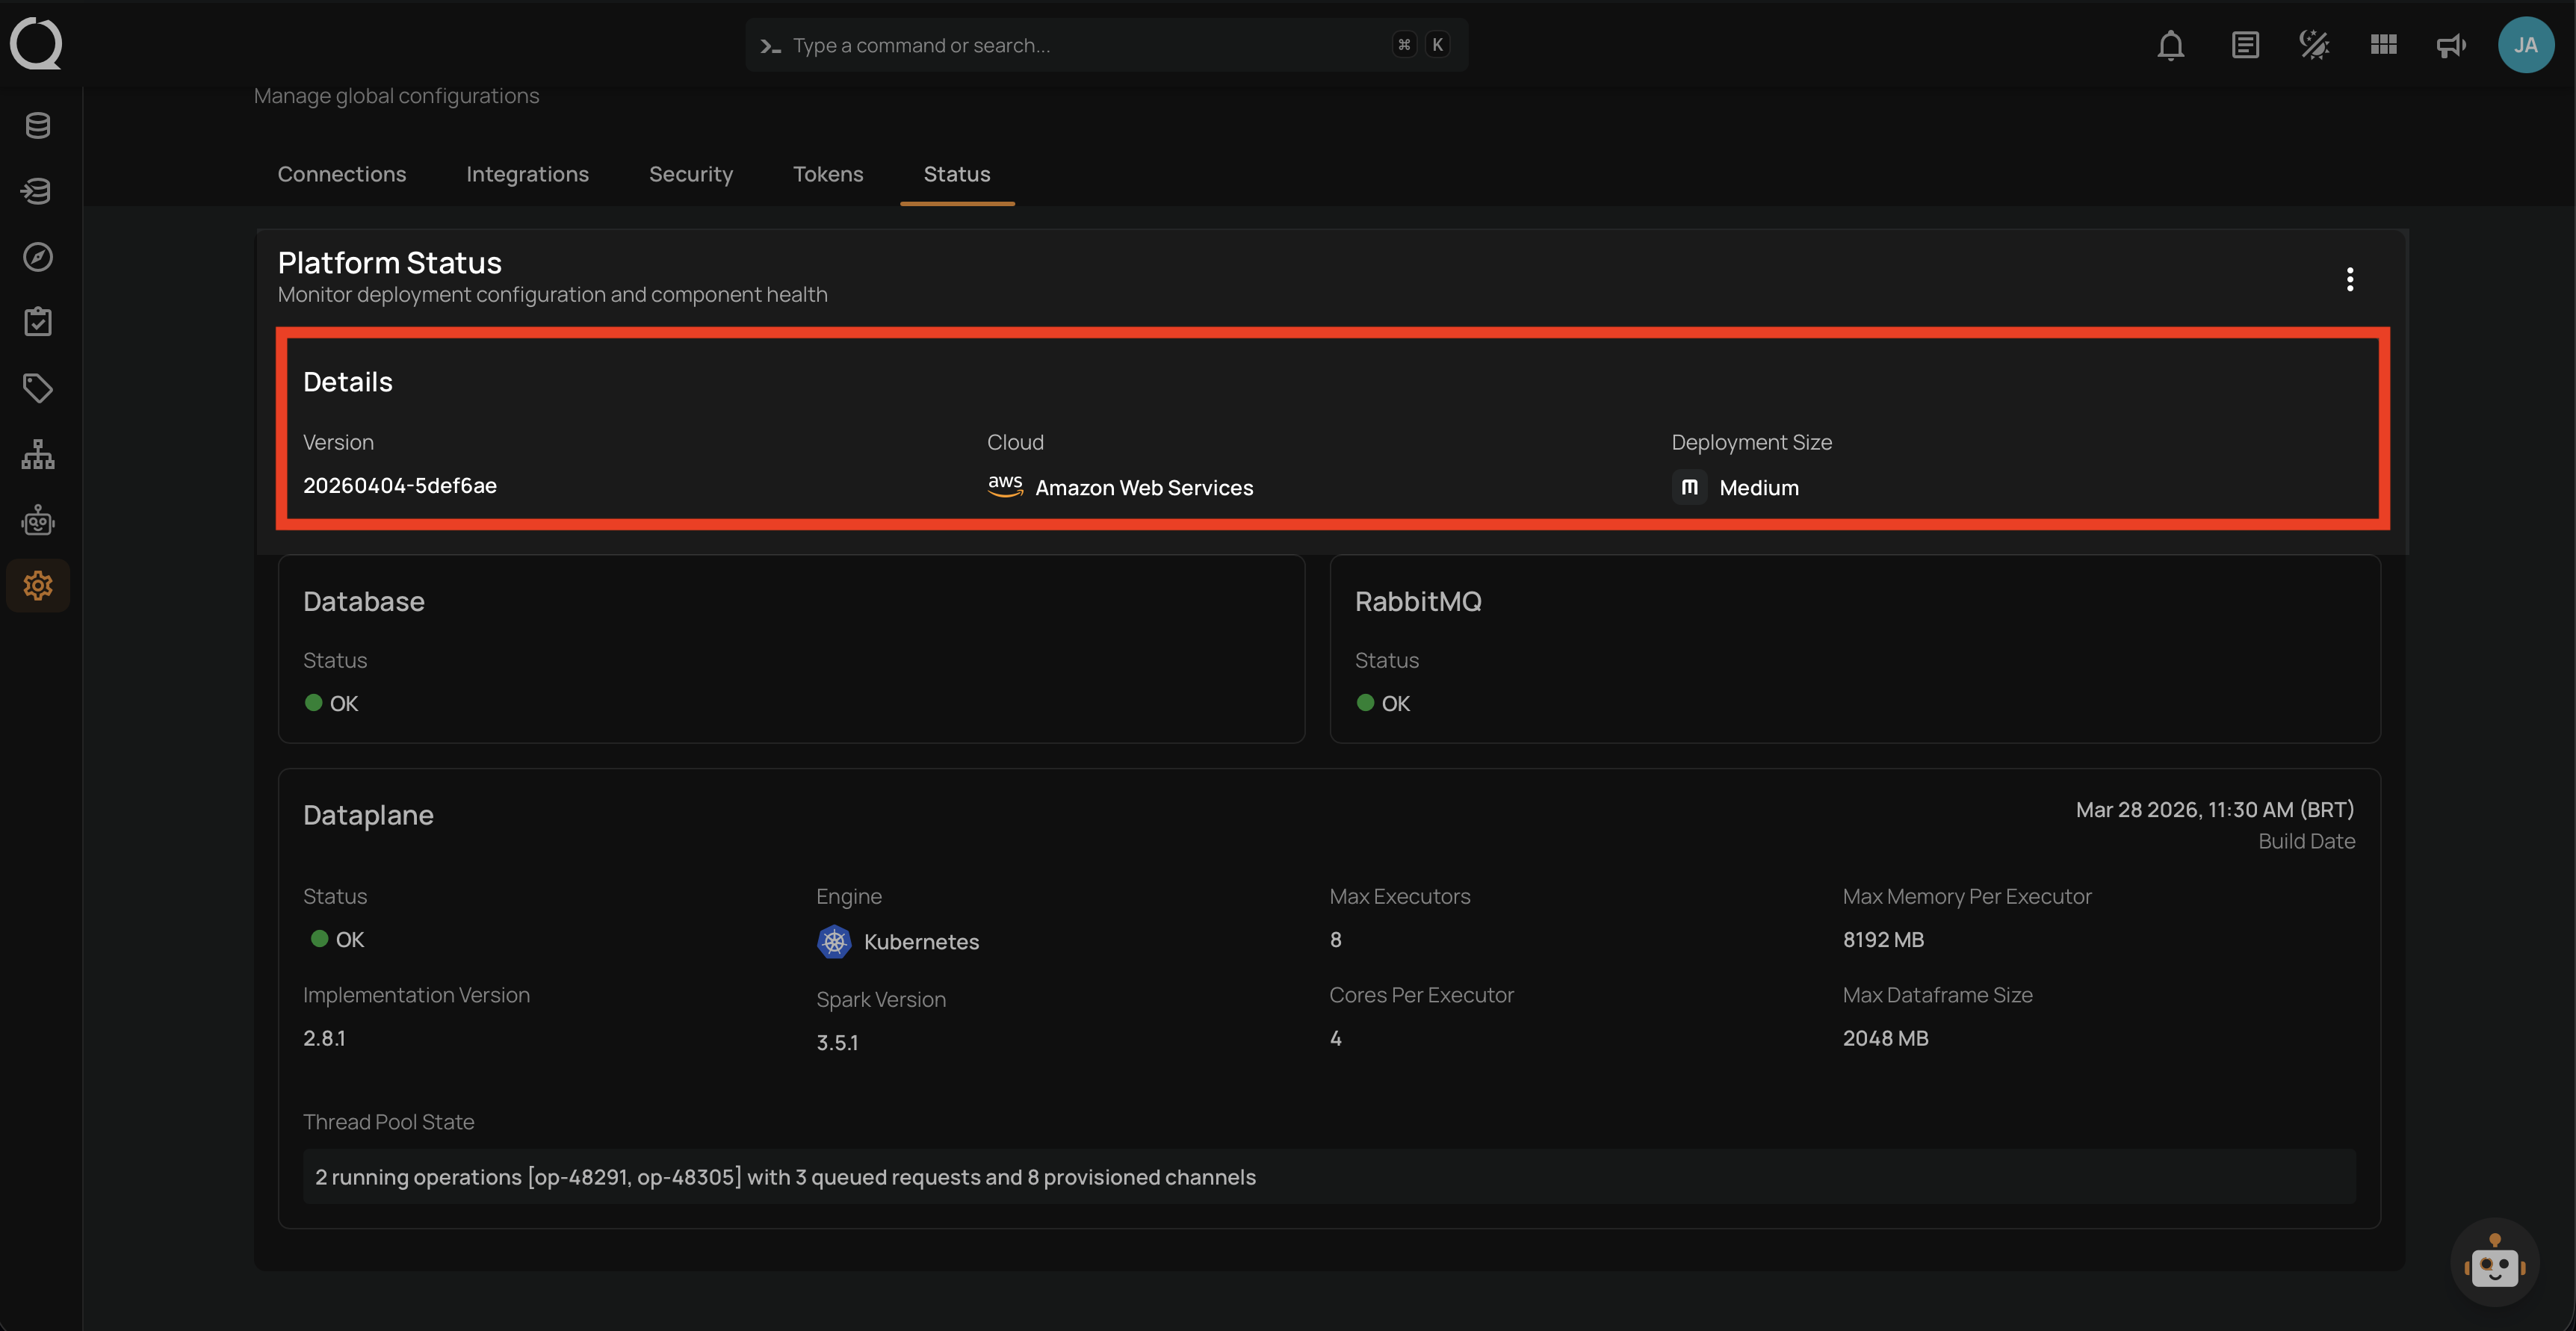
Fields
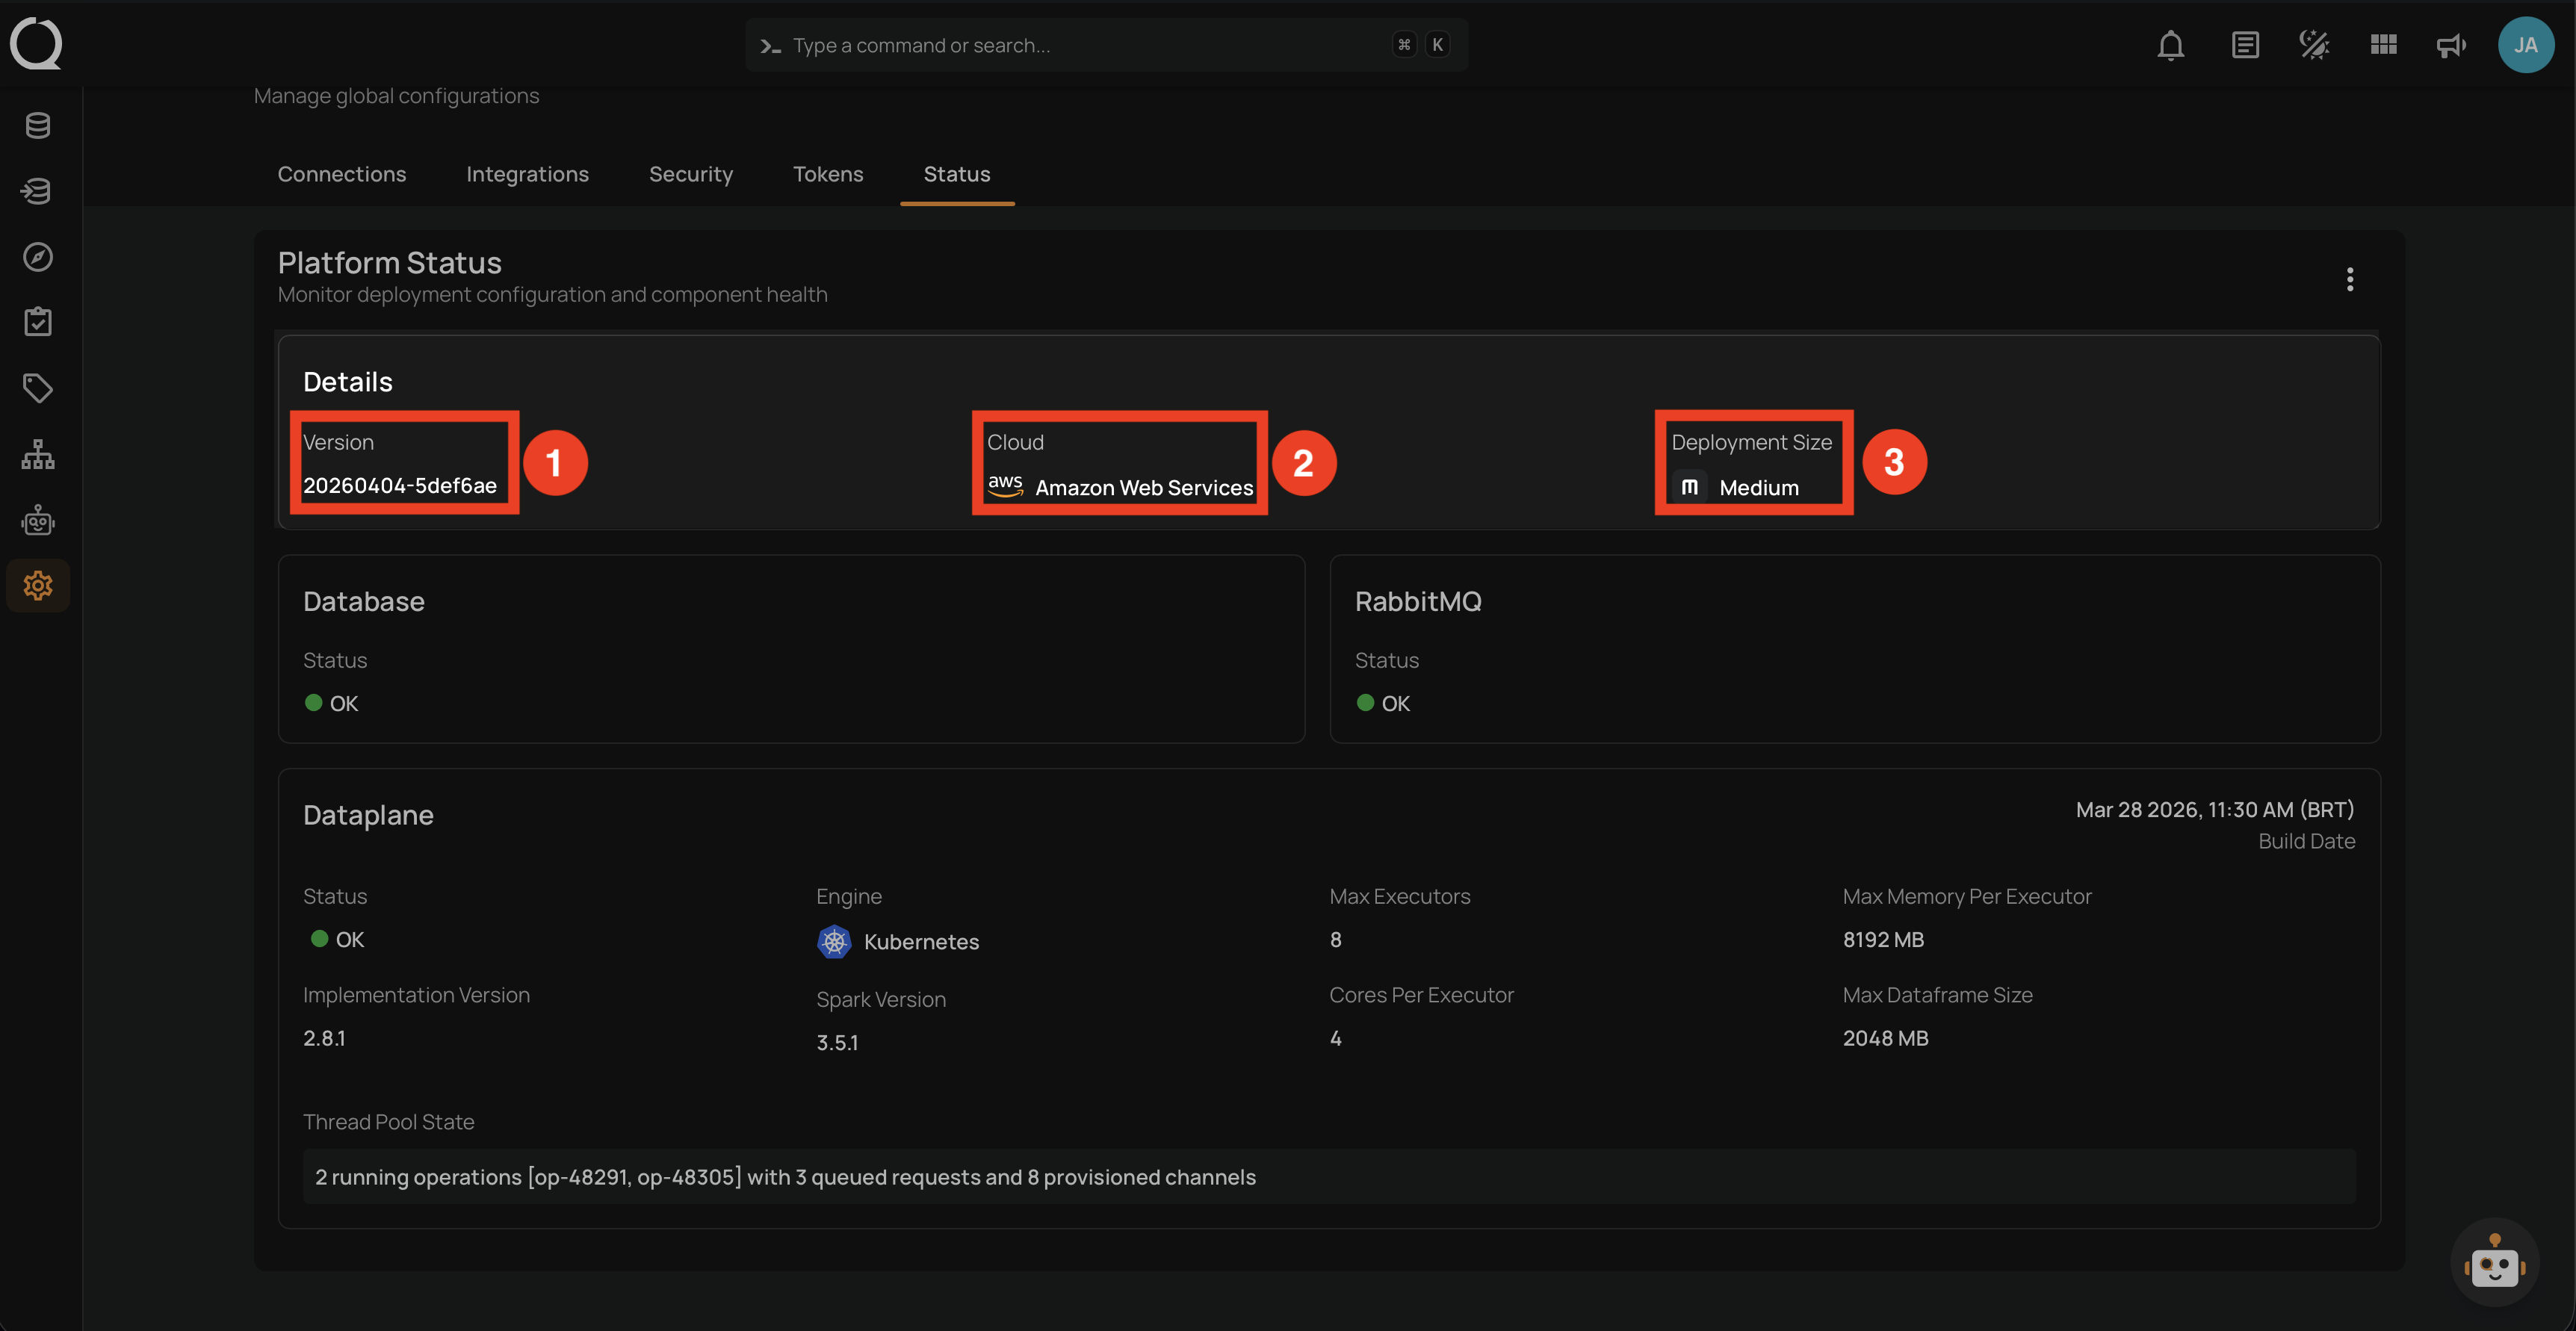
The section displays three fields that identify your deployment: the platform version, the cloud provider, and the deployment size.
| REF. | FIELD | DESCRIPTION |
|---|---|---|
| 1 | Version | The current version of the platform's controlplane software. This value is updated automatically during platform upgrades and follows a date-based format (e.g., 20260325-196460). |
| 2 | Cloud | The cloud provider hosting the deployment, displayed with the provider's logo. See the Supported Cloud Platforms table below for all available options. |
| 3 | Deployment Size | The deployment tier, which determines the compute resources (executors, memory, cores) allocated to the dataplane. See the Deployment Sizes table below for all available tiers. |
Supported Cloud Platforms
Qualytics can be deployed on the following cloud providers. The platform is displayed with its logo in the Details section.
| No. | Logo | Cloud Platform |
|---|---|---|
| 1. | Amazon Web Services | |
| 2. | Google Cloud Platform | |
| 3. | Microsoft Azure | |
| 4. | Local |
Note
The Local option is used for self-hosted deployments not running on a major cloud provider.
Deployment Sizes
The deployment size determines the compute resources available to the analytics engine. Larger tiers provide more executors, memory, and processing capacity.
| No. | Icon | Size | Description |
|---|---|---|---|
| 1. | Small | Entry-level deployments suited for evaluation, development, or small-scale data quality workloads. | |
| 2. | Medium | Standard deployments balanced for most production data quality workloads. | |
| 3. | Large | High-capacity deployments designed for large-scale data quality operations across many datastores. | |
| 4. | Extra Large | Maximum-capacity deployments for enterprise-scale environments with demanding throughput requirements. |
Info
The deployment size is defined during contracting. If you experience performance issues or need more capacity, contact the Qualytics support team to move to a larger tier.
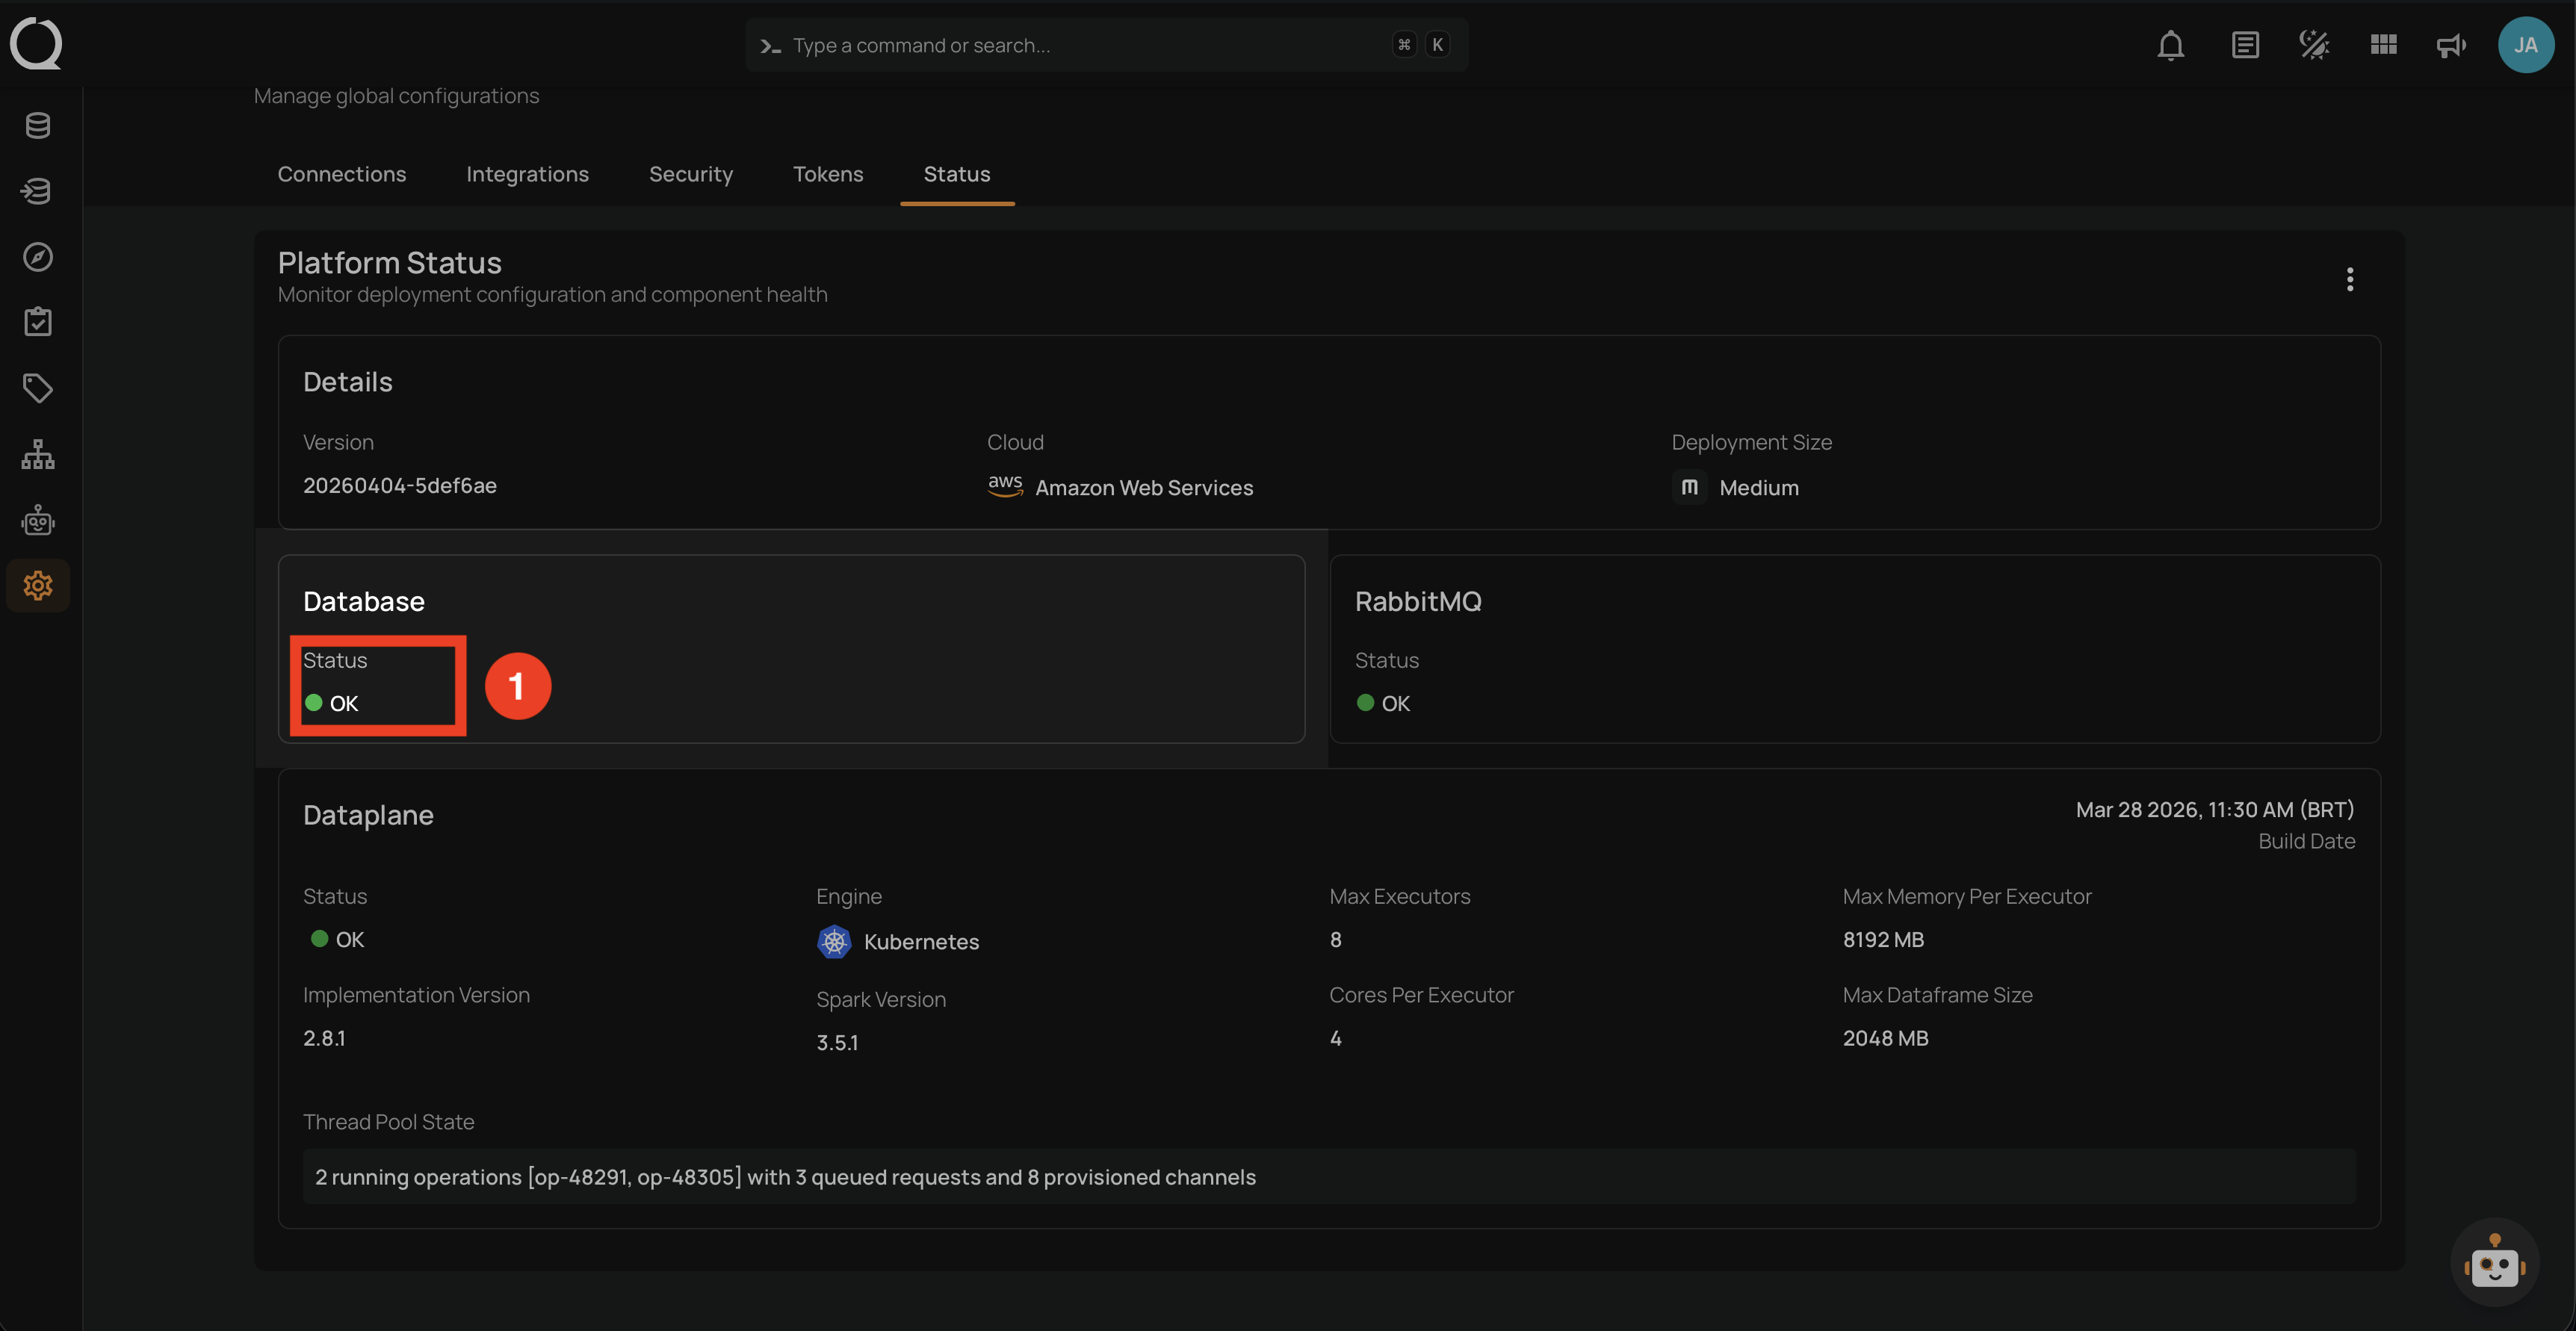
Database
The Database section verifies that the controlplane can communicate with its primary database.
When the Status page loads, the platform executes a lightweight connectivity check against the database. If the query returns successfully, the status is reported as OK. If the query fails for any reason — such as a network disruption, database restart, or misconfigured credentials — the status is reported as UNHEALTHY.
Fields
The section displays one field that reports the database connectivity status.
| REF. | FIELD | DESCRIPTION |
|---|---|---|
| 1 | Status | The database connectivity status. A green indicator with OK means the connection is healthy and responsive. A red indicator with UNHEALTHY means the database is unreachable or not responding. |
Warning
If the database is unhealthy, the platform cannot persist or retrieve any data. This affects all functionality including user authentication, datastore management, and operation history.
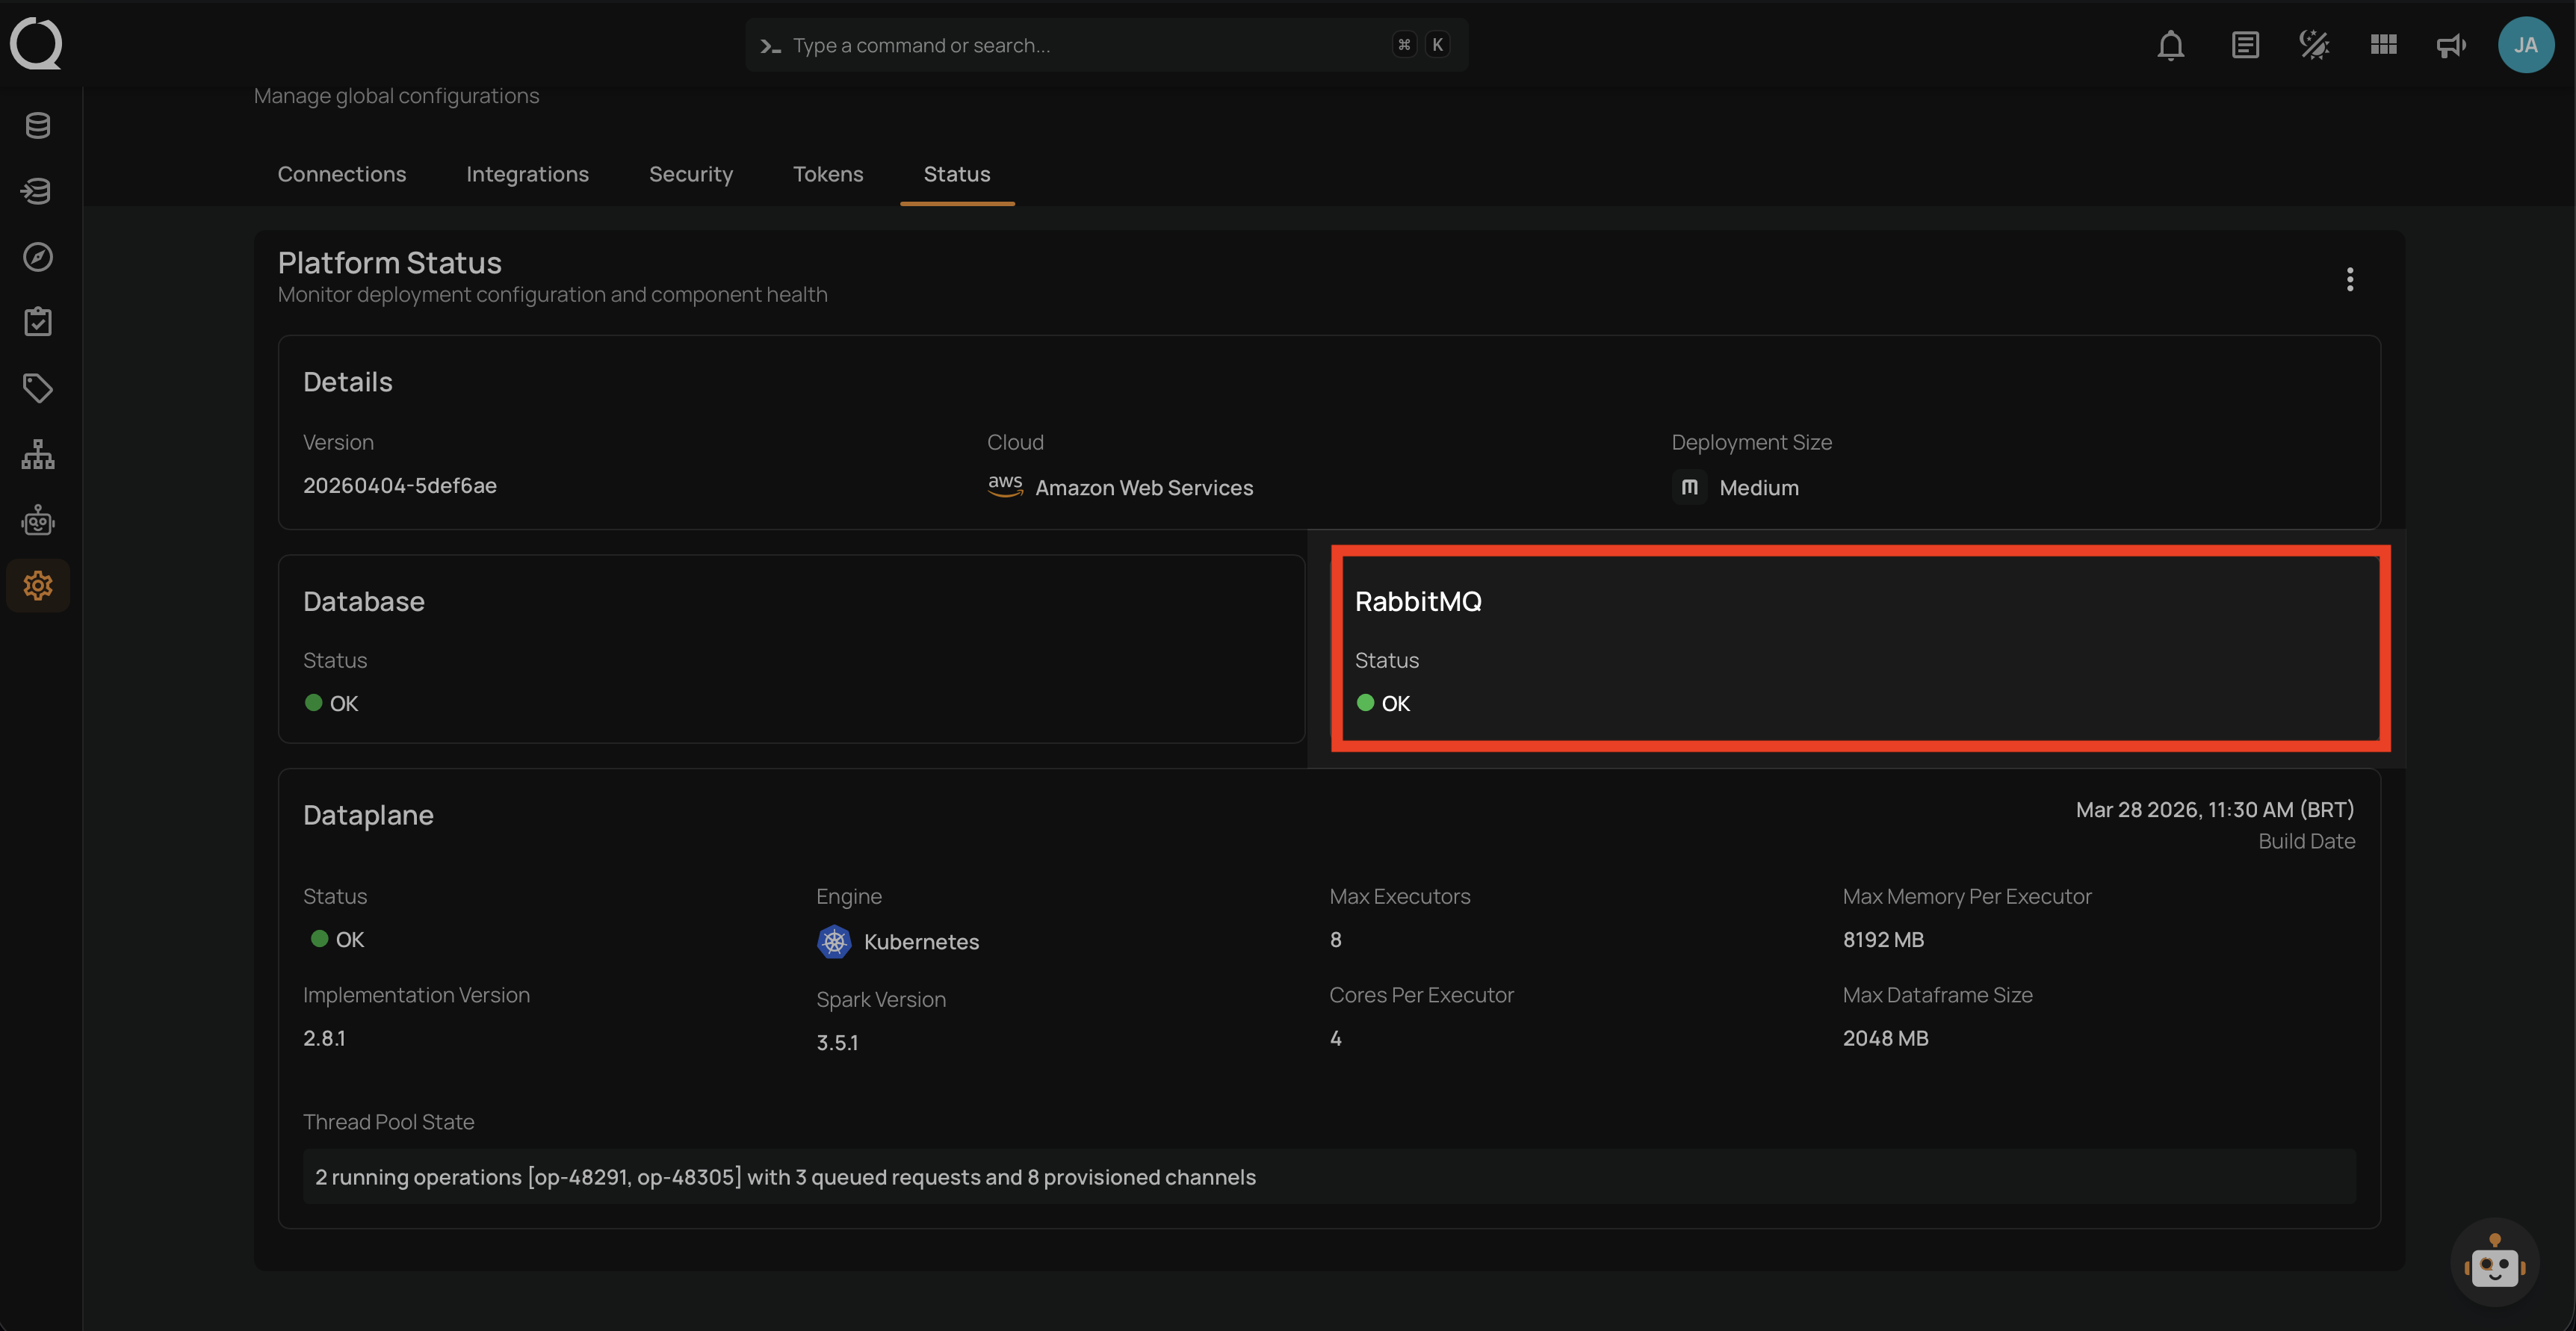
RabbitMQ
The RabbitMQ section verifies that the message broker is running and reachable.
RabbitMQ is the communication layer between the controlplane (the API and management layer that handles user requests, configuration, and data persistence) and the dataplane (the analytics engine that executes data quality operations). Every operation request — Sync, Profile, Scan, External Scan, Export, Materialize — is delivered to the dataplane through RabbitMQ message queues:
- Request queues deliver operation instructions from the controlplane to the dataplane.
- Response queues return results (success, failure, metrics) from the dataplane back to the controlplane.
The status check verifies that a TCP connection to RabbitMQ can be established and is in an open state.
Fields
The section displays one field that reports the RabbitMQ connectivity status.
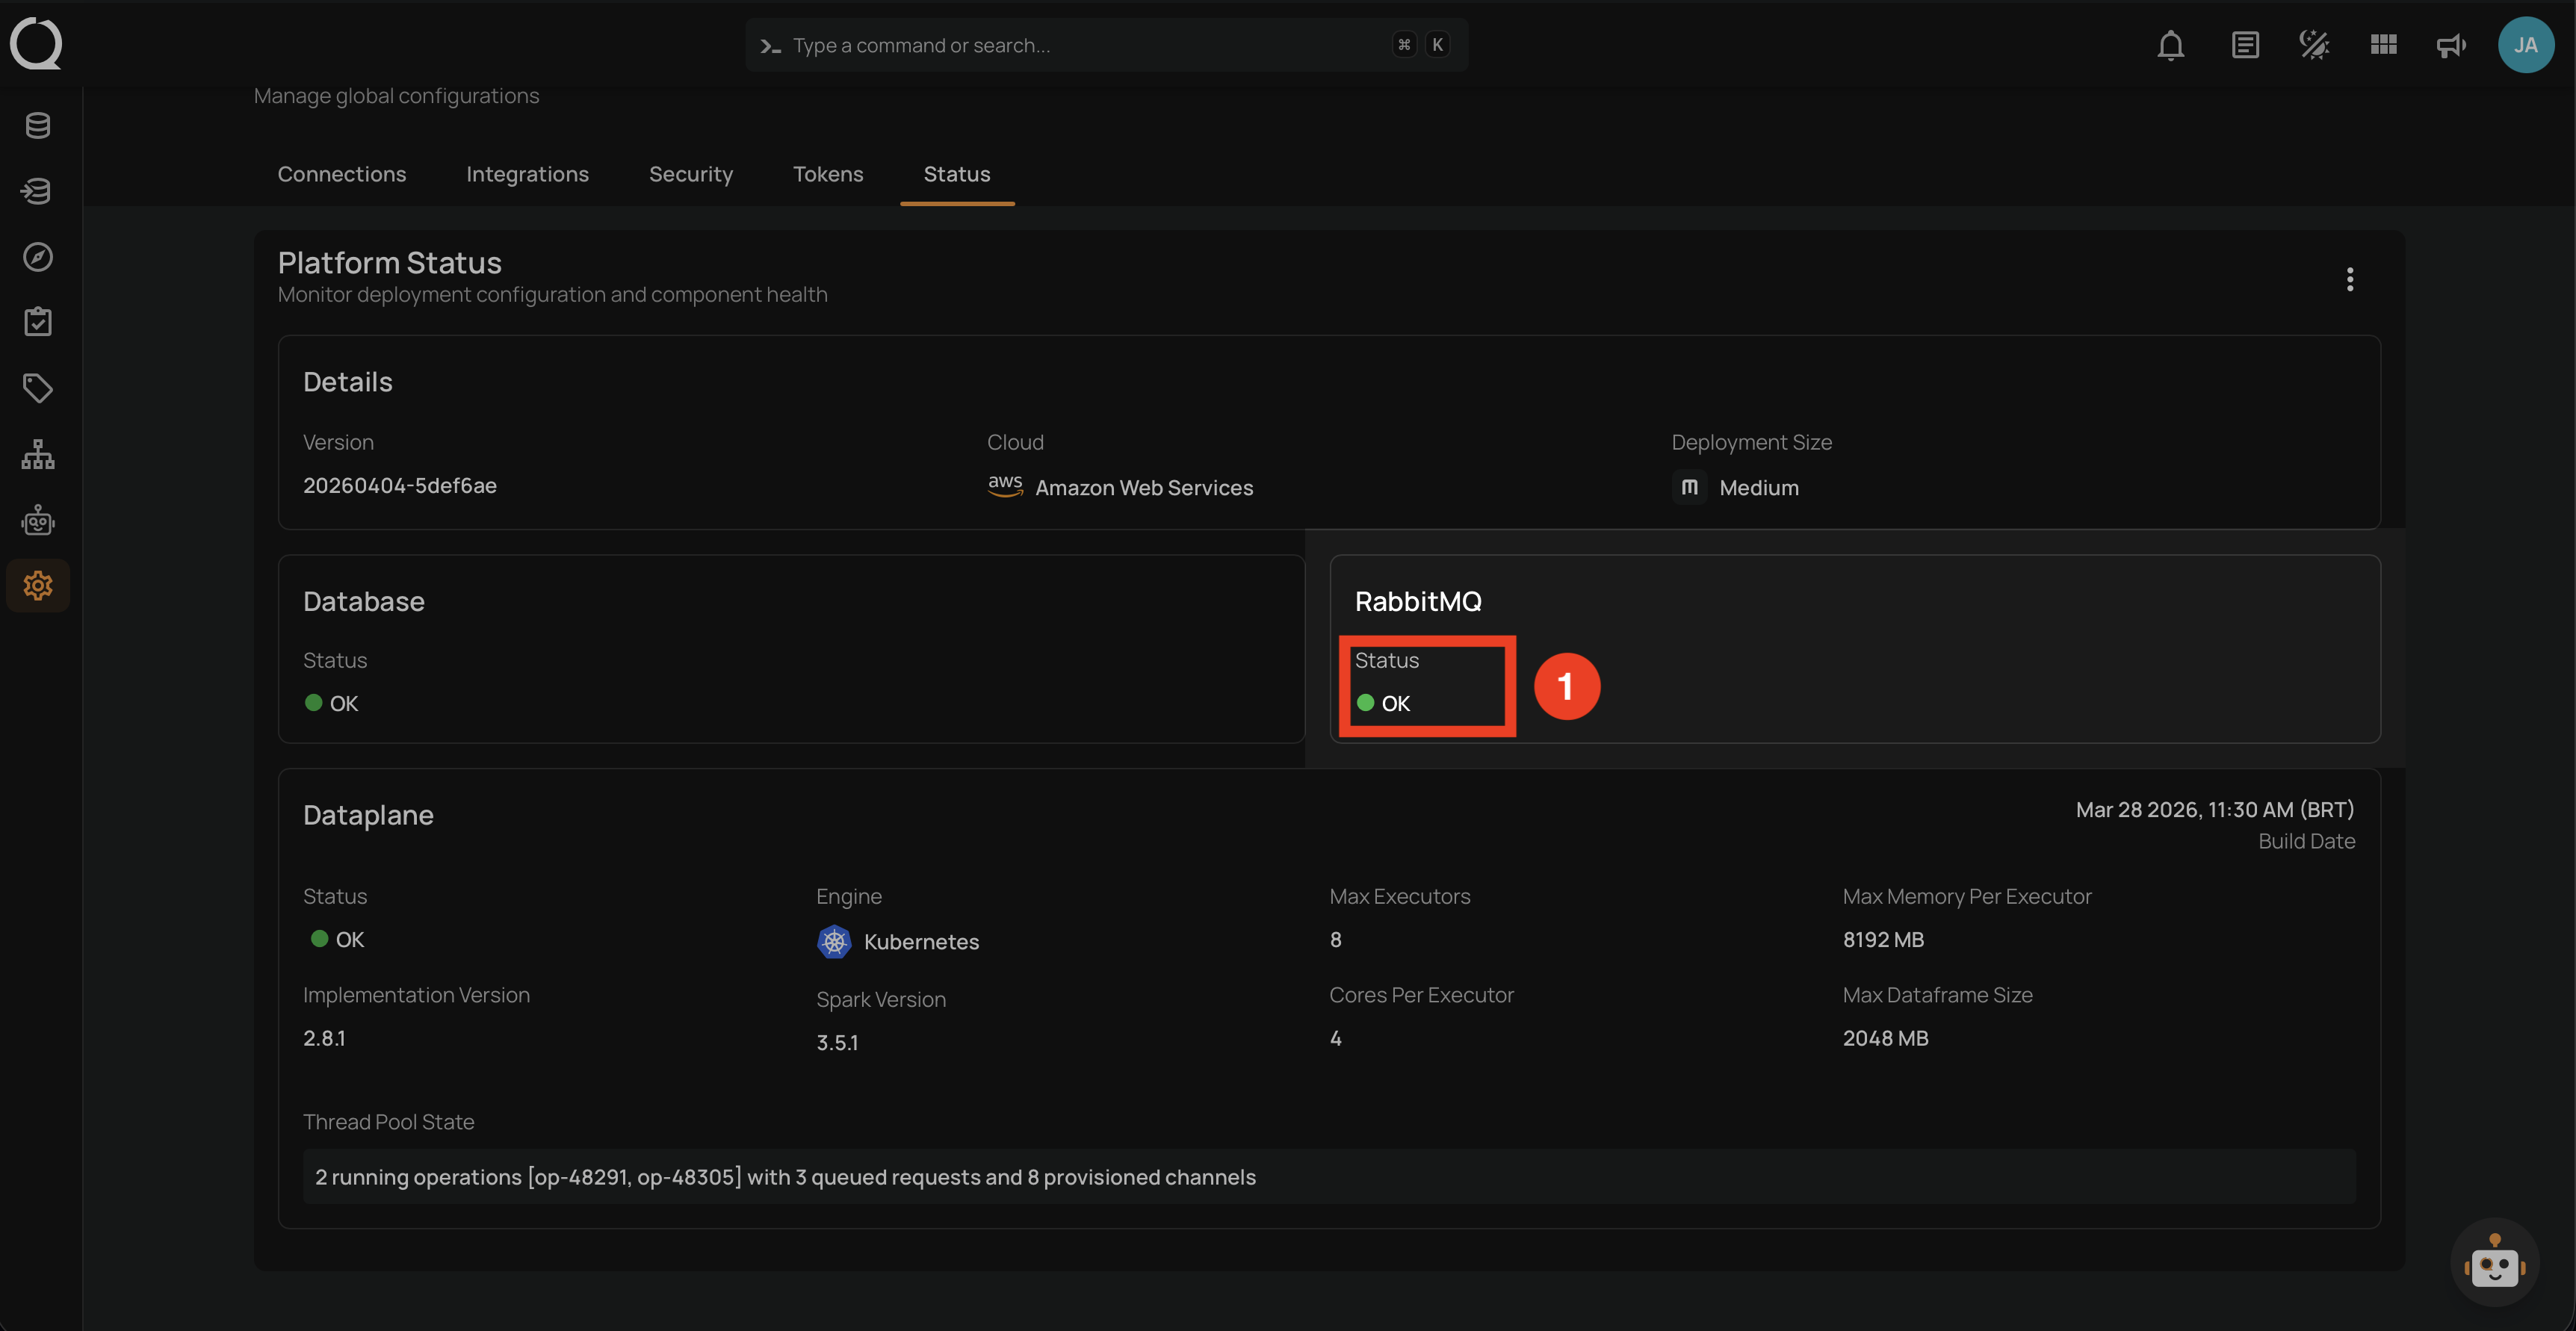
| REF. | FIELD | DESCRIPTION |
|---|---|---|
| 1 | Status | The RabbitMQ connectivity status. A green indicator with OK means RabbitMQ is connected and operational. A red indicator with UNHEALTHY means RabbitMQ is unreachable. |
Warning
If RabbitMQ is unhealthy, the dataplane health check cannot be performed, and all operation-related features will be unavailable until the connection is restored.
Dataplane
The Dataplane is the analytics engine that executes all data quality operations. Depending on your deployment, it runs on Kubernetes, Databricks, or a local host. It operates as an independent service that communicates with the controlplane through RabbitMQ.
When the Status page loads (and RabbitMQ is healthy), the controlplane sends a health check request to the dataplane through RabbitMQ. The dataplane responds with its configuration and runtime metrics within a short timeout window. If the dataplane does not respond within this window, the status is reported as UNHEALTHY.
Note
The dataplane may appear unhealthy during a restart. After triggering a restart, wait a few seconds before refreshing the status.
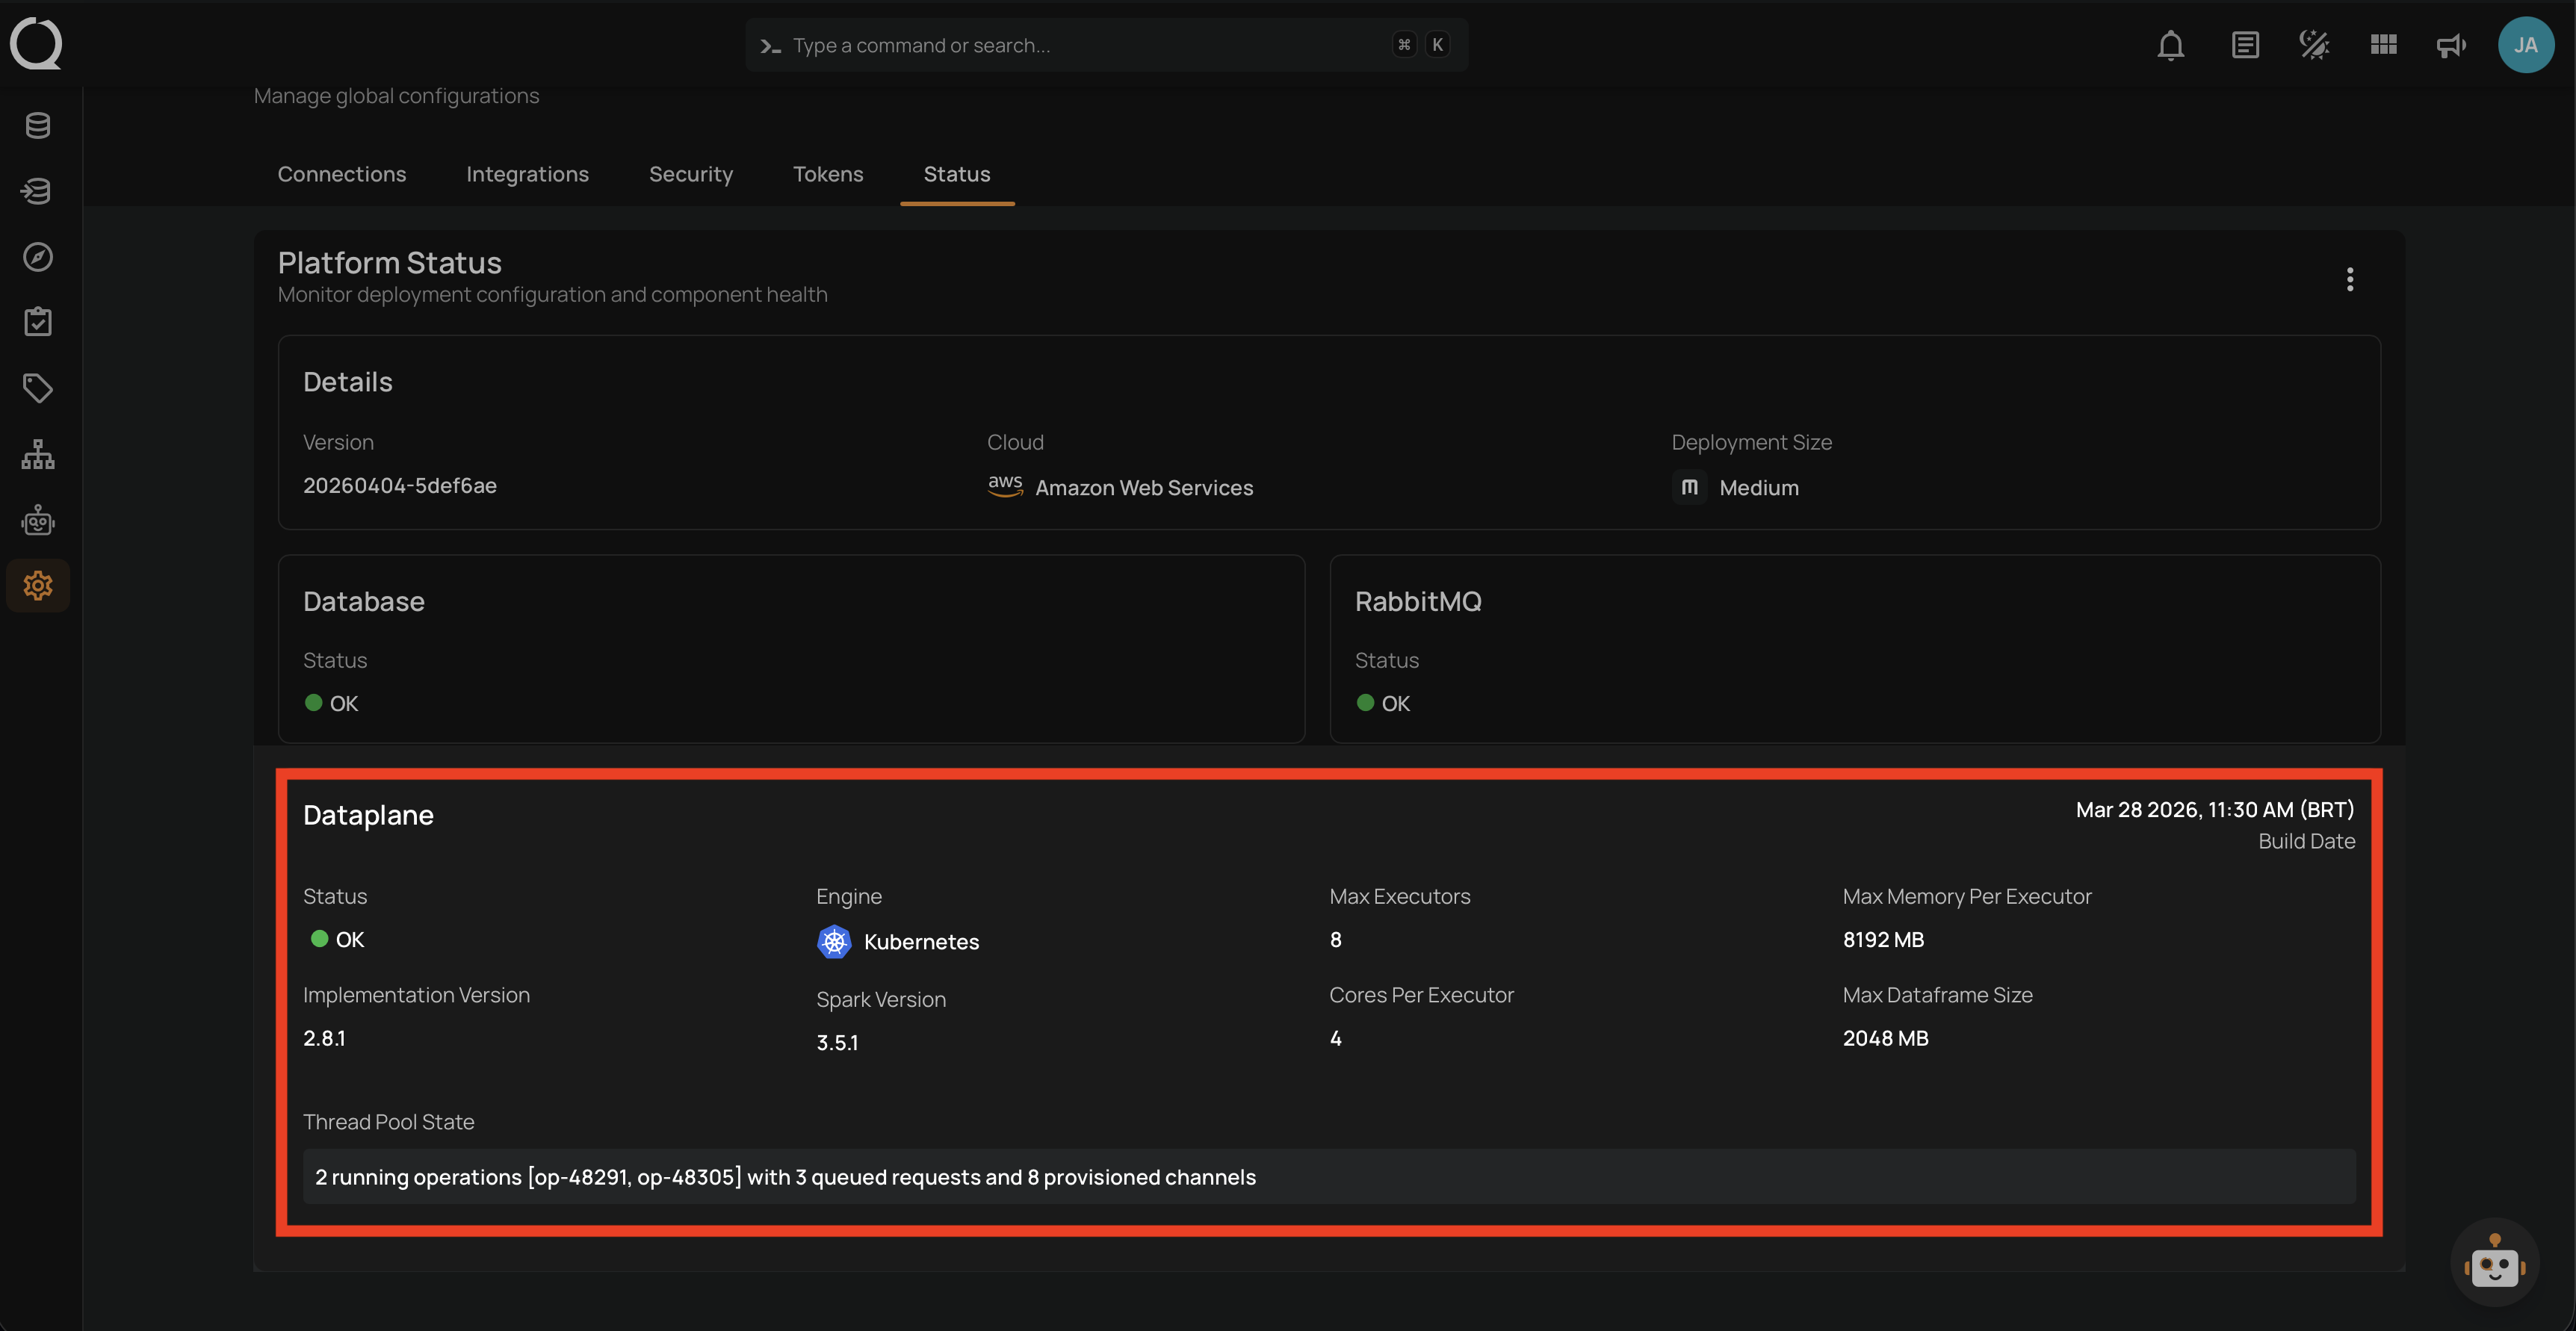
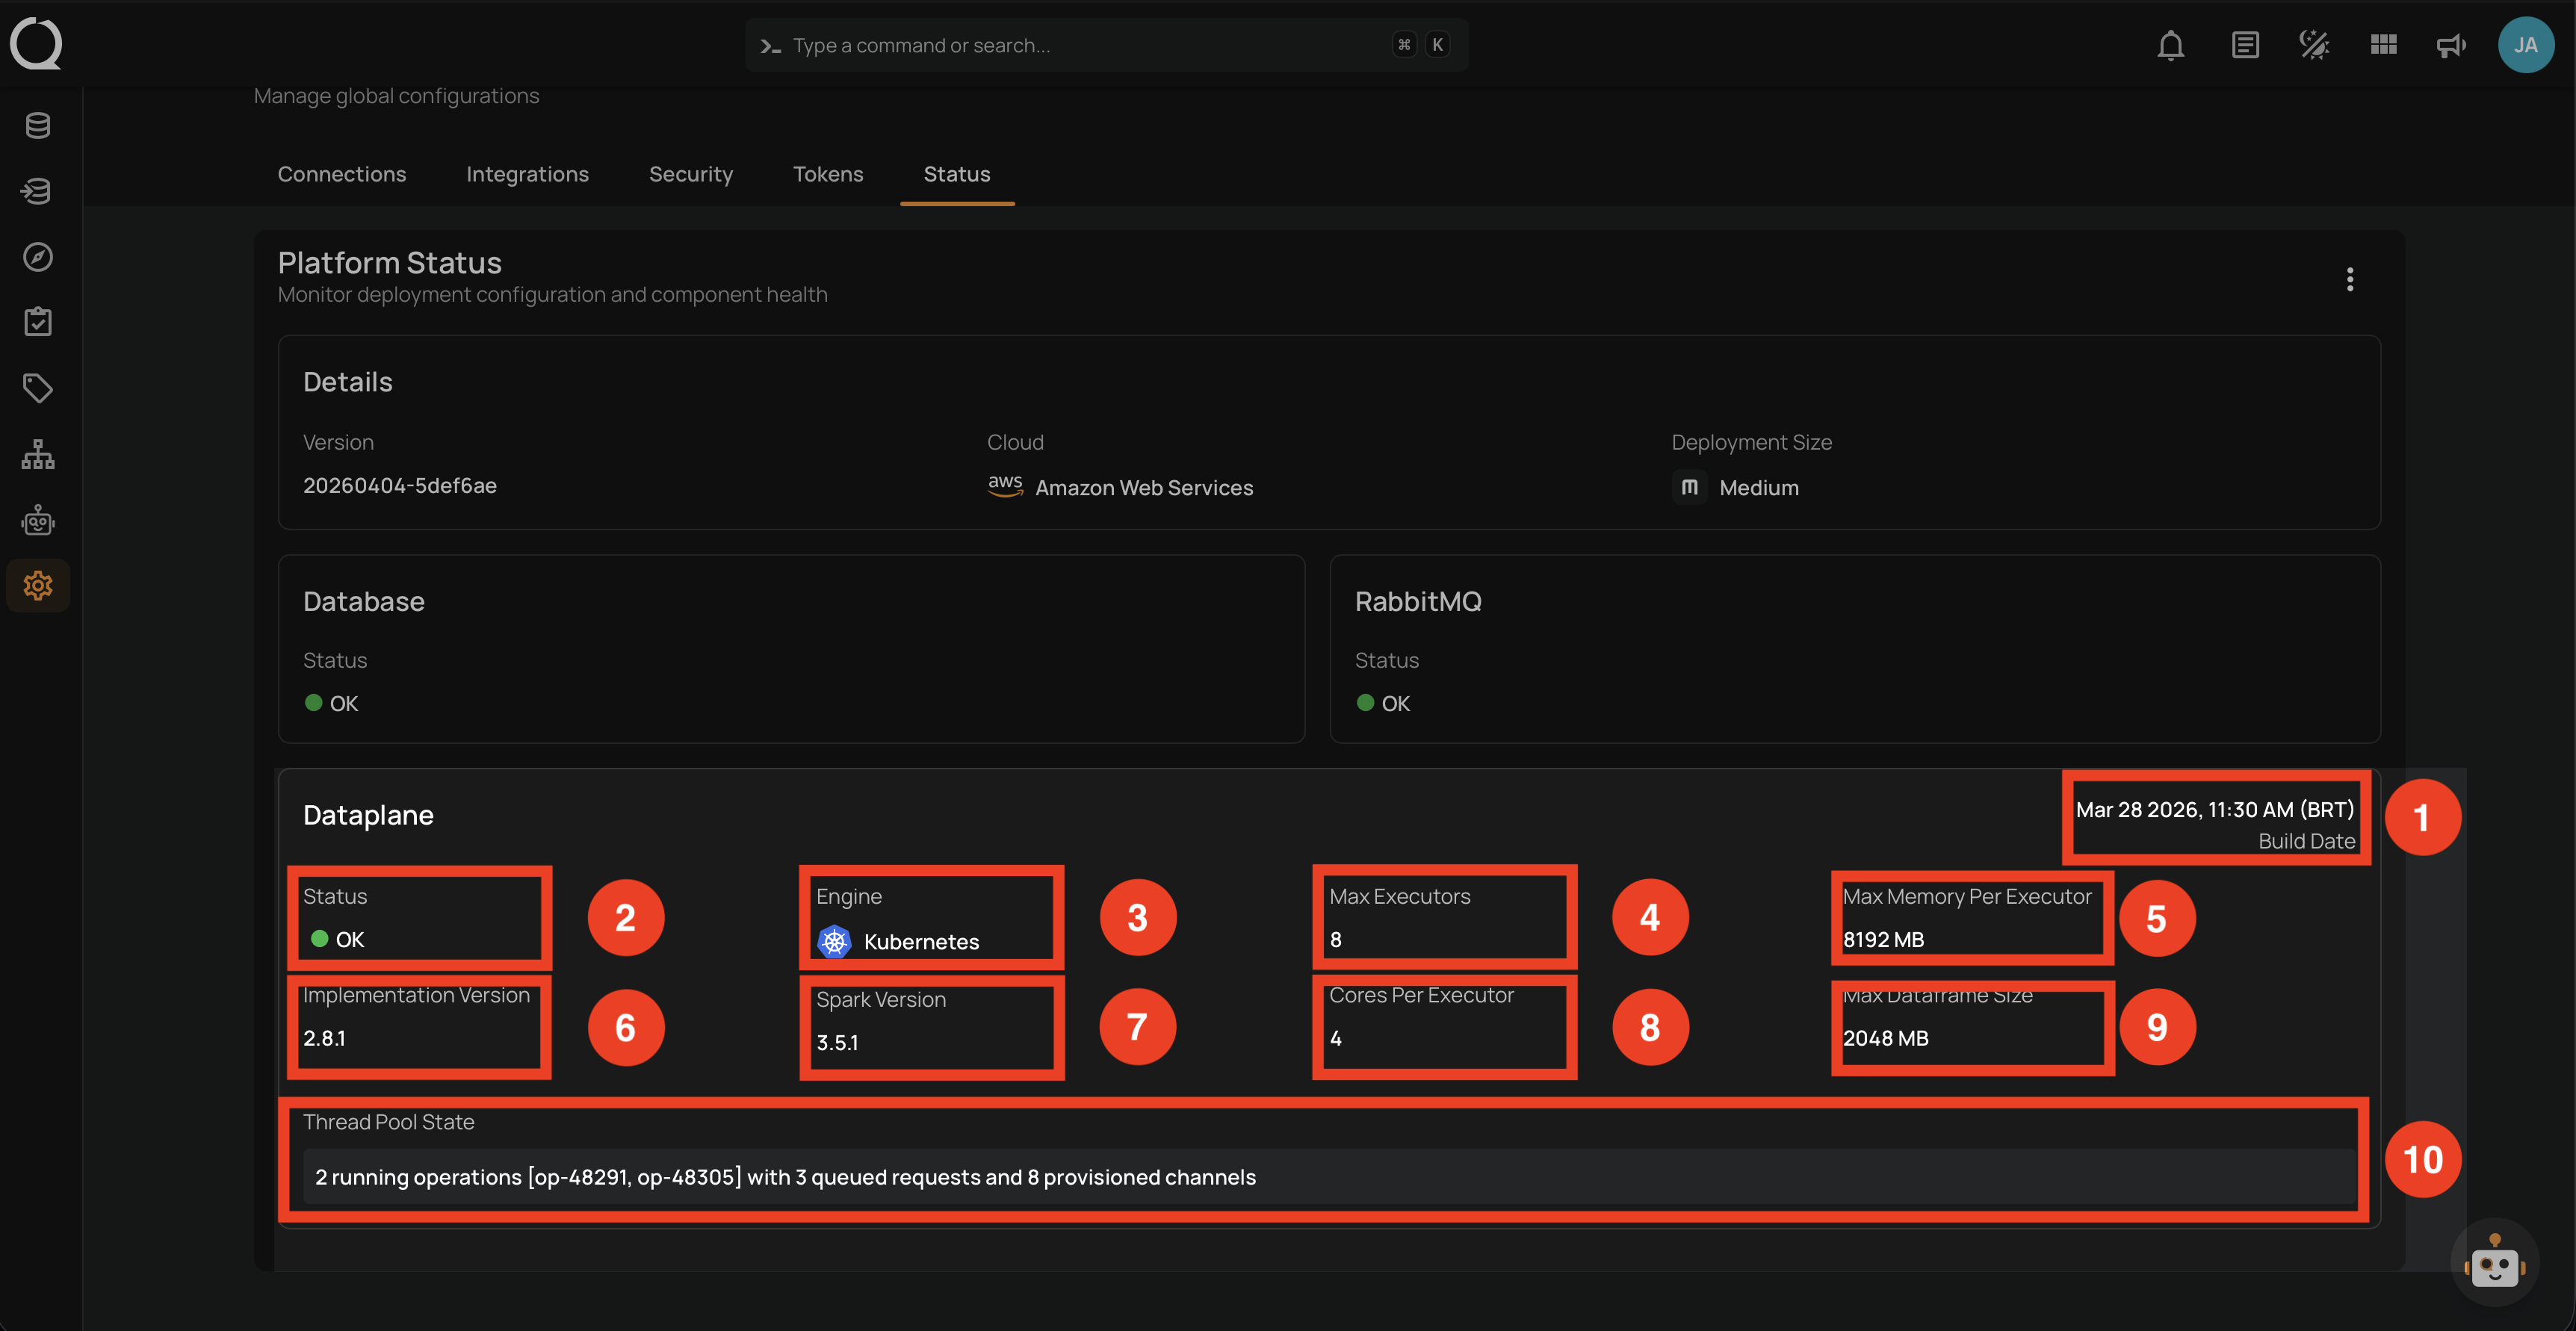
Fields
The section displays the dataplane's health, engine type, resource allocation, and current workload. The fields are organized in a 4-column grid with the Thread Pool State displayed full-width at the bottom.
| REF. | FIELD | DESCRIPTION |
|---|---|---|
| 1 | Build Date | The date and time when the dataplane was built, displayed in your local timezone (e.g., Mar 28 2026, 11:30 AM (BRT)). This value is read from the build manifest and helps verify which build is currently deployed. |
| 2 | Status | The dataplane health indicator. A green indicator with OK means the dataplane is healthy and ready to process operations. A red indicator with UNHEALTHY means the dataplane is not responding — all fields display -- and a Refresh button appears to retry the health check. |
| 3 | Engine | The compute runtime used to execute operations (Kubernetes, Databricks, or Local), displayed with the engine's logo. See Supported Engines below. |
| 4 | Max Executors | The maximum number of executor nodes allocated for parallel processing. Each executor is an independent worker that can run operations concurrently. |
| 5 | Max Memory Per Executor | The maximum amount of memory allocated to each executor (in MB). Higher values allow processing larger datasets without spilling to disk. |
| 6 | Implementation Version | The version of the dataplane currently running (e.g., 2.8.1). Comparing this with the controlplane Version in the Details section helps confirm that both layers are running compatible releases. |
| 7 | Spark Version | The version of Apache Spark used for data processing (e.g., 3.5.1). |
| 8 | Cores Per Executor | The number of CPU cores assigned to each executor. More cores improve processing speed for compute-intensive operations. |
| 9 | Max Dataframe Size | The maximum size of a single dataframe that can be processed (in MB). This determines the largest dataset that can be loaded into memory for a single operation. |
| 10 | Thread Pool State | A real-time snapshot of the current workload, showing active operations, queued requests, and provisioned channels. See Understanding Thread Pool State below. |
Tip
If the dataplane status is UNHEALTHY, try refreshing the status first. If the issue persists, you can restart the dataplane from the actions menu. See Restart Dataplane for step-by-step instructions.
Supported Engines
| No. | Logo | Engine |
|---|---|---|
| 1. | Kubernetes | |
| 2. | Databricks | |
| 3. | Local |
Note
The Local engine is used for self-hosted deployments where the dataplane runs directly on the host machine rather than on a managed container orchestration platform.
Understanding Thread Pool State
The Thread Pool State is displayed at the bottom of the Dataplane card inside a rounded box with a light background. It provides a real-time snapshot of the current workload.
Example:
2 running operations [op-101, op-102] with 3 queued requests and 8 provisioned channels
This string contains three components:
Running operations — The number of operations currently being executed, followed by their operation IDs in brackets. Each ID corresponds to an active Sync, Profile, Scan, External Scan, Export, or Materialize operation.
Queued requests — The number of operations waiting to be picked up by the dataplane. Operations are queued when all available executor slots are occupied. Once a running operation completes, the next queued request is picked up automatically.
Provisioned channels — The number of RabbitMQ communication channels available for sending results back to the controlplane. These are managed automatically — the pool starts with a default set (typically 10 channels) and scales up under load.
Reading Thread Pool State
Here are some common patterns and what they mean:
- Idle —
0 running operations [] with 0 queued requests and 10 provisioned channels - No operations are running or waiting. The system is ready to accept work.
- Active —
4 running operations [op-101, op-205, op-309, op-412] with 0 queued requests and 10 provisioned channels - Four operations are running with no backlog. The dataplane has capacity to accept more work.
- Full capacity —
8 running operations [op-101, op-102, ..., op-108] with 15 queued requests and 25 provisioned channels - All executor slots are occupied with 15 operations waiting. The channel pool has scaled up to handle the increased throughput.
Tip
If you consistently see a high number of queued requests, it may indicate that your deployment needs more executors to handle the workload. Contact the Qualytics support team to discuss scaling options.
Info
When the dataplane is unhealthy, the Thread Pool State displays -- along with all other fields.
License
The License section appears on the Platform Status page only for self-hosted deployments. It shows the license expiration date and provides buttons to generate a license request or apply a new license key.
The expiration date changes color and shows a timer icon depending on the license state:
- Expiring soon (within 30 days of the expiration date): the date turns warning-colored and a icon appears, with the tooltip "License expires in less than a month".
- Expired (past the expiration date): the date turns negative-colored and a icon appears, with the tooltip "License has expired".
If no license is applied, the section shows No license found with a grace-period notice or a Grace period expired error alert. For the full breakdown (fields, grace period, license request, license update, and permissions) see How Licensing Works.