Source Records
The Source Records section of the Anomaly Details view provides a detailed look at the records from your dataset that triggered anomalies. Visual highlights indicate the specific fields that failed quality checks. All displayed records come from the linked Enrichment Datastore, which captures the rows and metadata produced by each scan.
If the Anomaly Type is Shape, the highlighted column(s) with anomalies appear in the source record.
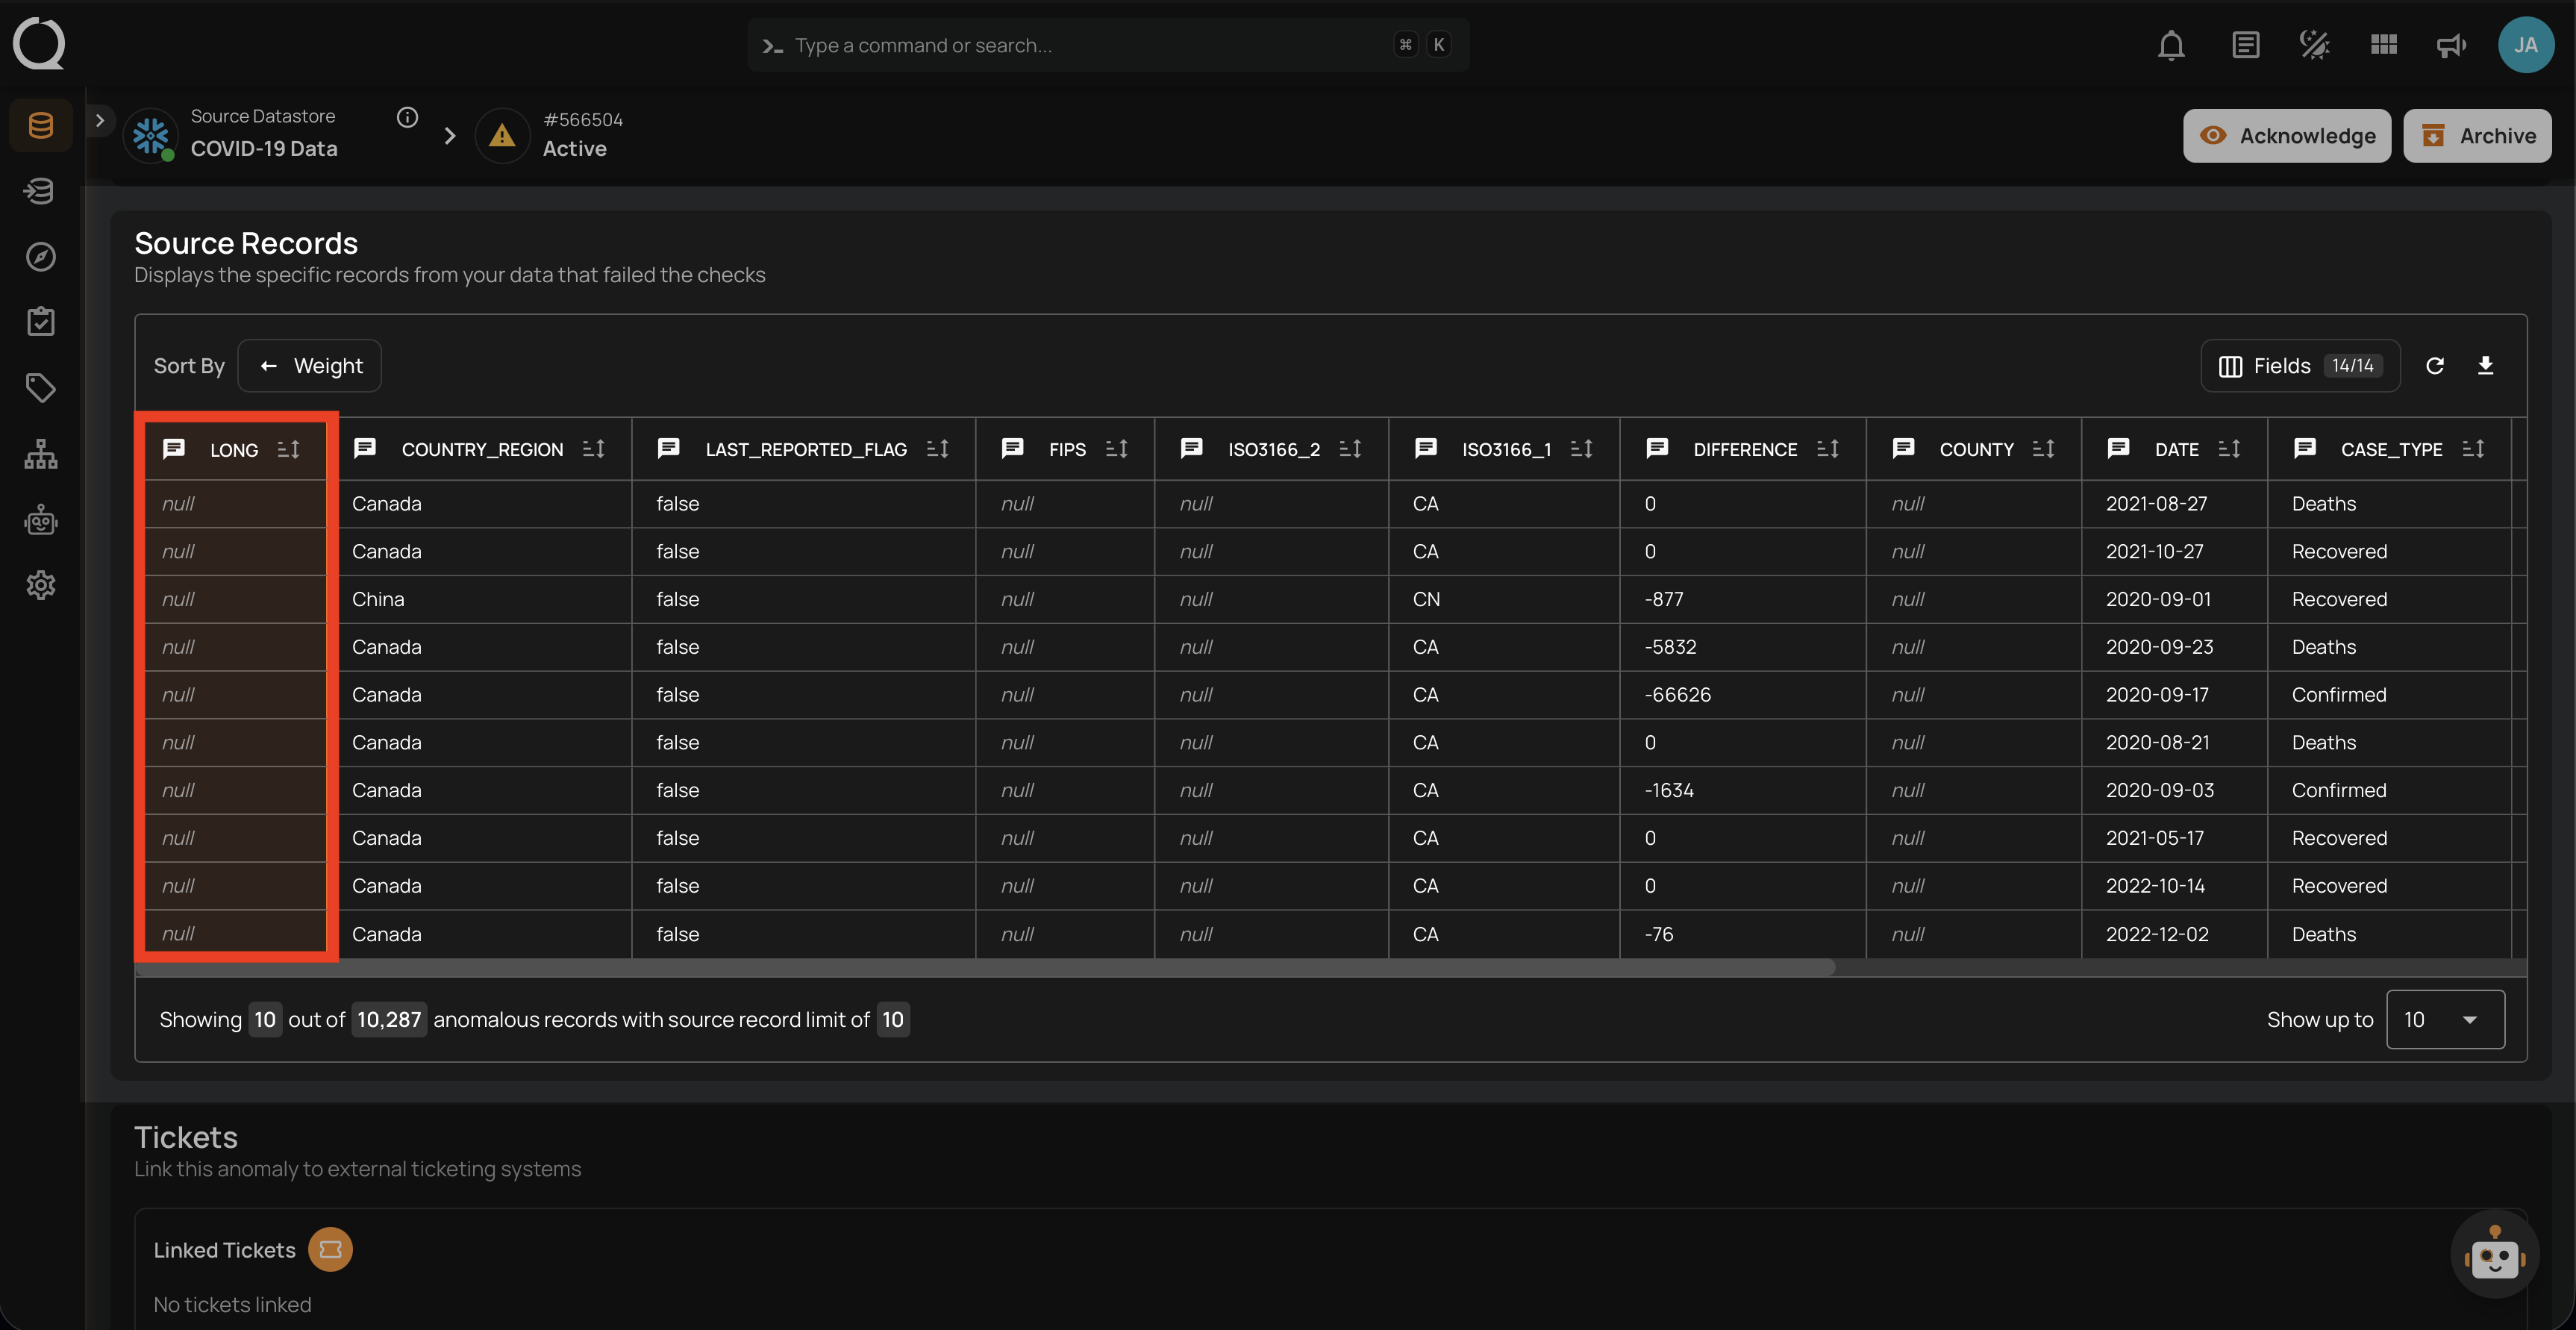
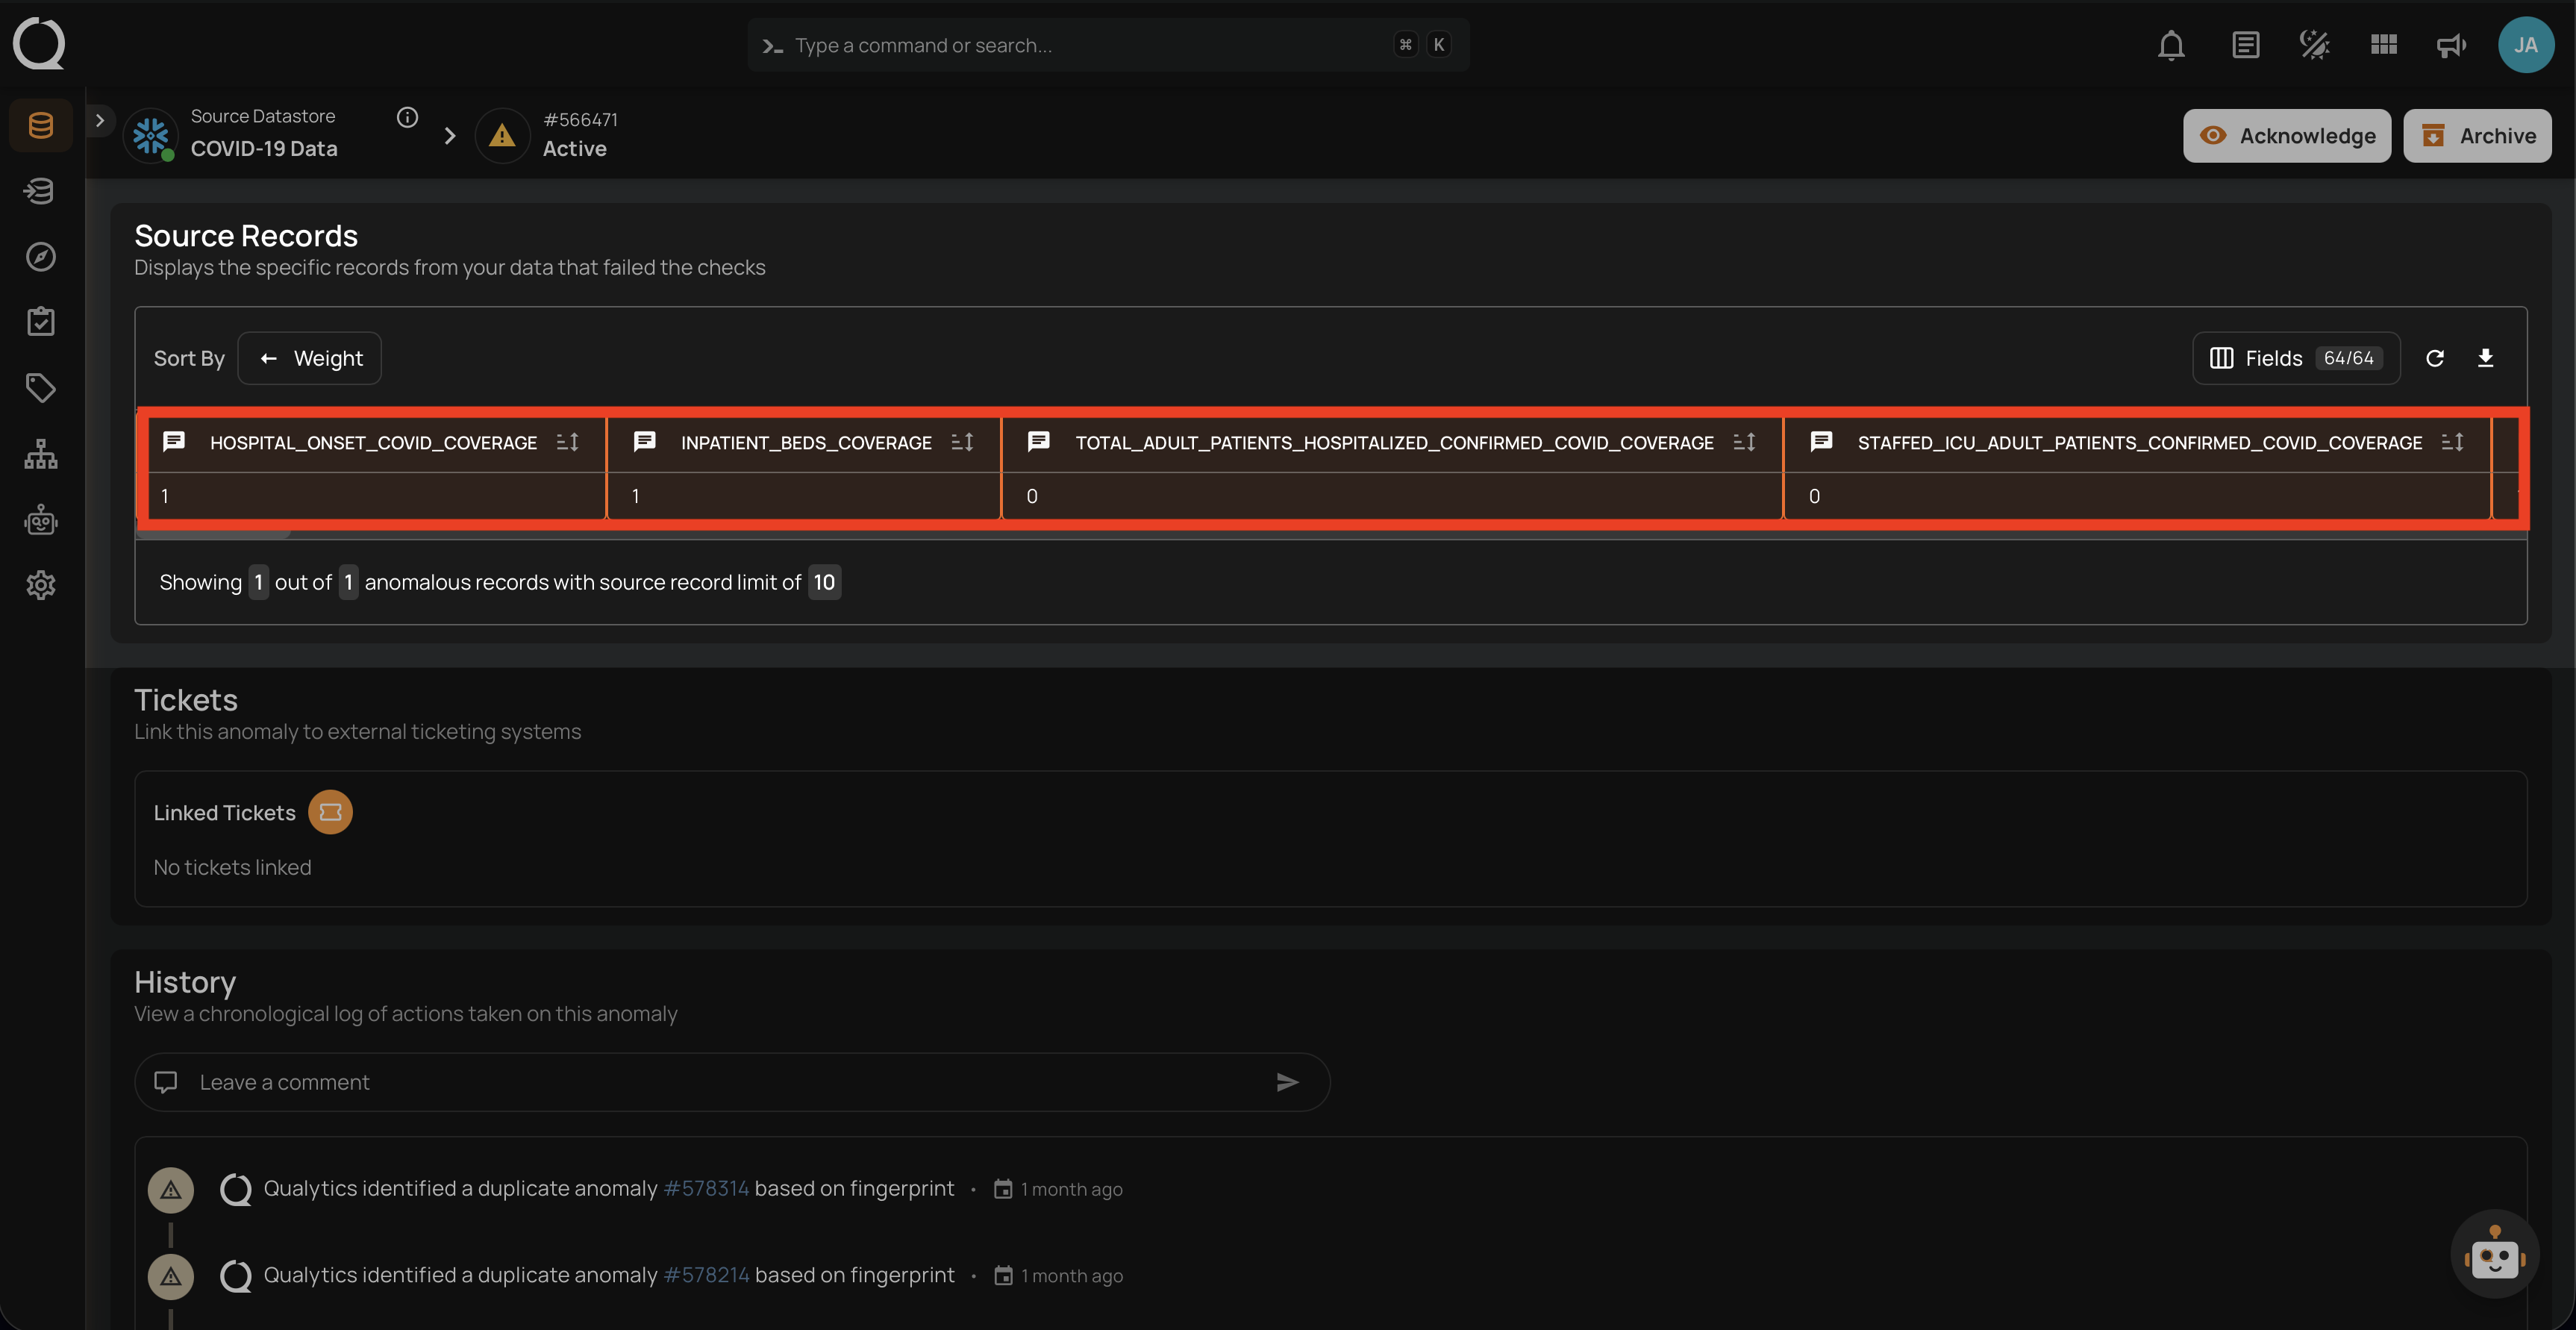
If the Anomaly Type is Record, the highlighted row(s) that failed the checks appear in the source record.
Note
Source records appear in the Anomaly Details view. For a Record anomaly, the specific record is highlighted. For a Shape anomaly, up to 10 samples from the underlying anomalous records are highlighted by default (configurable per scan).
Source Record Visualization
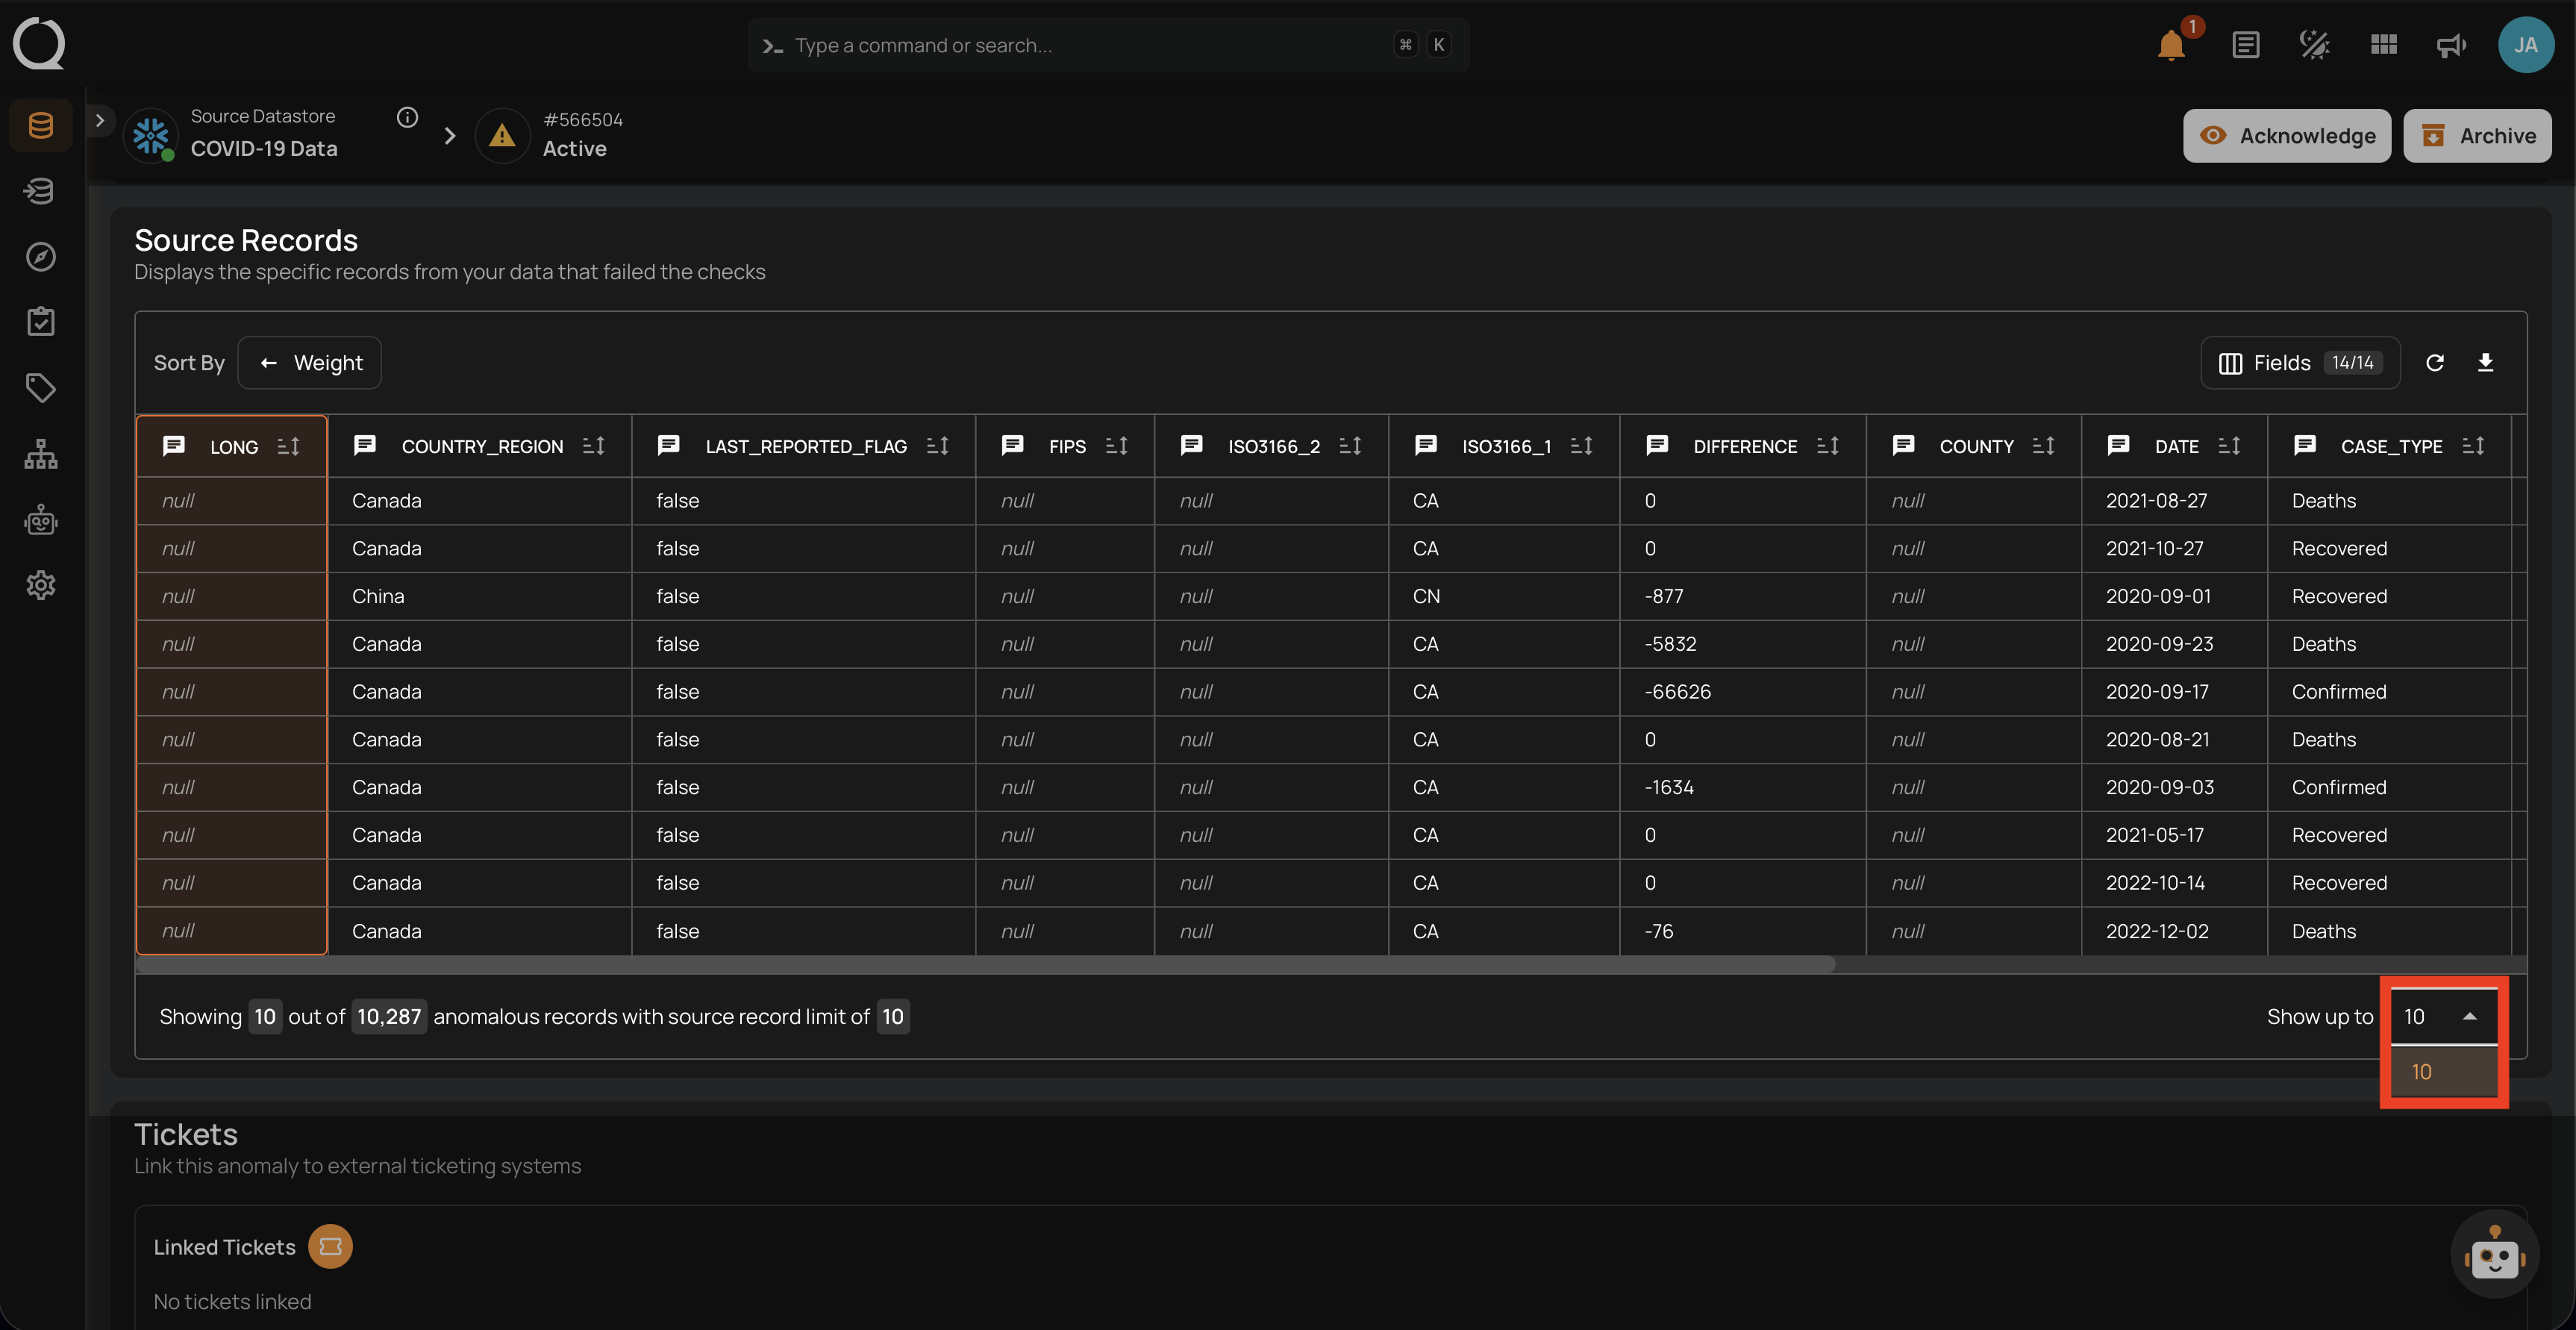
The number of source records displayed per anomaly is determined by the Maximum Source Examples per Anomaly setting, which can be configured during scan setup. The available limits are 10, 100, 1,000, or 10,000 records. The interface includes sticky headers that remain visible when scrolling through large datasets, making navigation easier during data review.
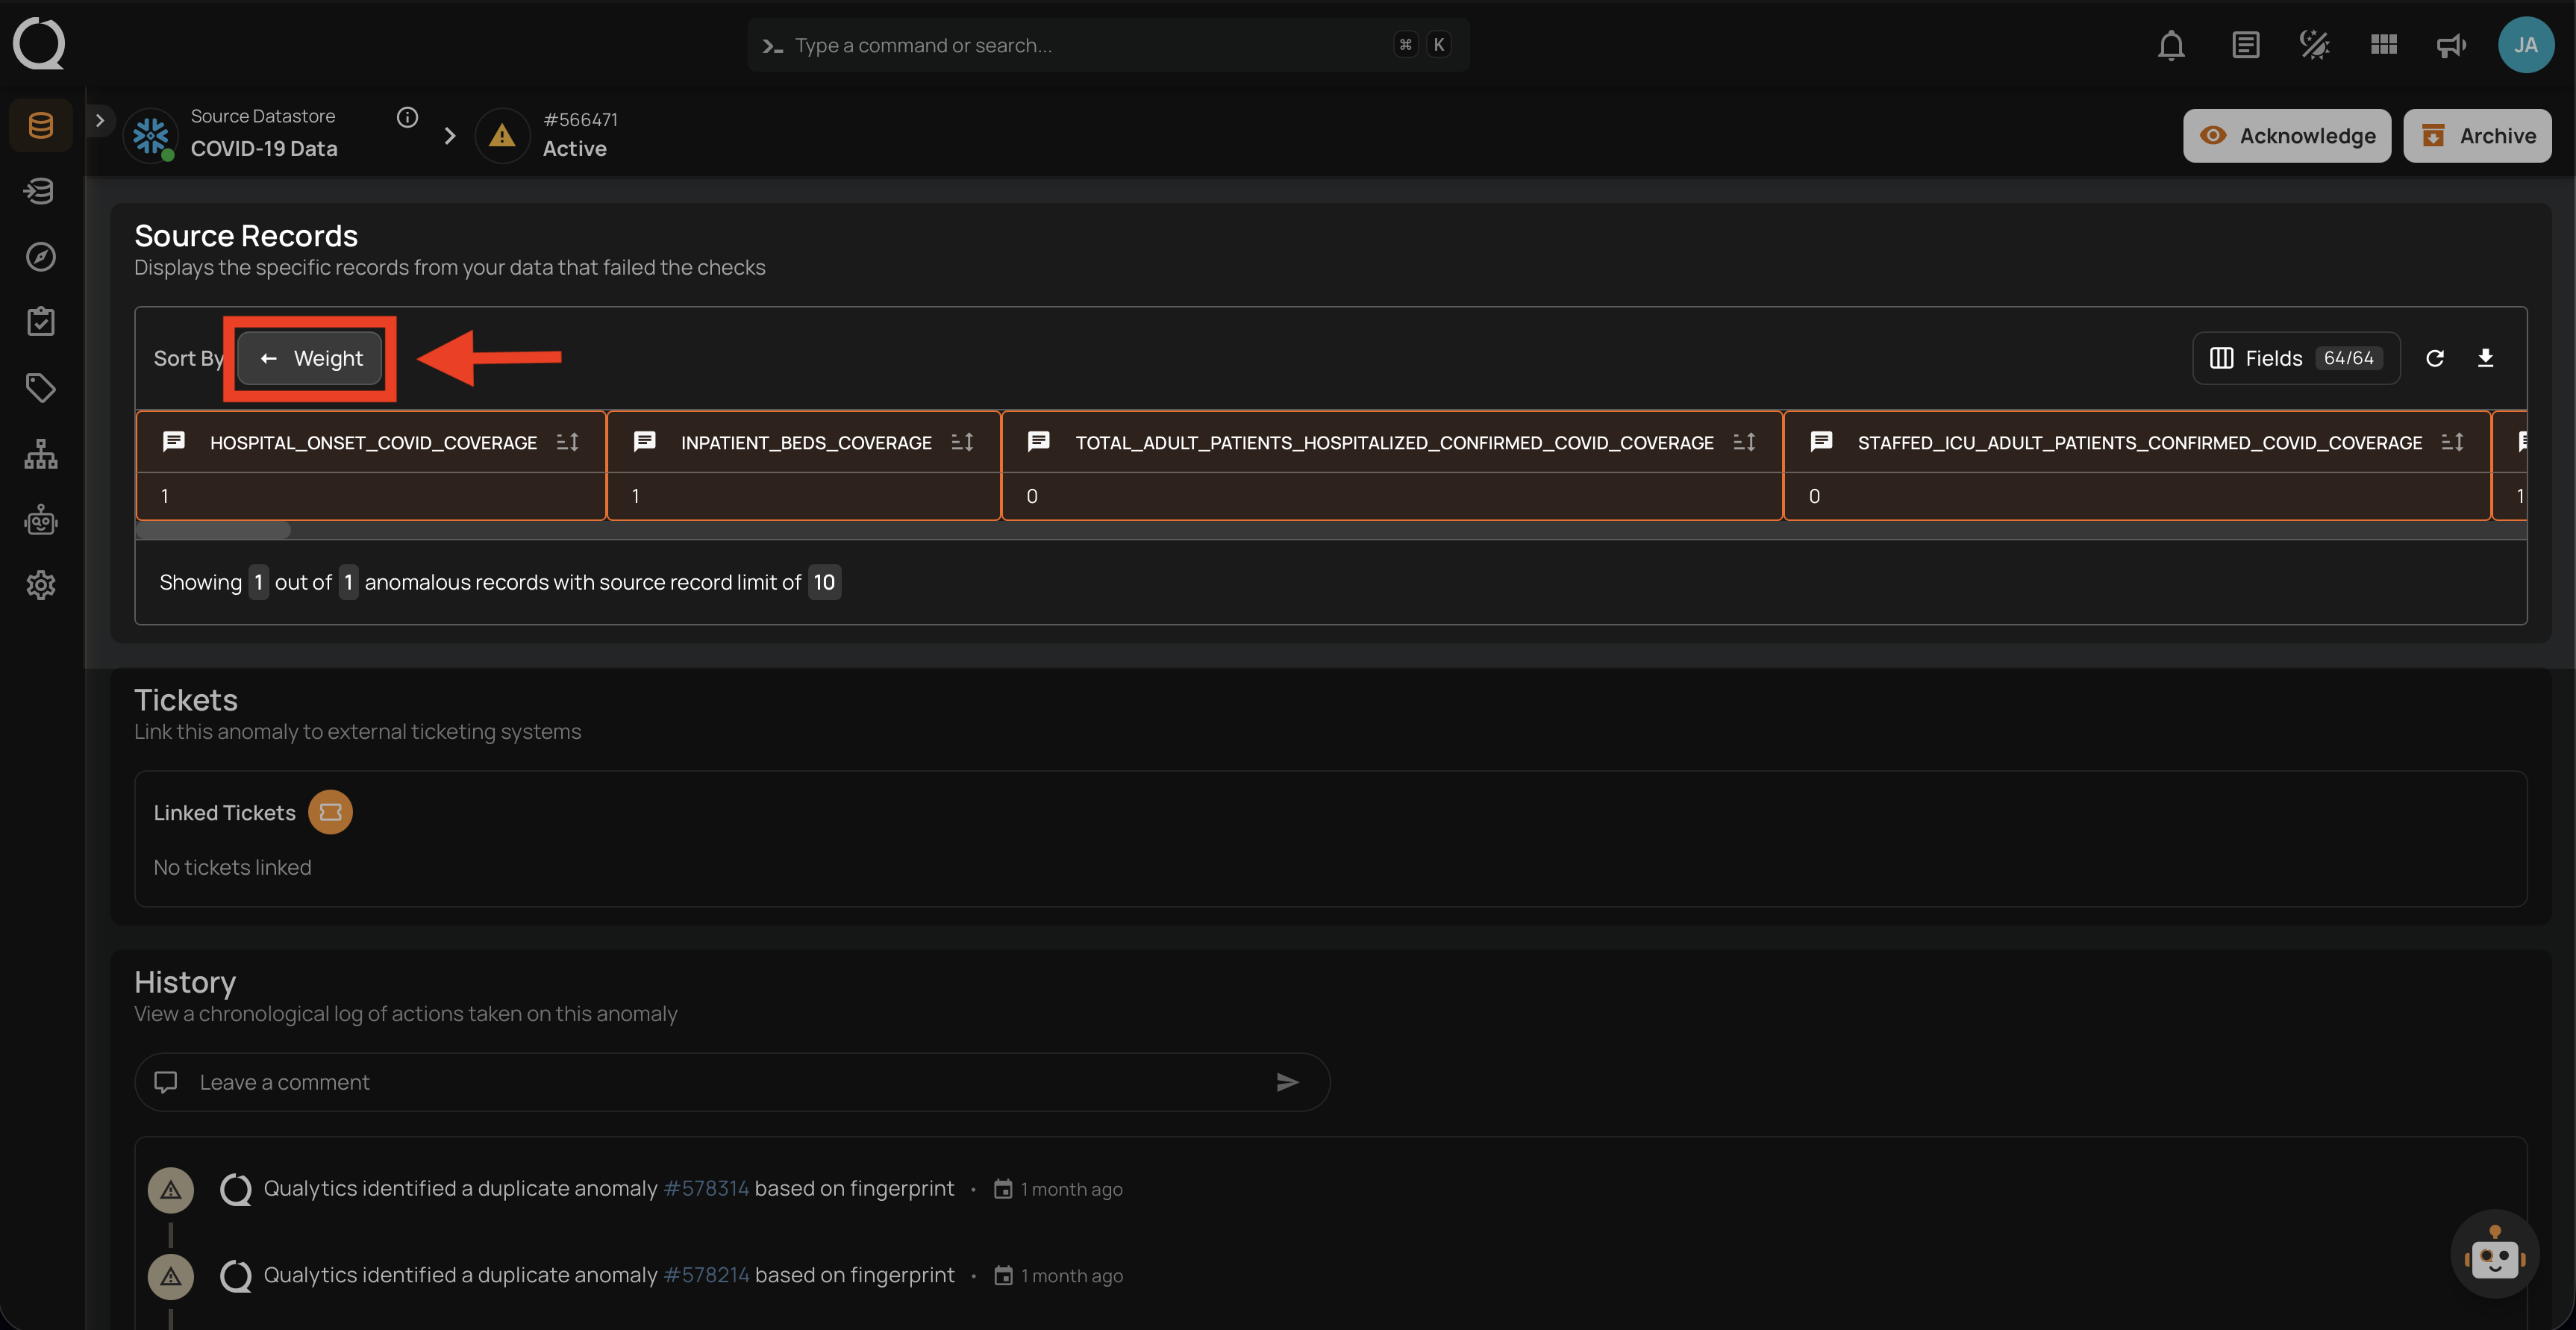
Sort By
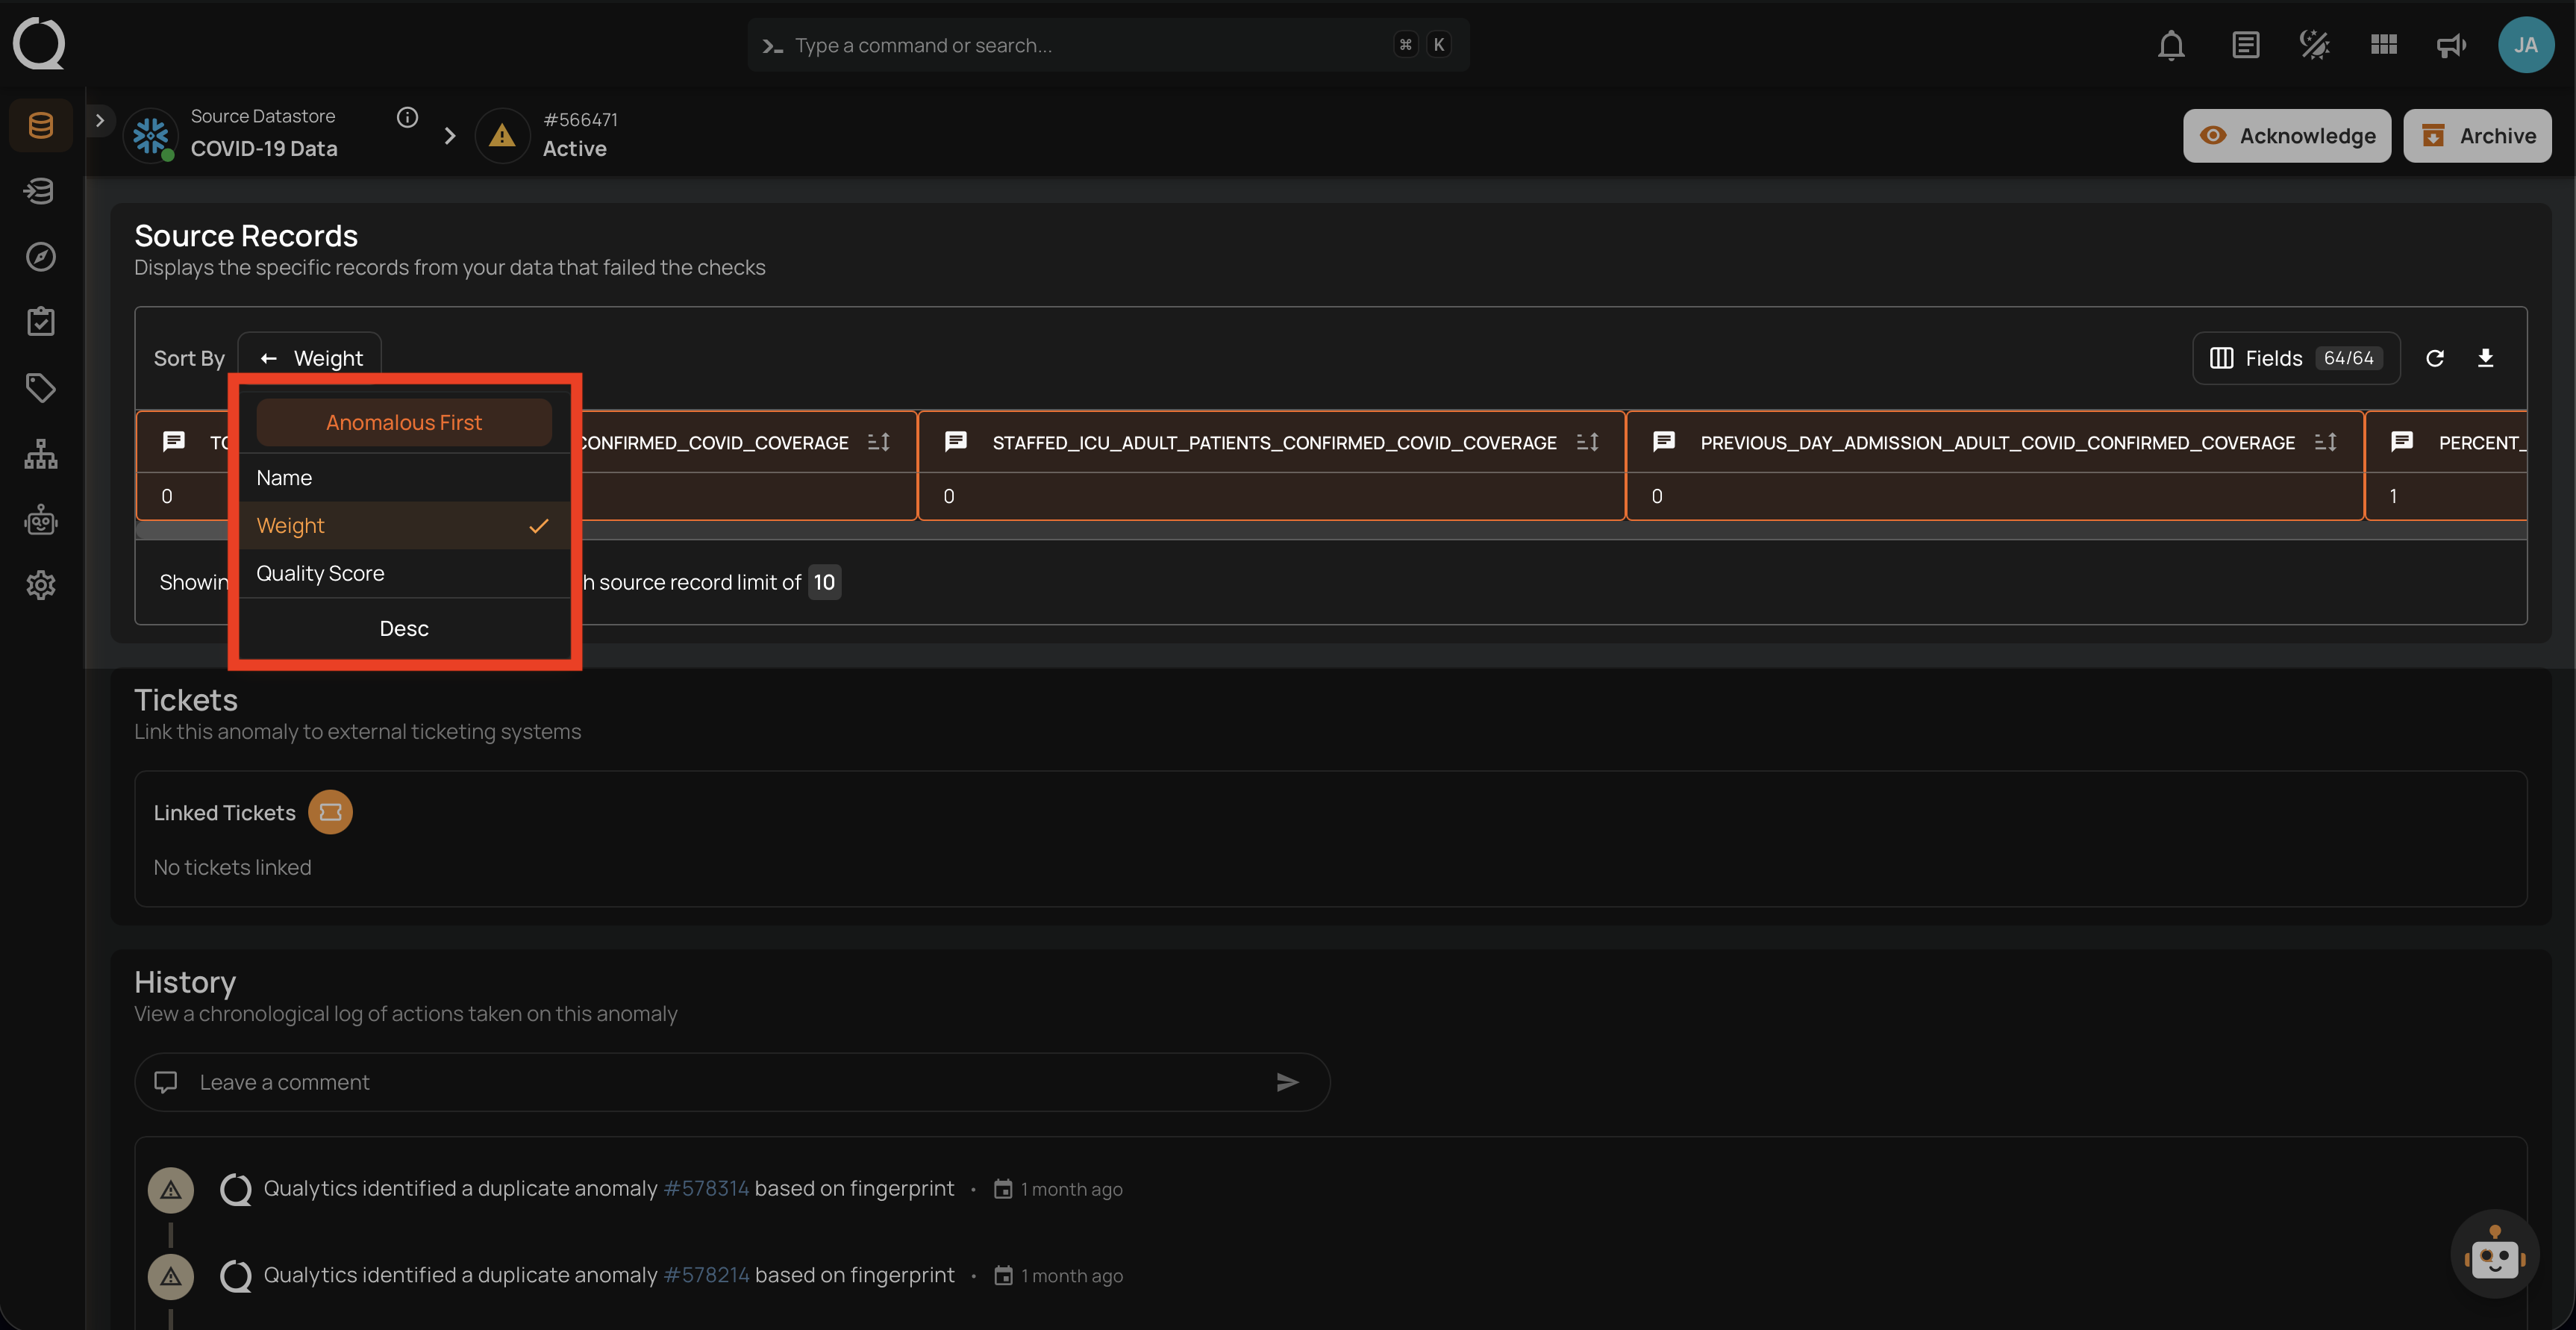
The Sort By option allows you to organize the source record columns. Click the Sort By button to open a dropdown with the available sorting options.
The available sort options are:
| Option | Description |
|---|---|
| Anomalous First | Prioritizes anomalous fields at the beginning of the table. Enabled by default and automatically disabled when the Only Anomalous filter is active. |
| Name | Sorts columns alphabetically by field name. |
| Importance | Sorts columns by the field weight value. Default sort option. |
| Quality Score | Sorts columns by the field quality score. |
| Asc / Desc | Toggles between ascending and descending order for the selected sort option. |
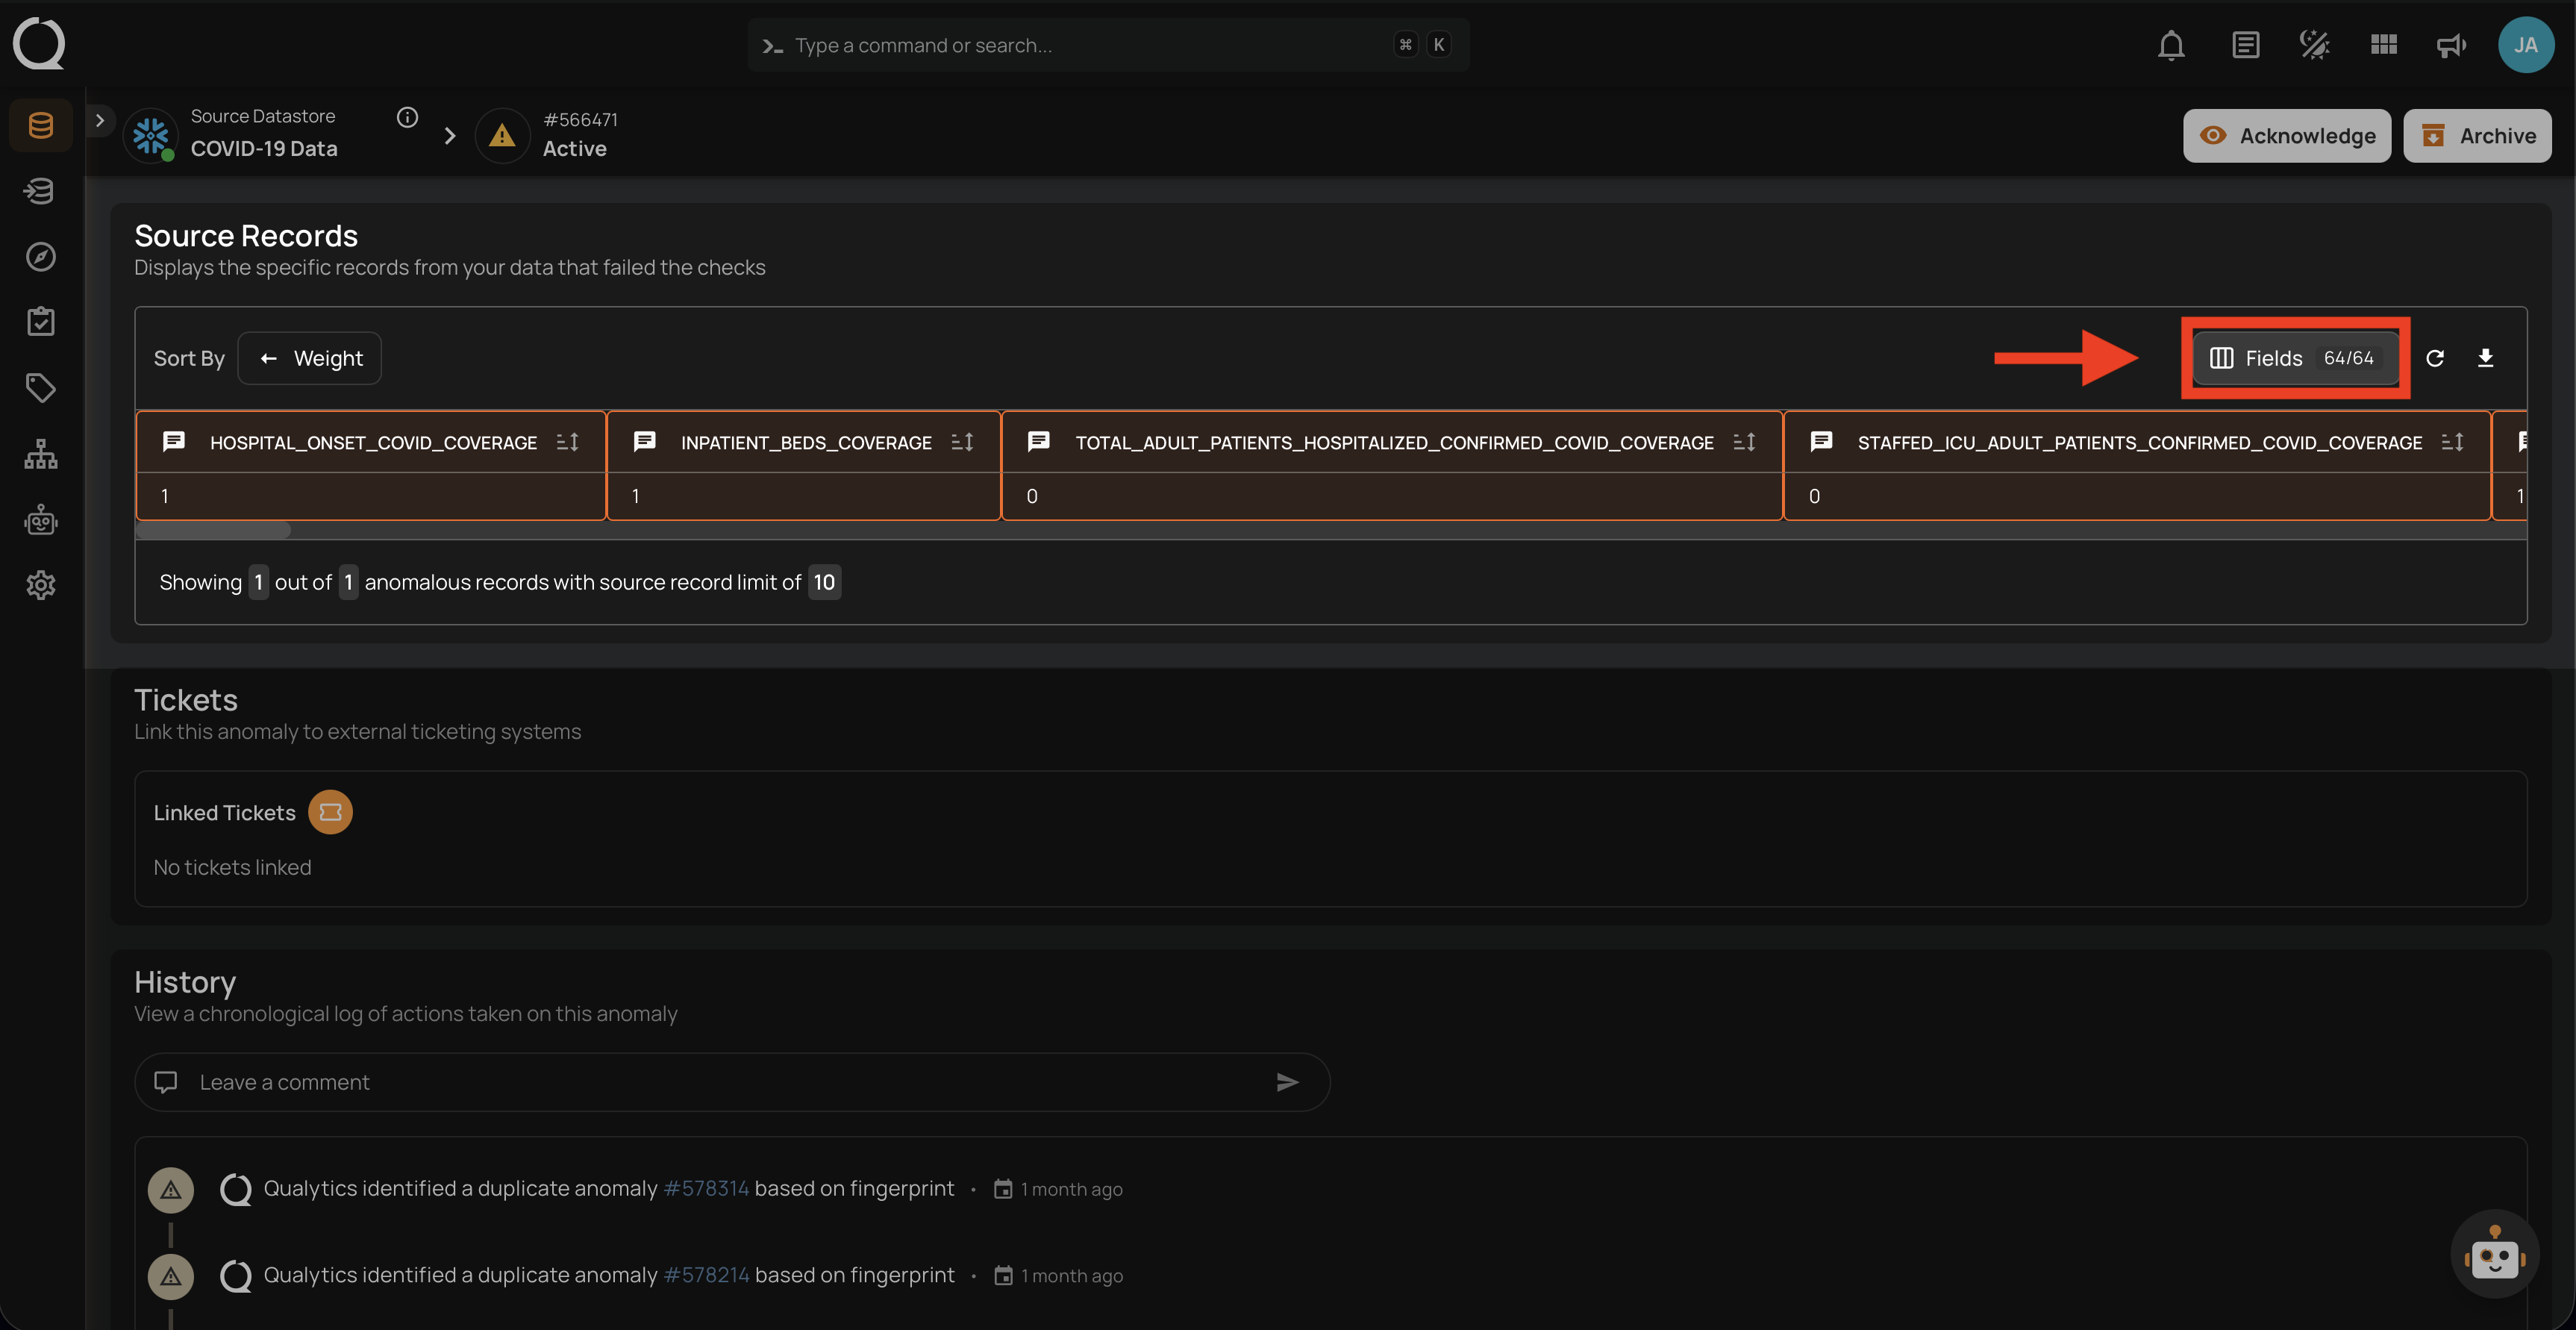
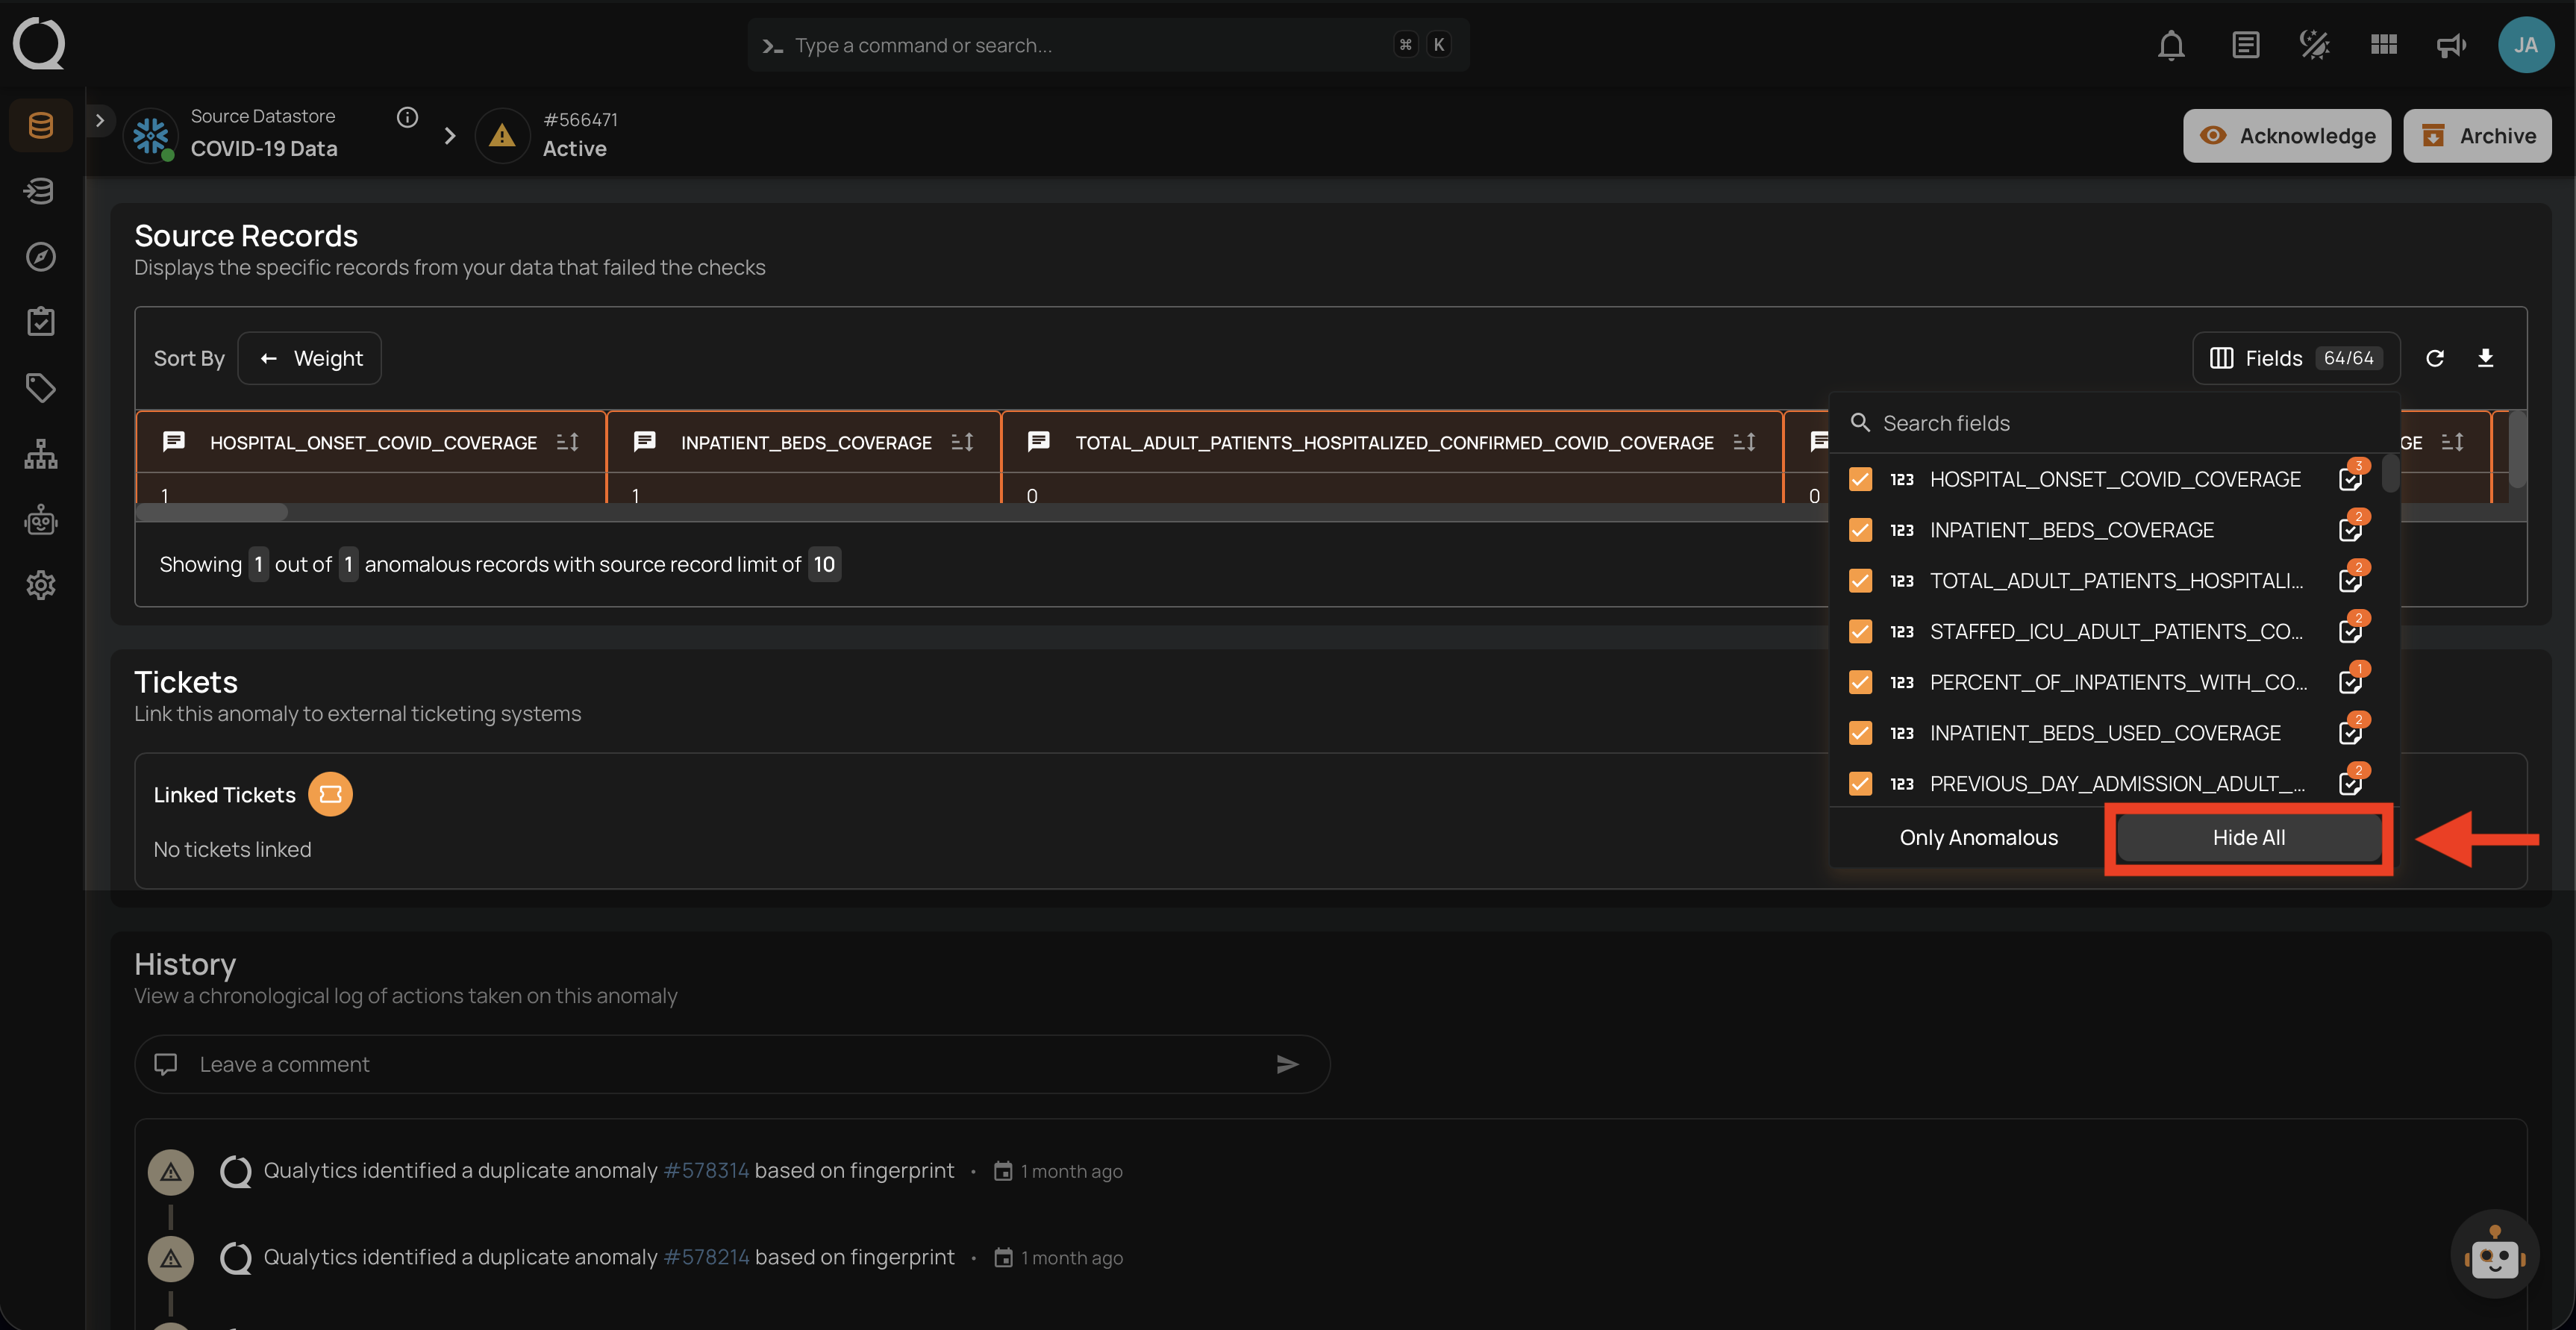
Fields
The Fields button displays a badge with the count of visible fields out of the total fields (e.g., 64/64). Click it to open a searchable dropdown where you can control which columns are displayed in the source records table.
The dropdown lists all available fields with toggles to show or hide each one individually.
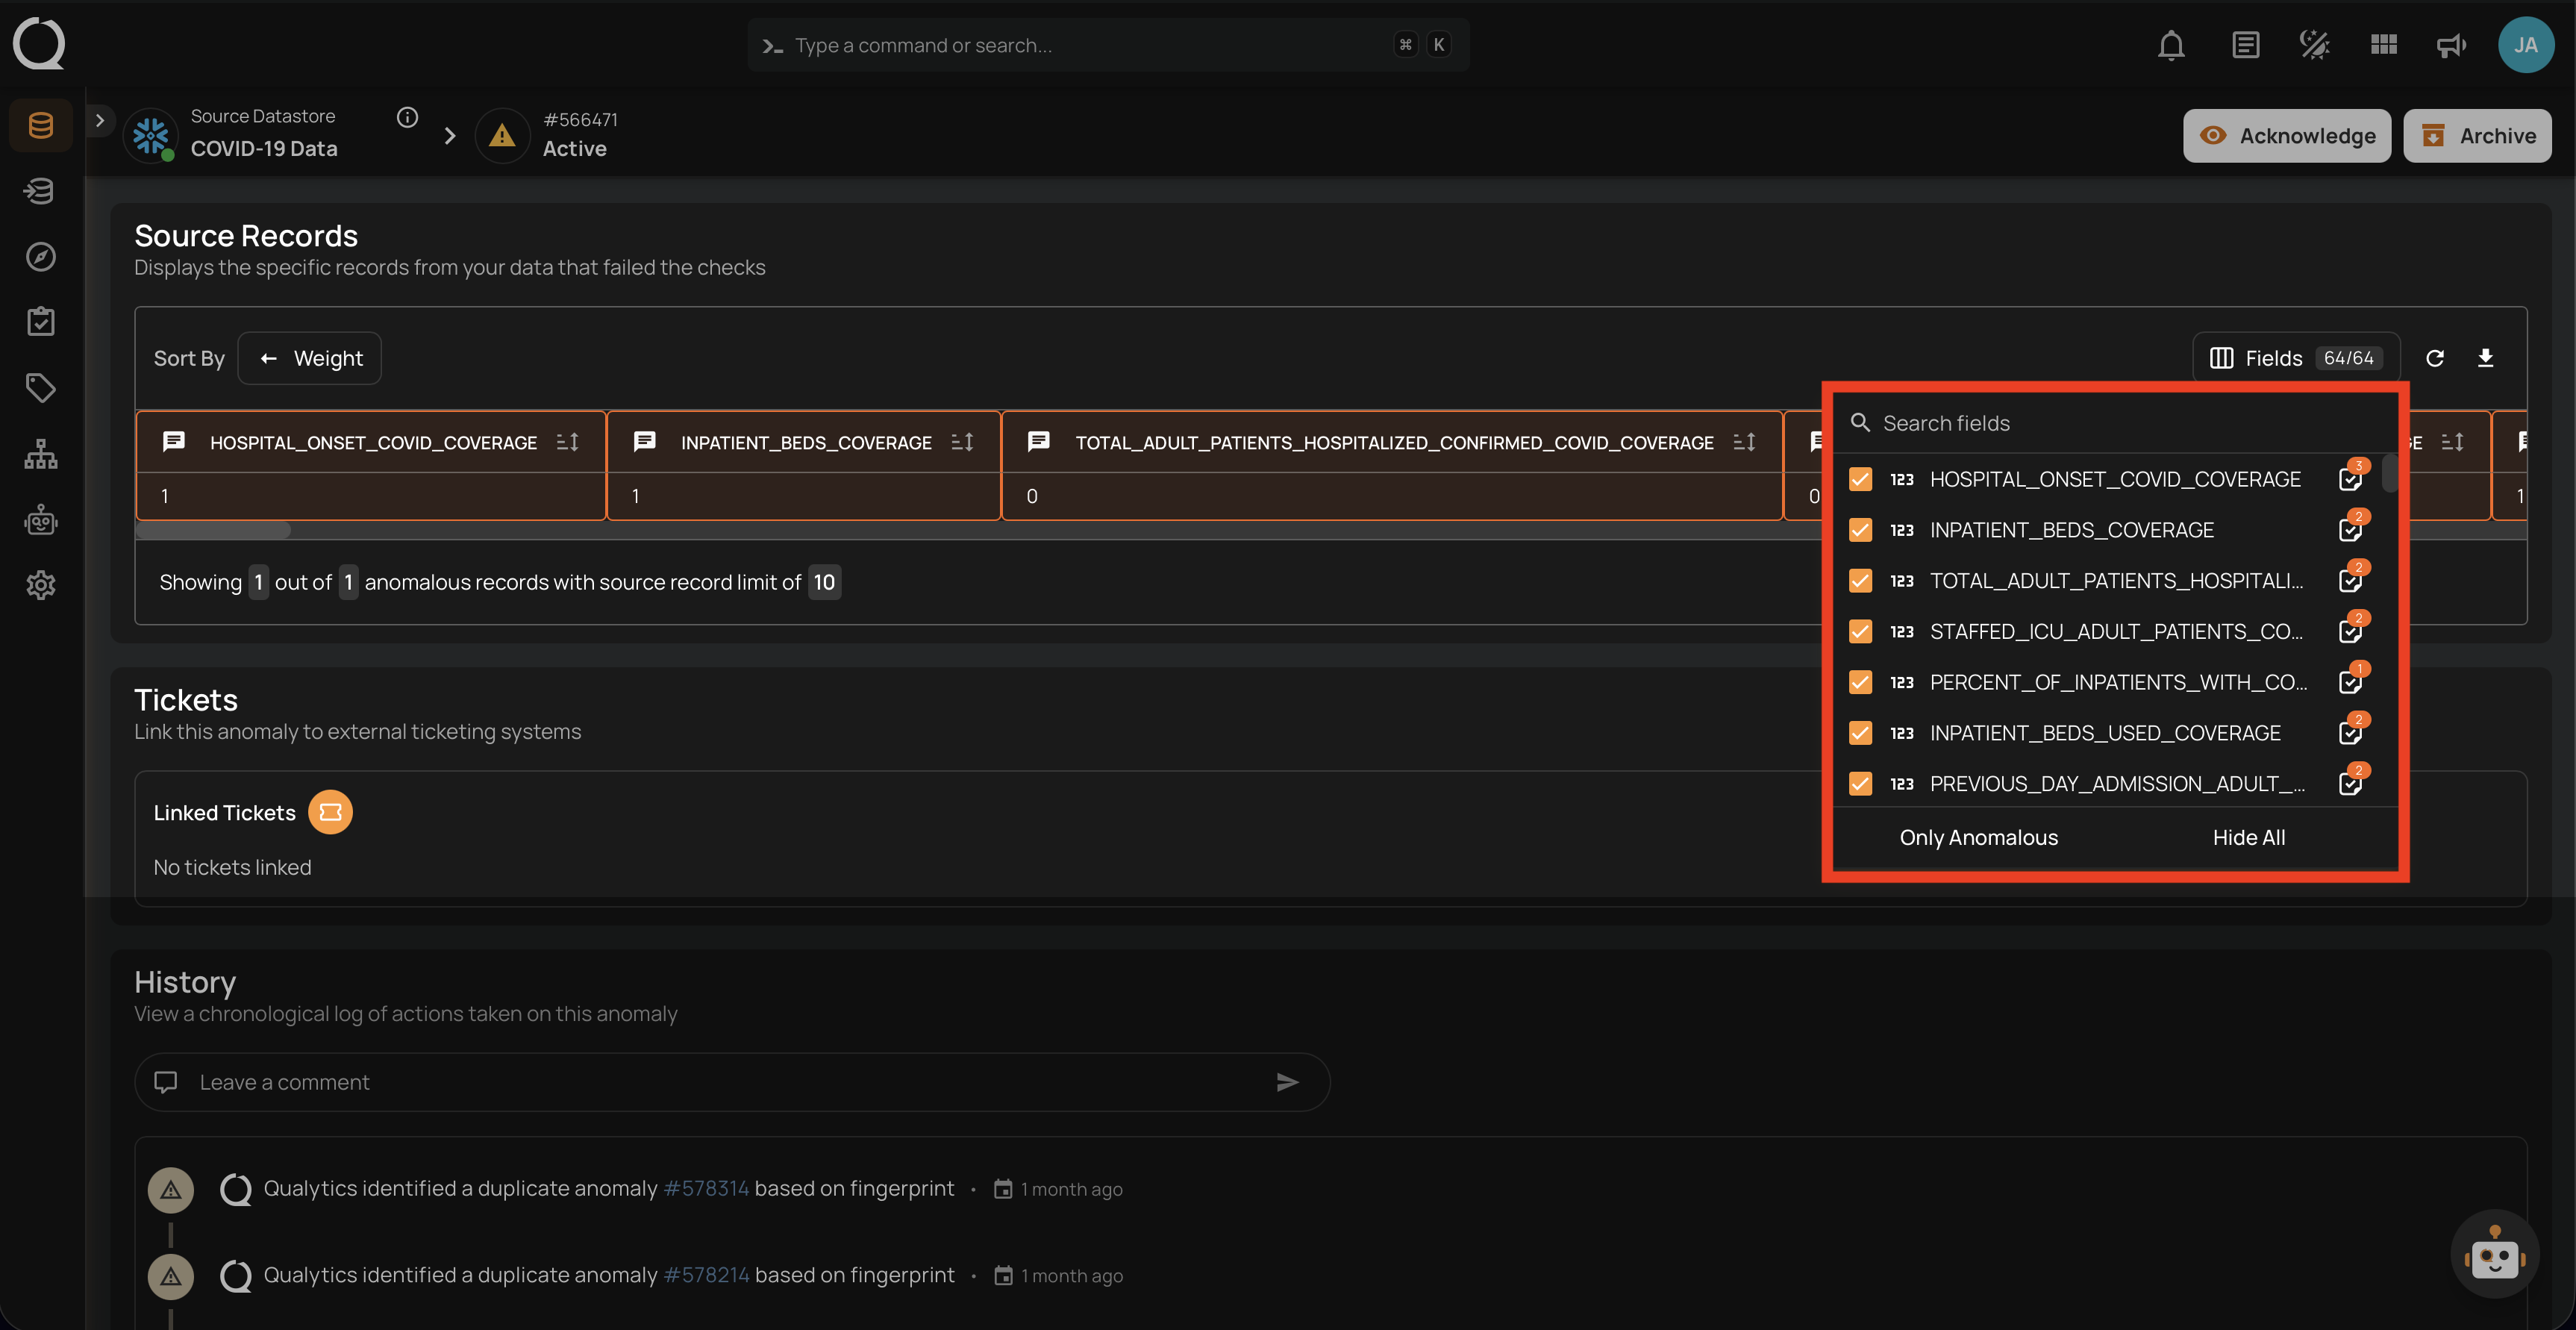
At the bottom of the dropdown, two actions are available:
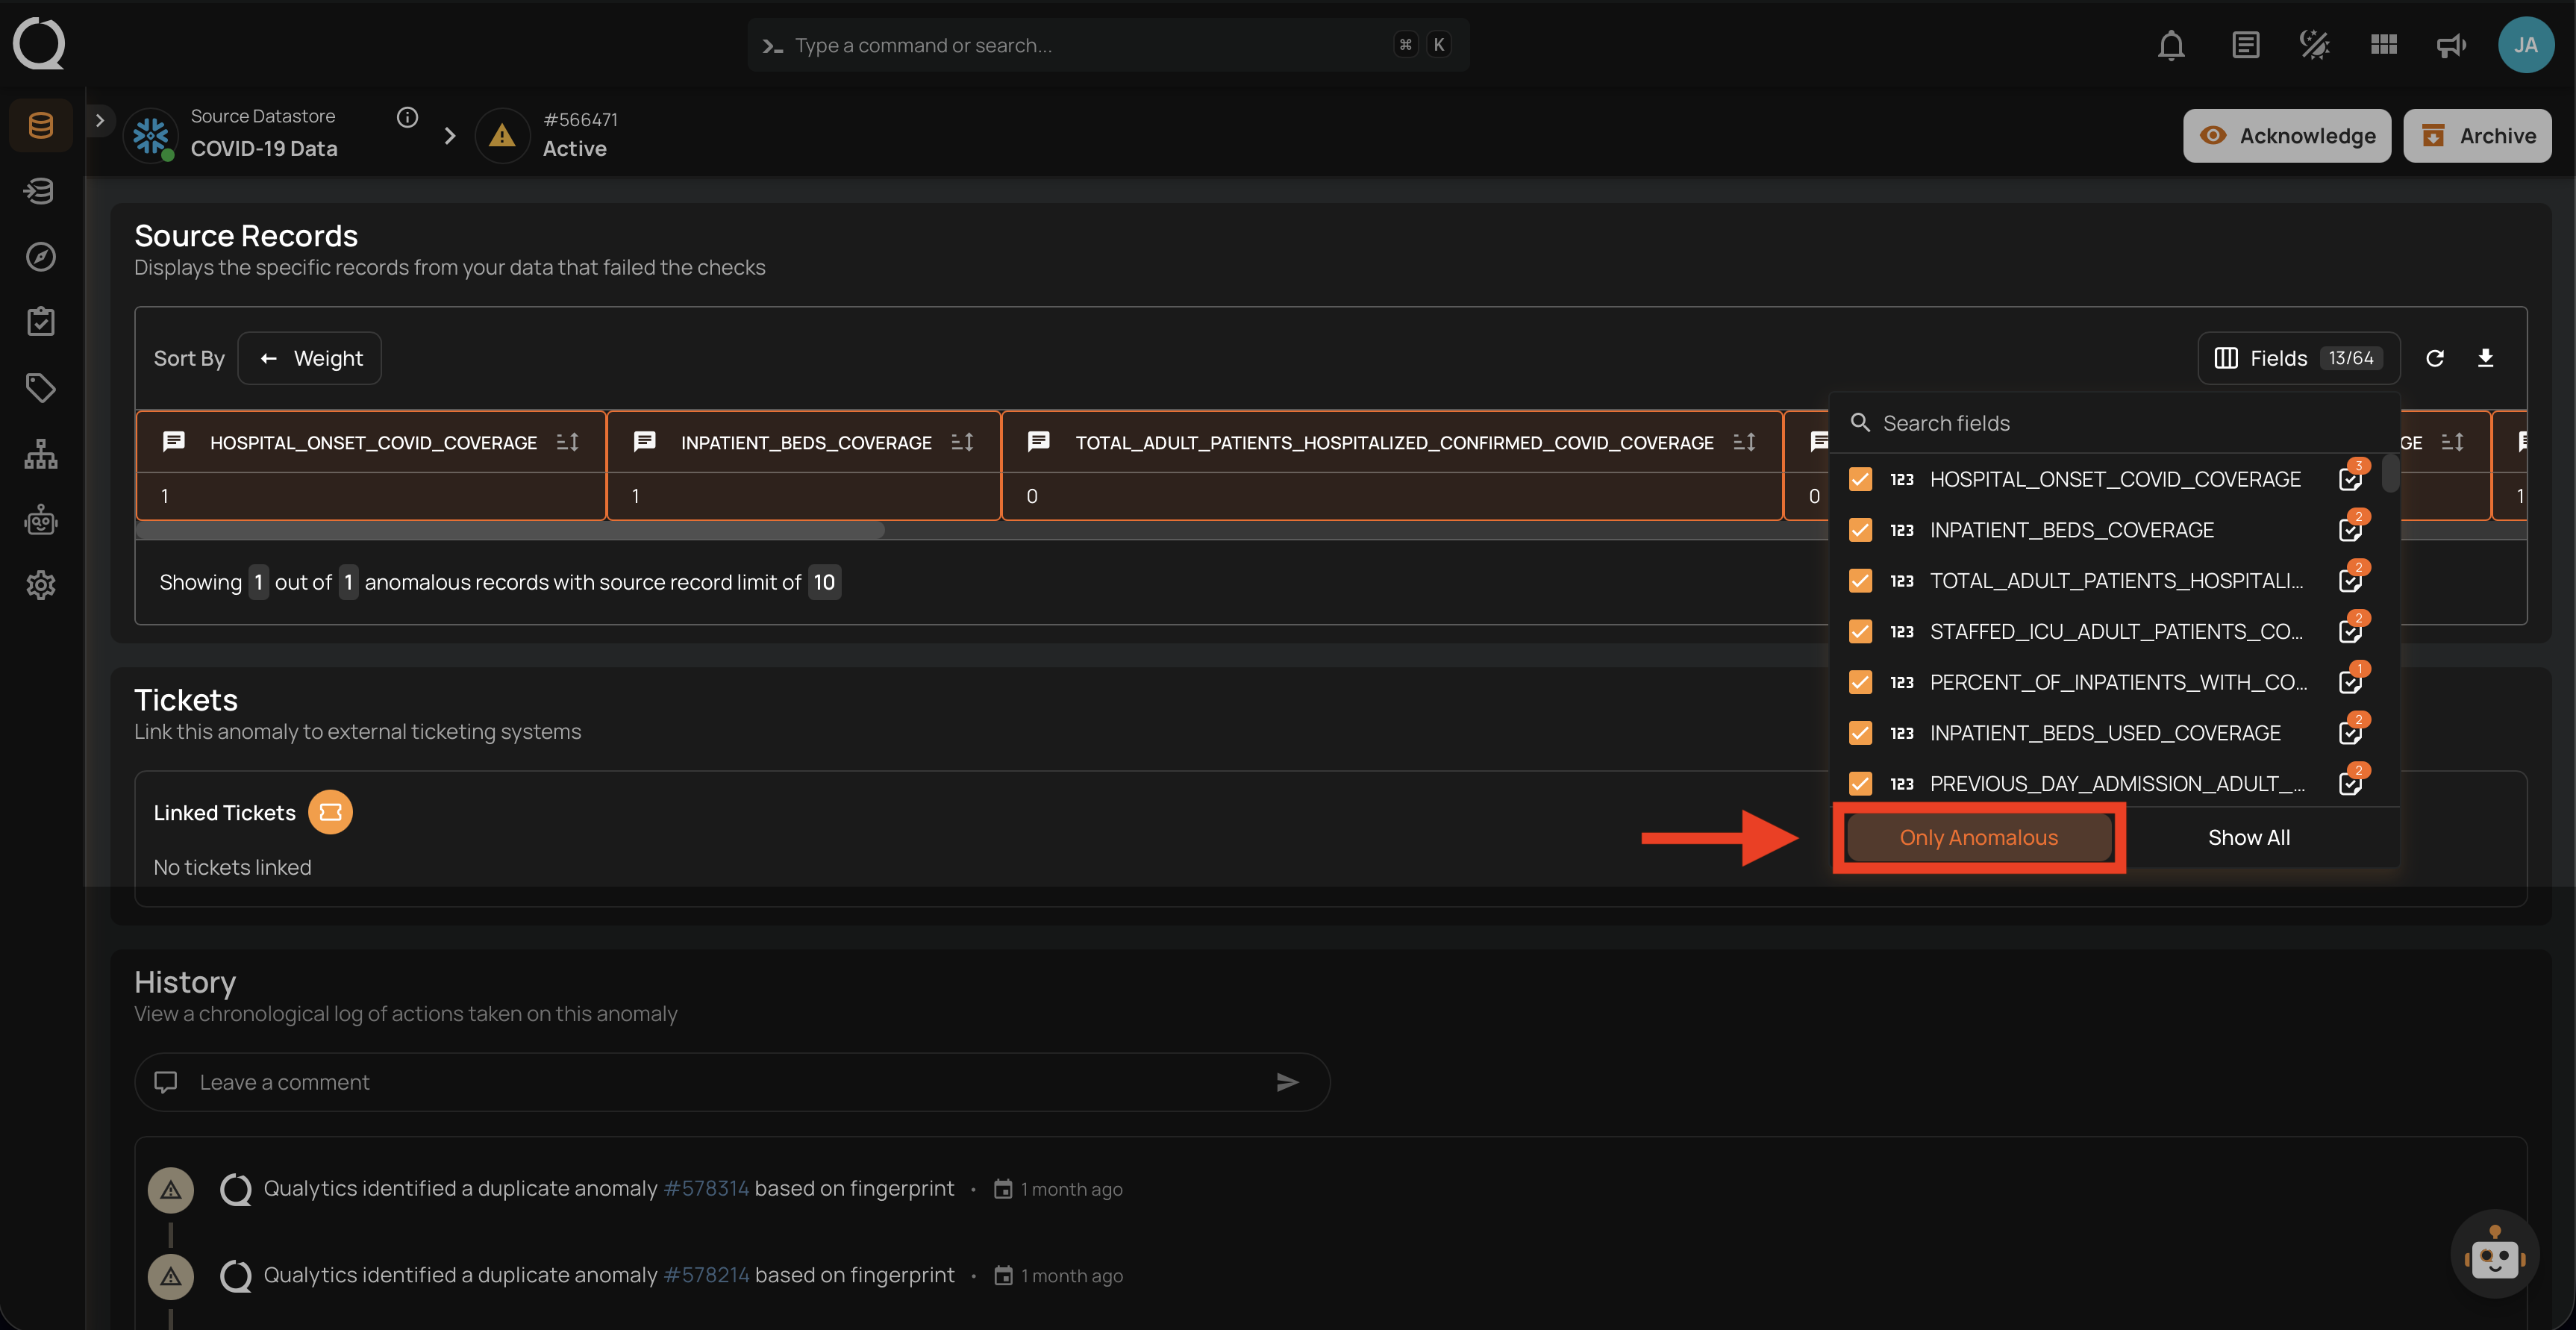
-
Only Anomalous: Filters the visible fields to display only the ones that triggered failed checks. Useful for focusing on the fields that caused the anomaly.

-
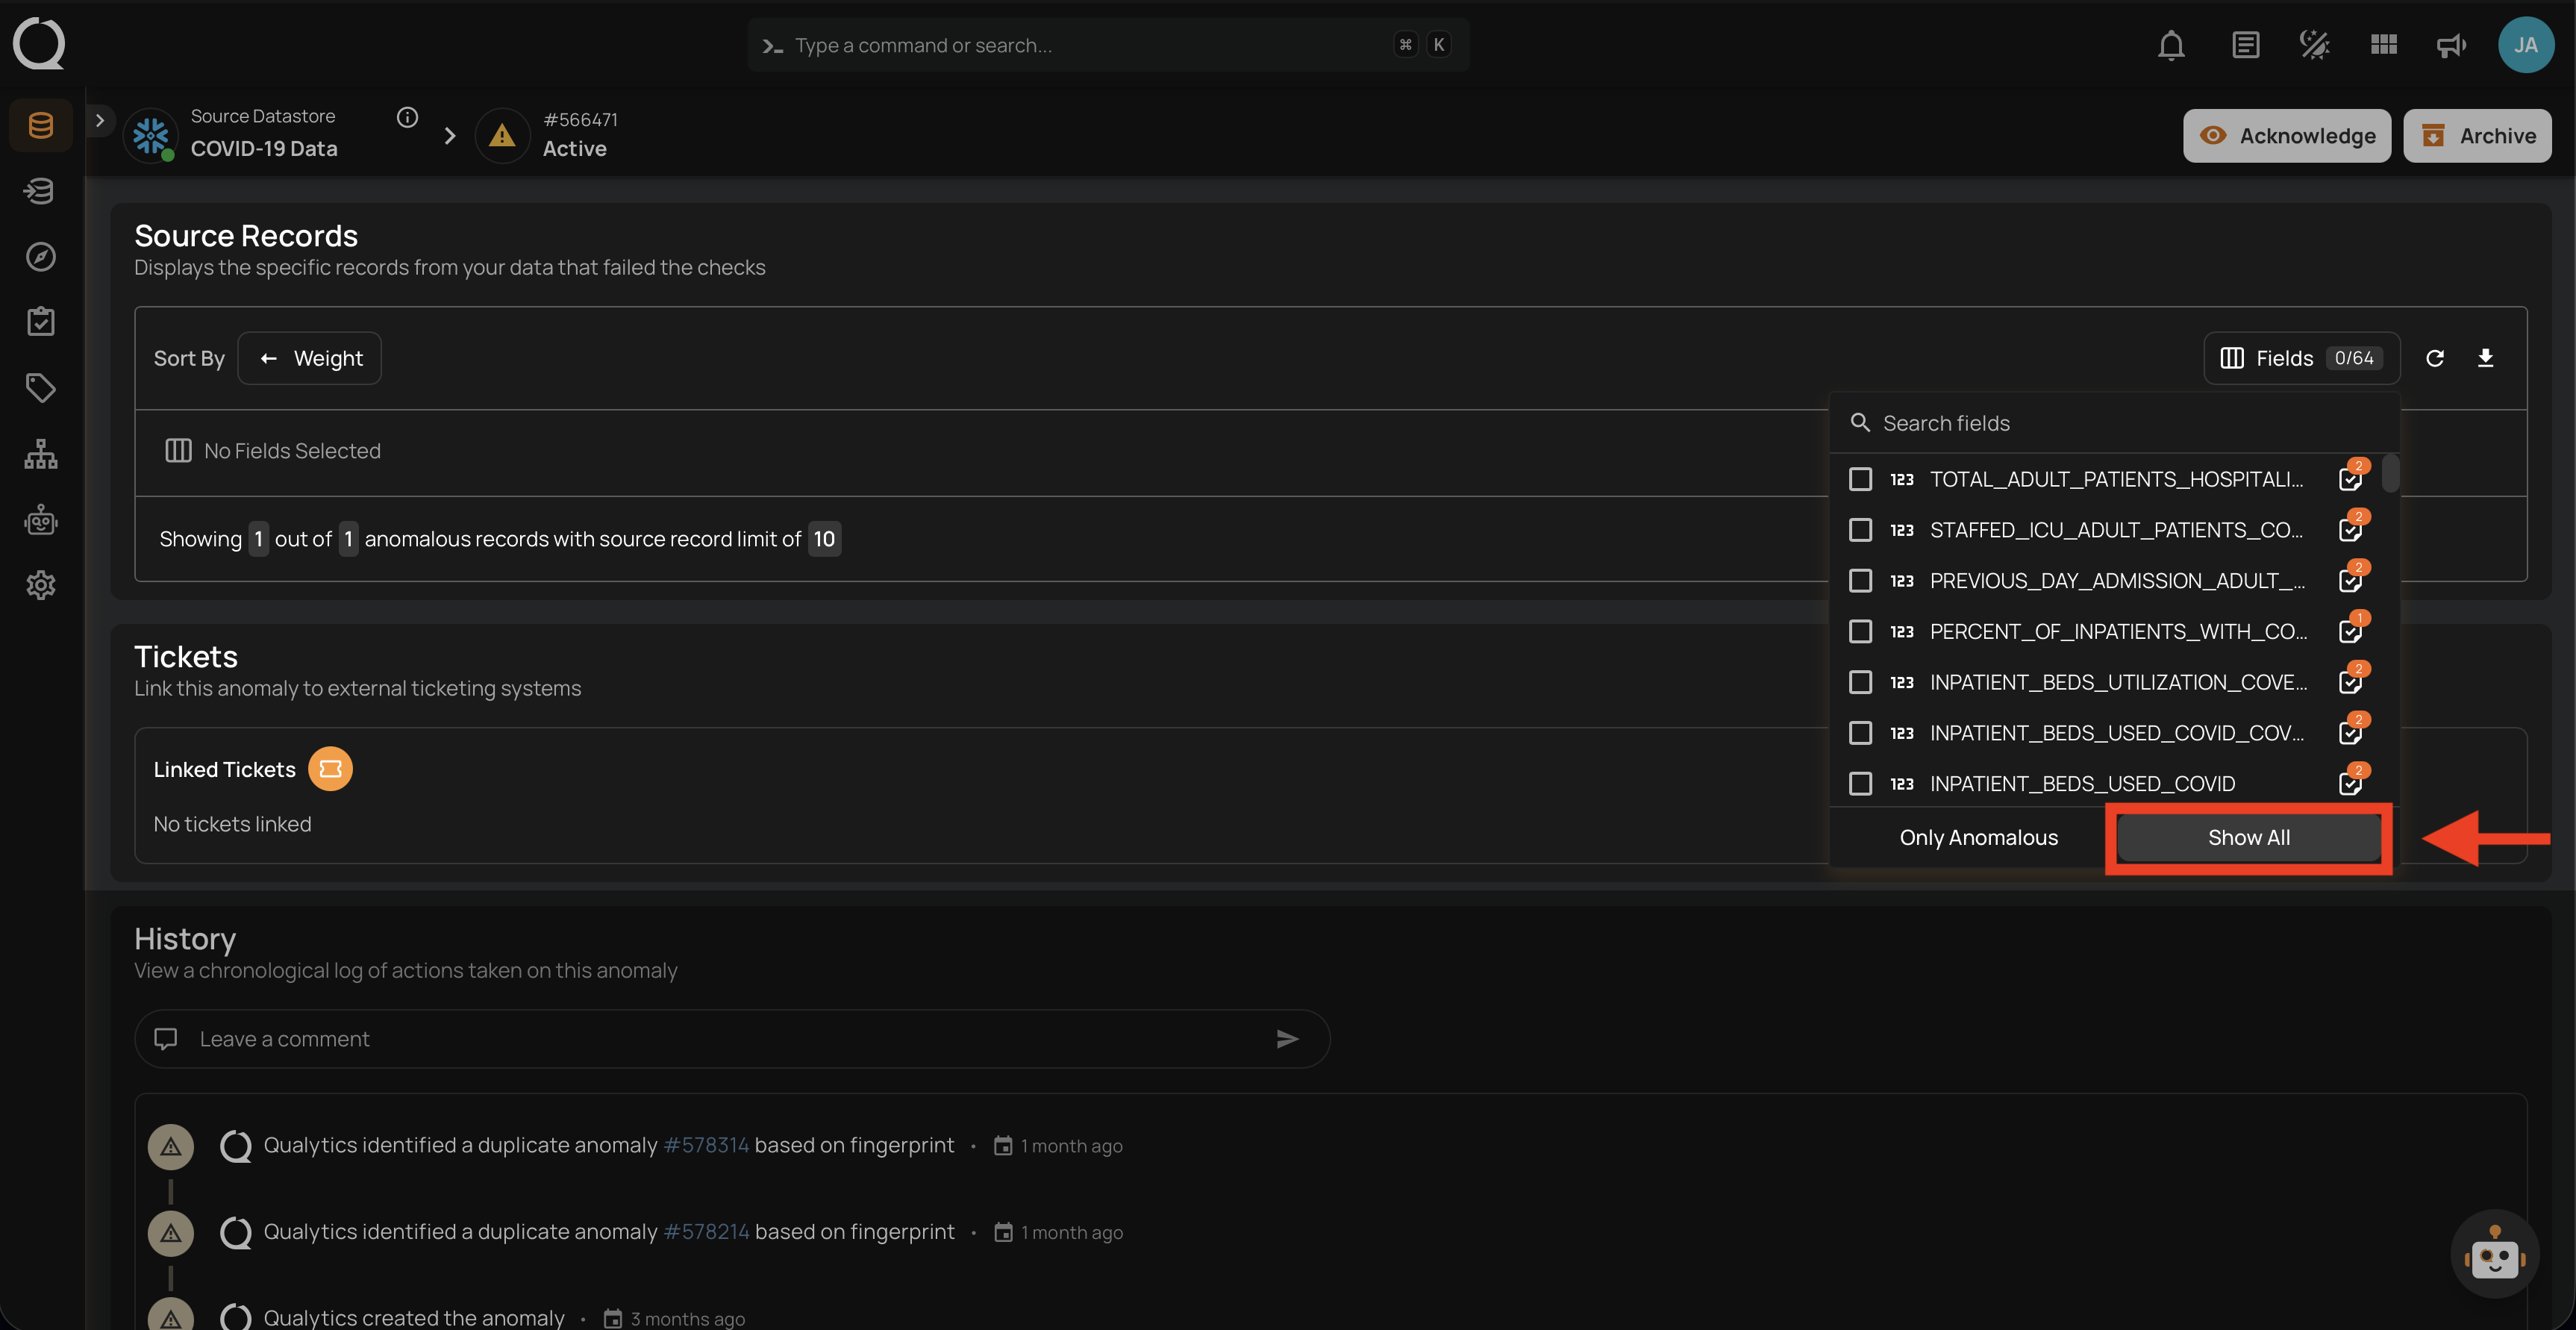
Hide All / Show All: Deselects or selects all fields at once. When all fields are hidden, the option changes to Show All to re-enable them.
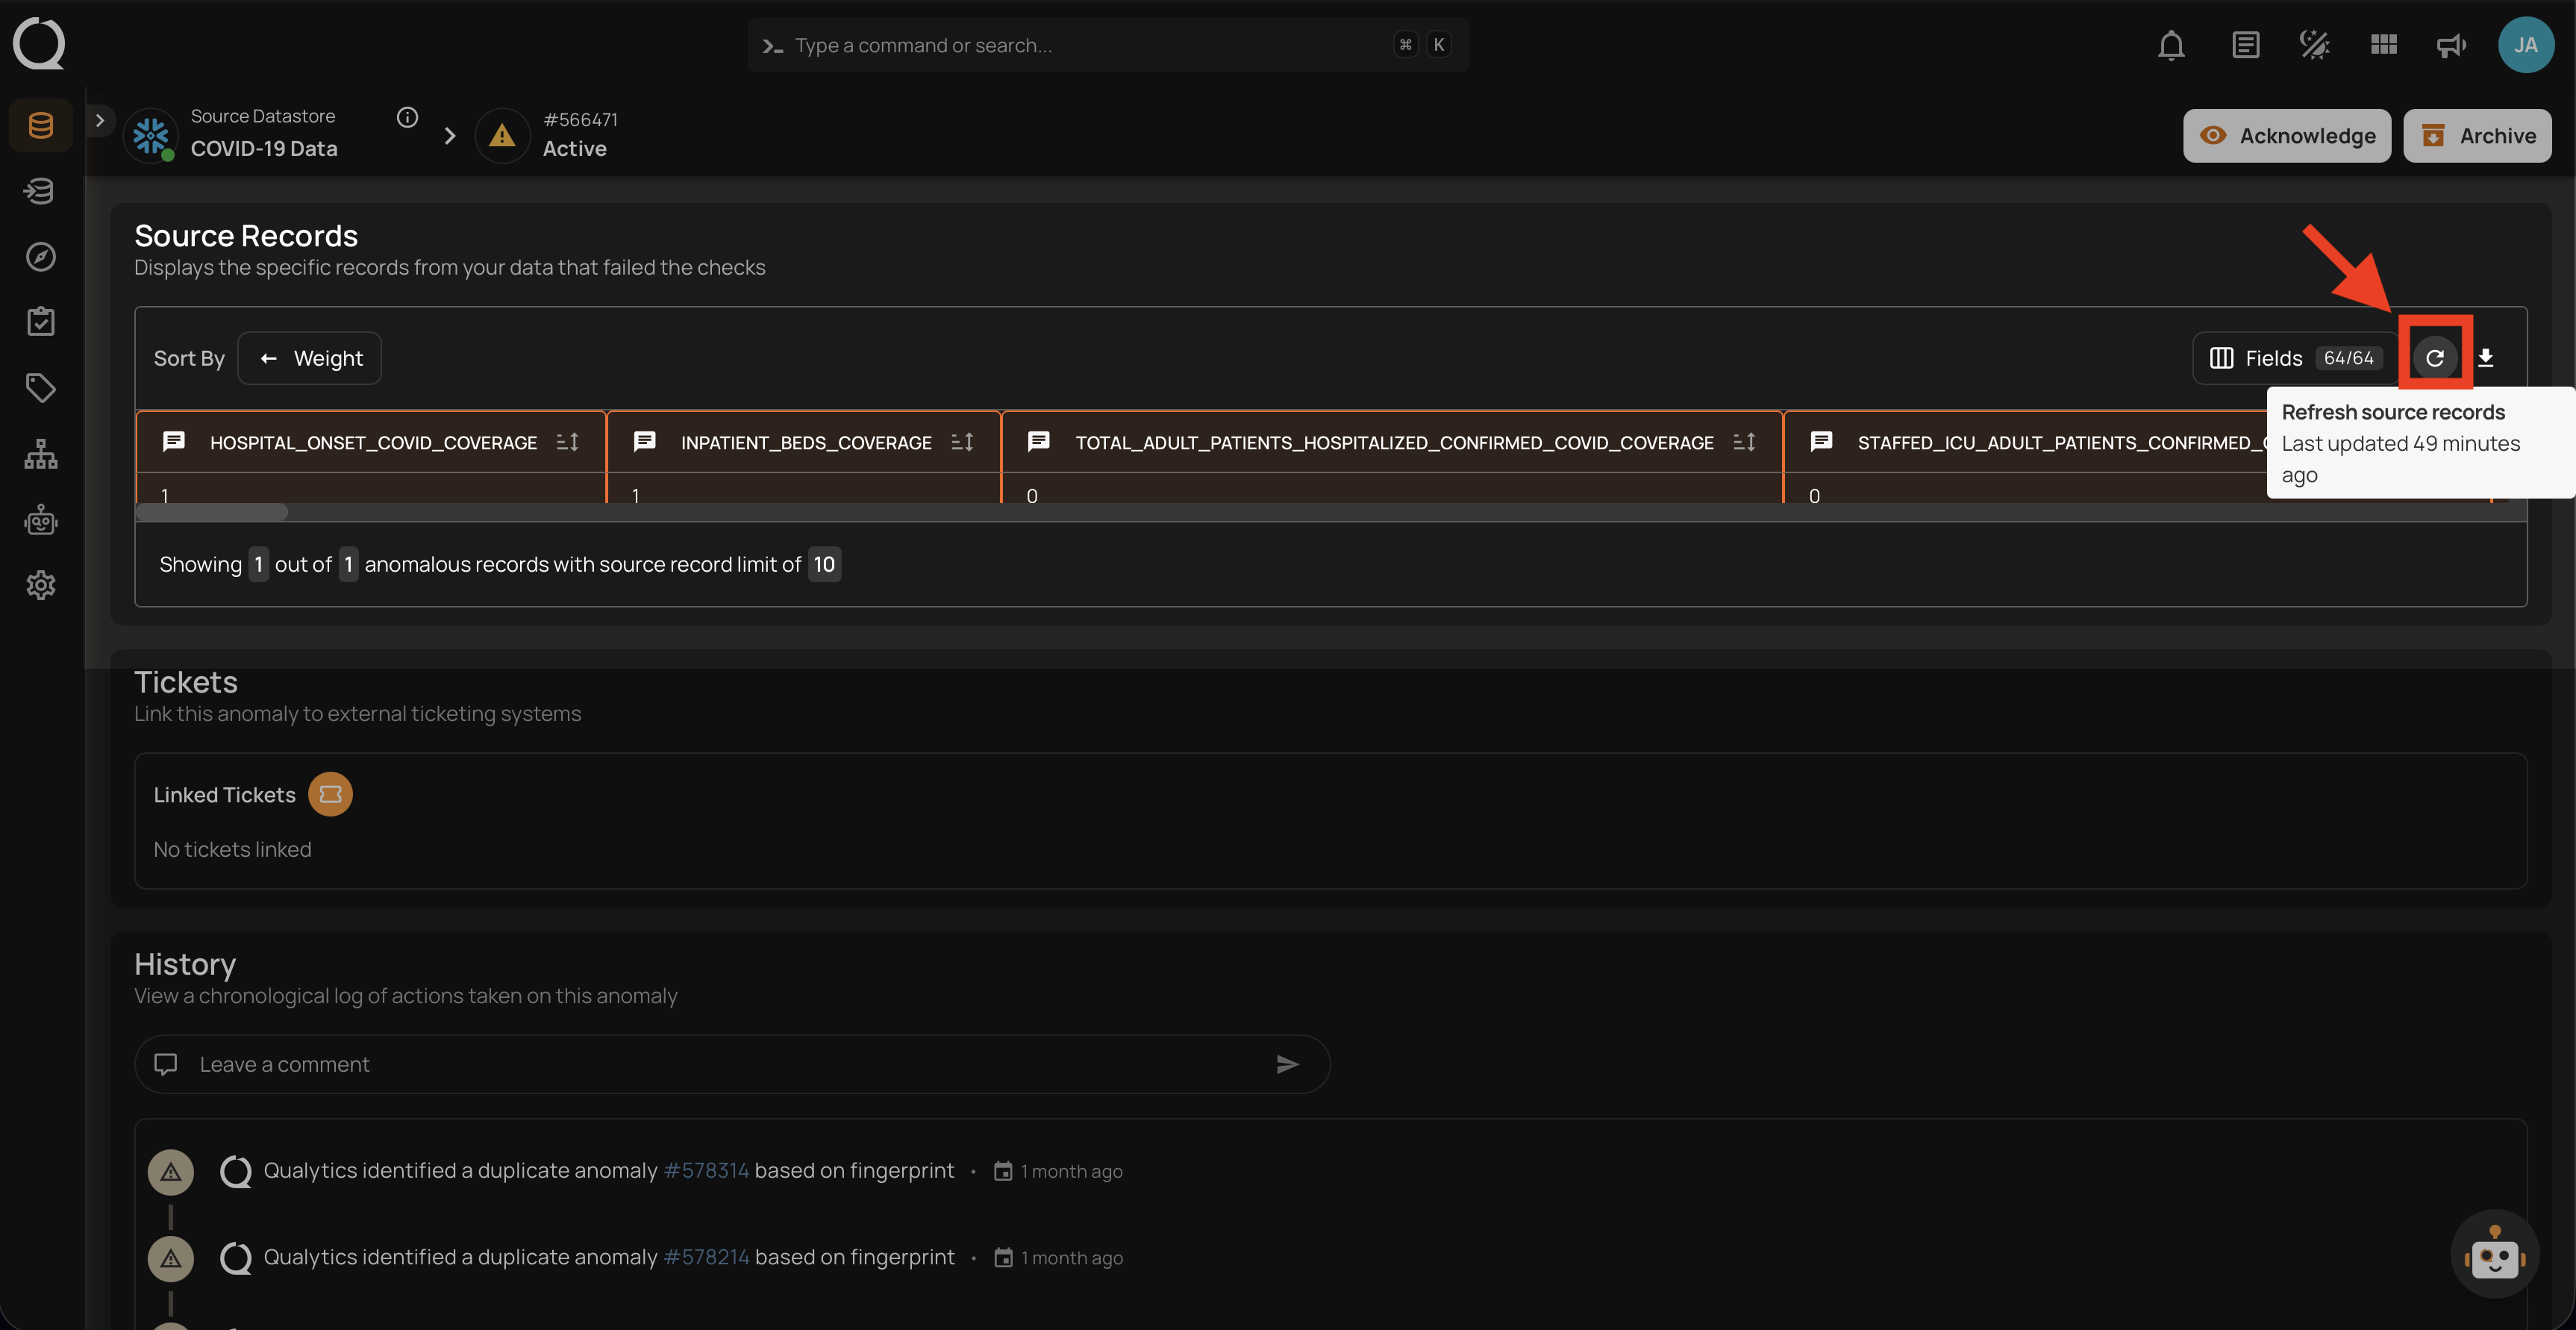
Force Refresh Source Records
Source records are cached locally for up to 8 hours to improve performance. If you need to view the most recent data, click the Refresh button in the source records toolbar to bypass the cache and fetch the latest records directly from the API.
A tooltip on the button displays the last updated timestamp, helping you track when the data was last refreshed.
Download Source Records
Click the Download button to export all source records as a .csv file, with a maximum size of 250 MB.
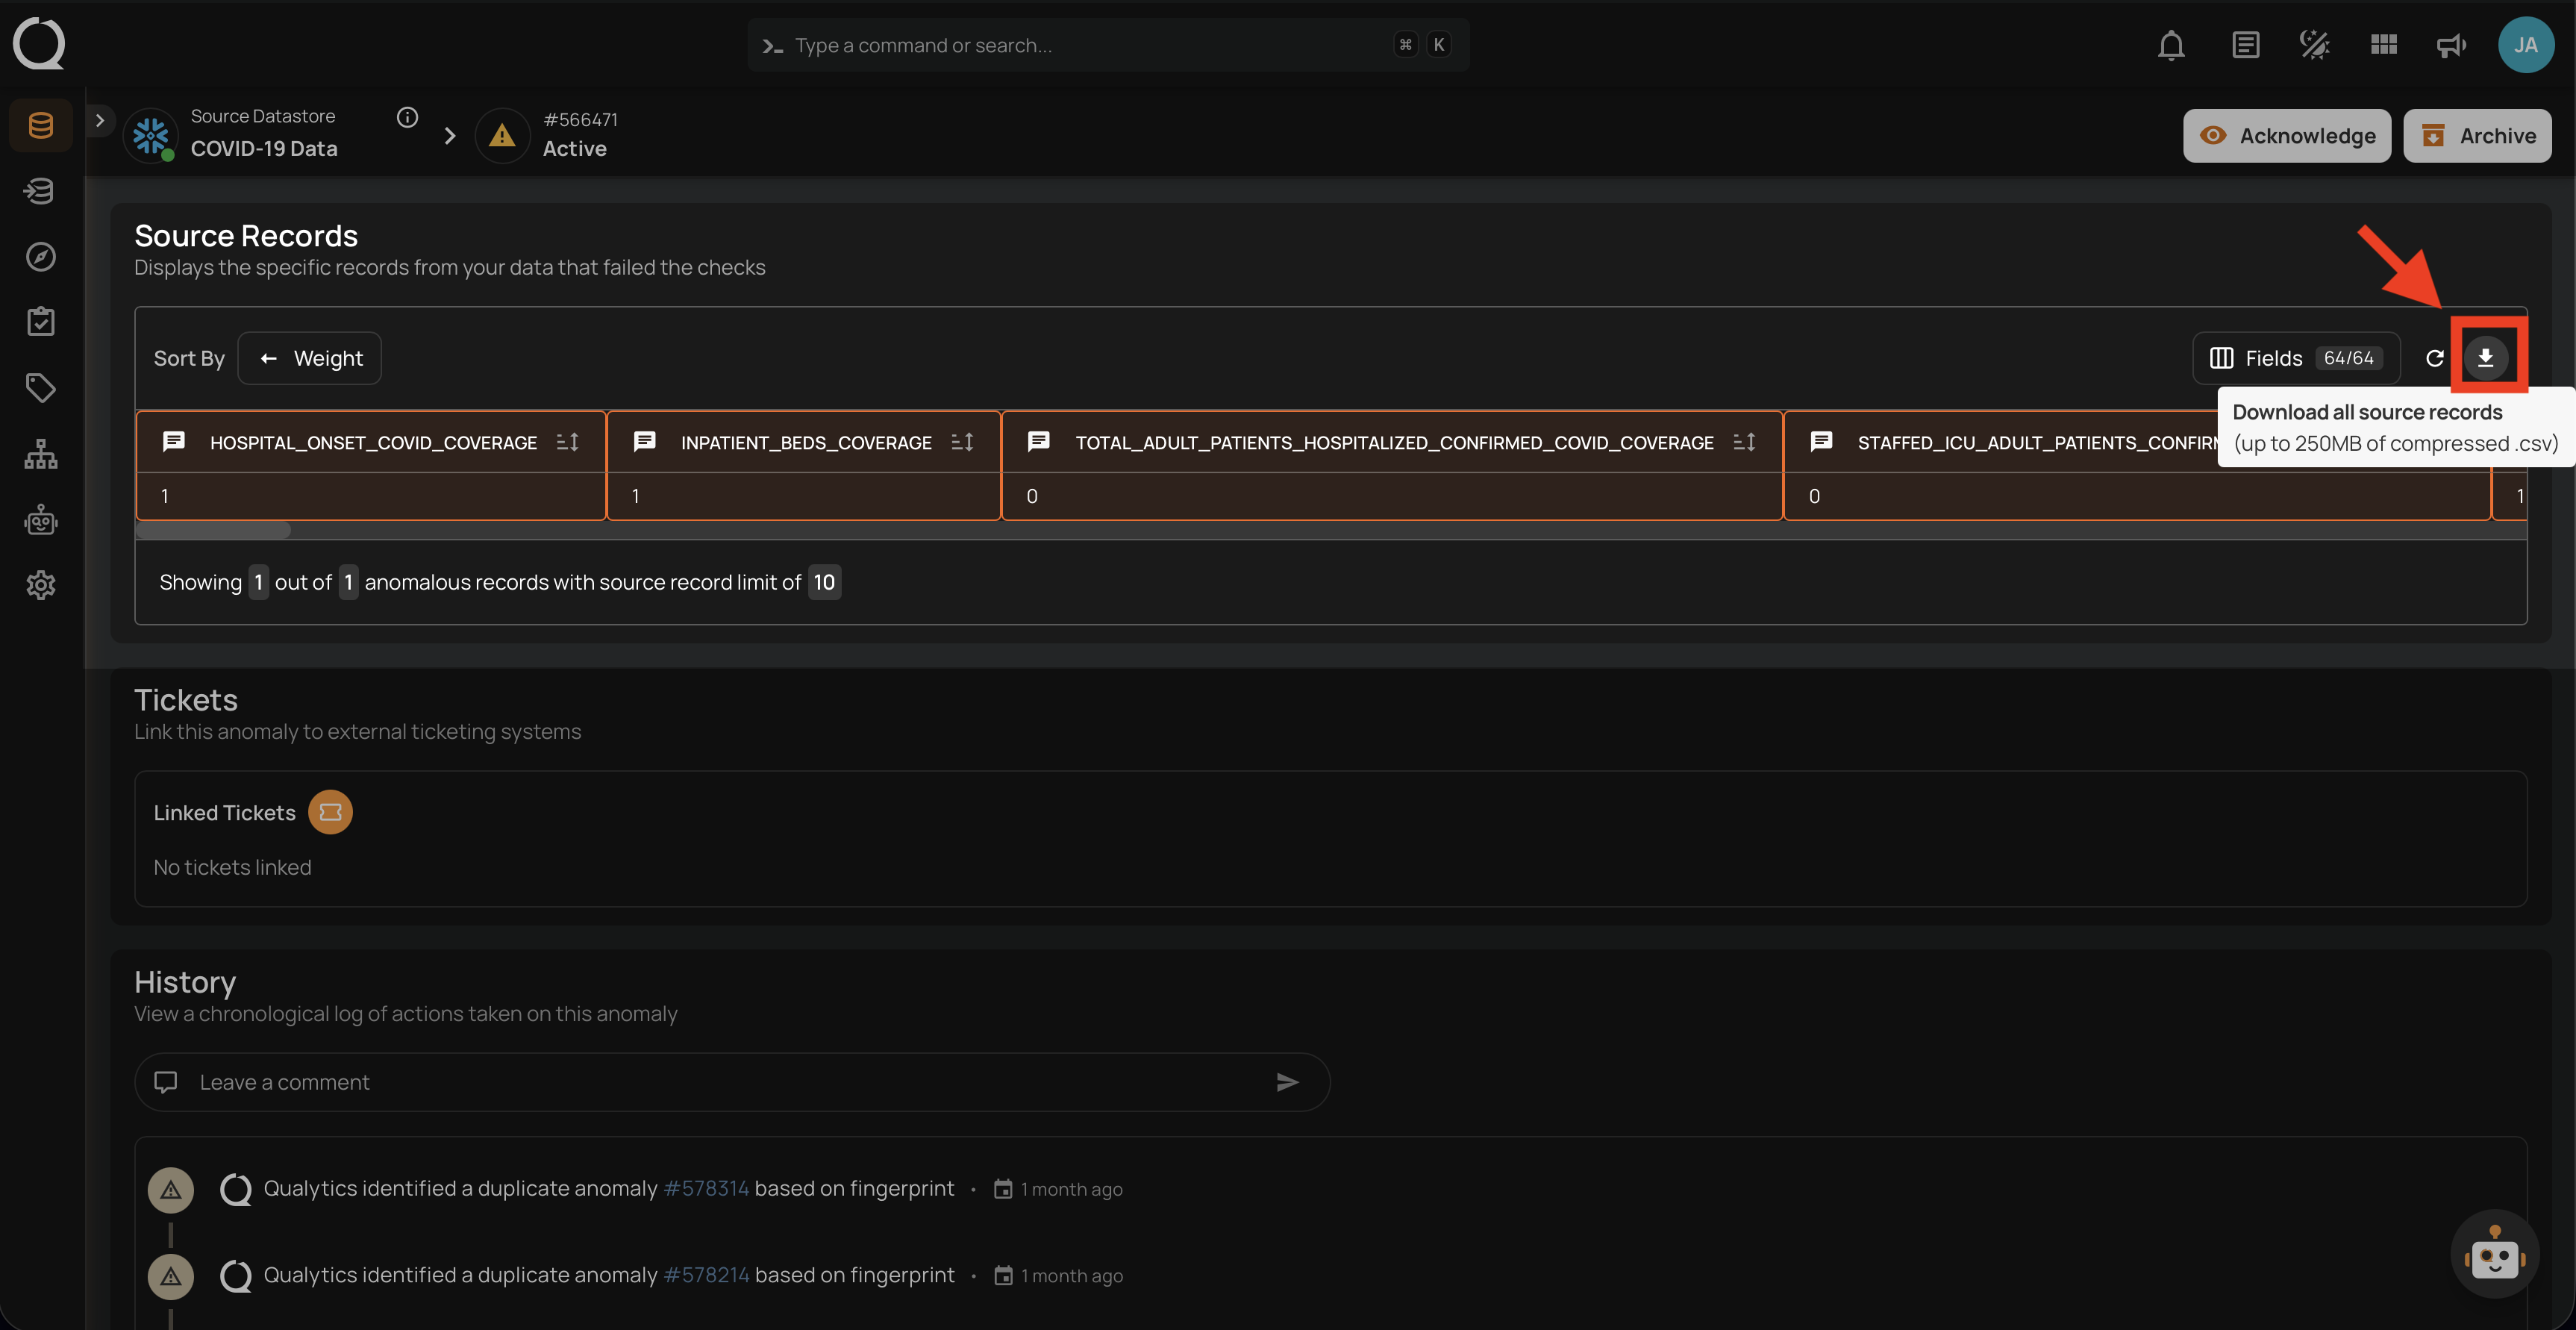
Note
The download includes only the records that were captured during the scan. The number of available records depends on the Maximum Source Examples per Anomaly setting, configured in the scan settings. If you need more records, increase the limit and re-run the scan.
Masked Fields in Source Records
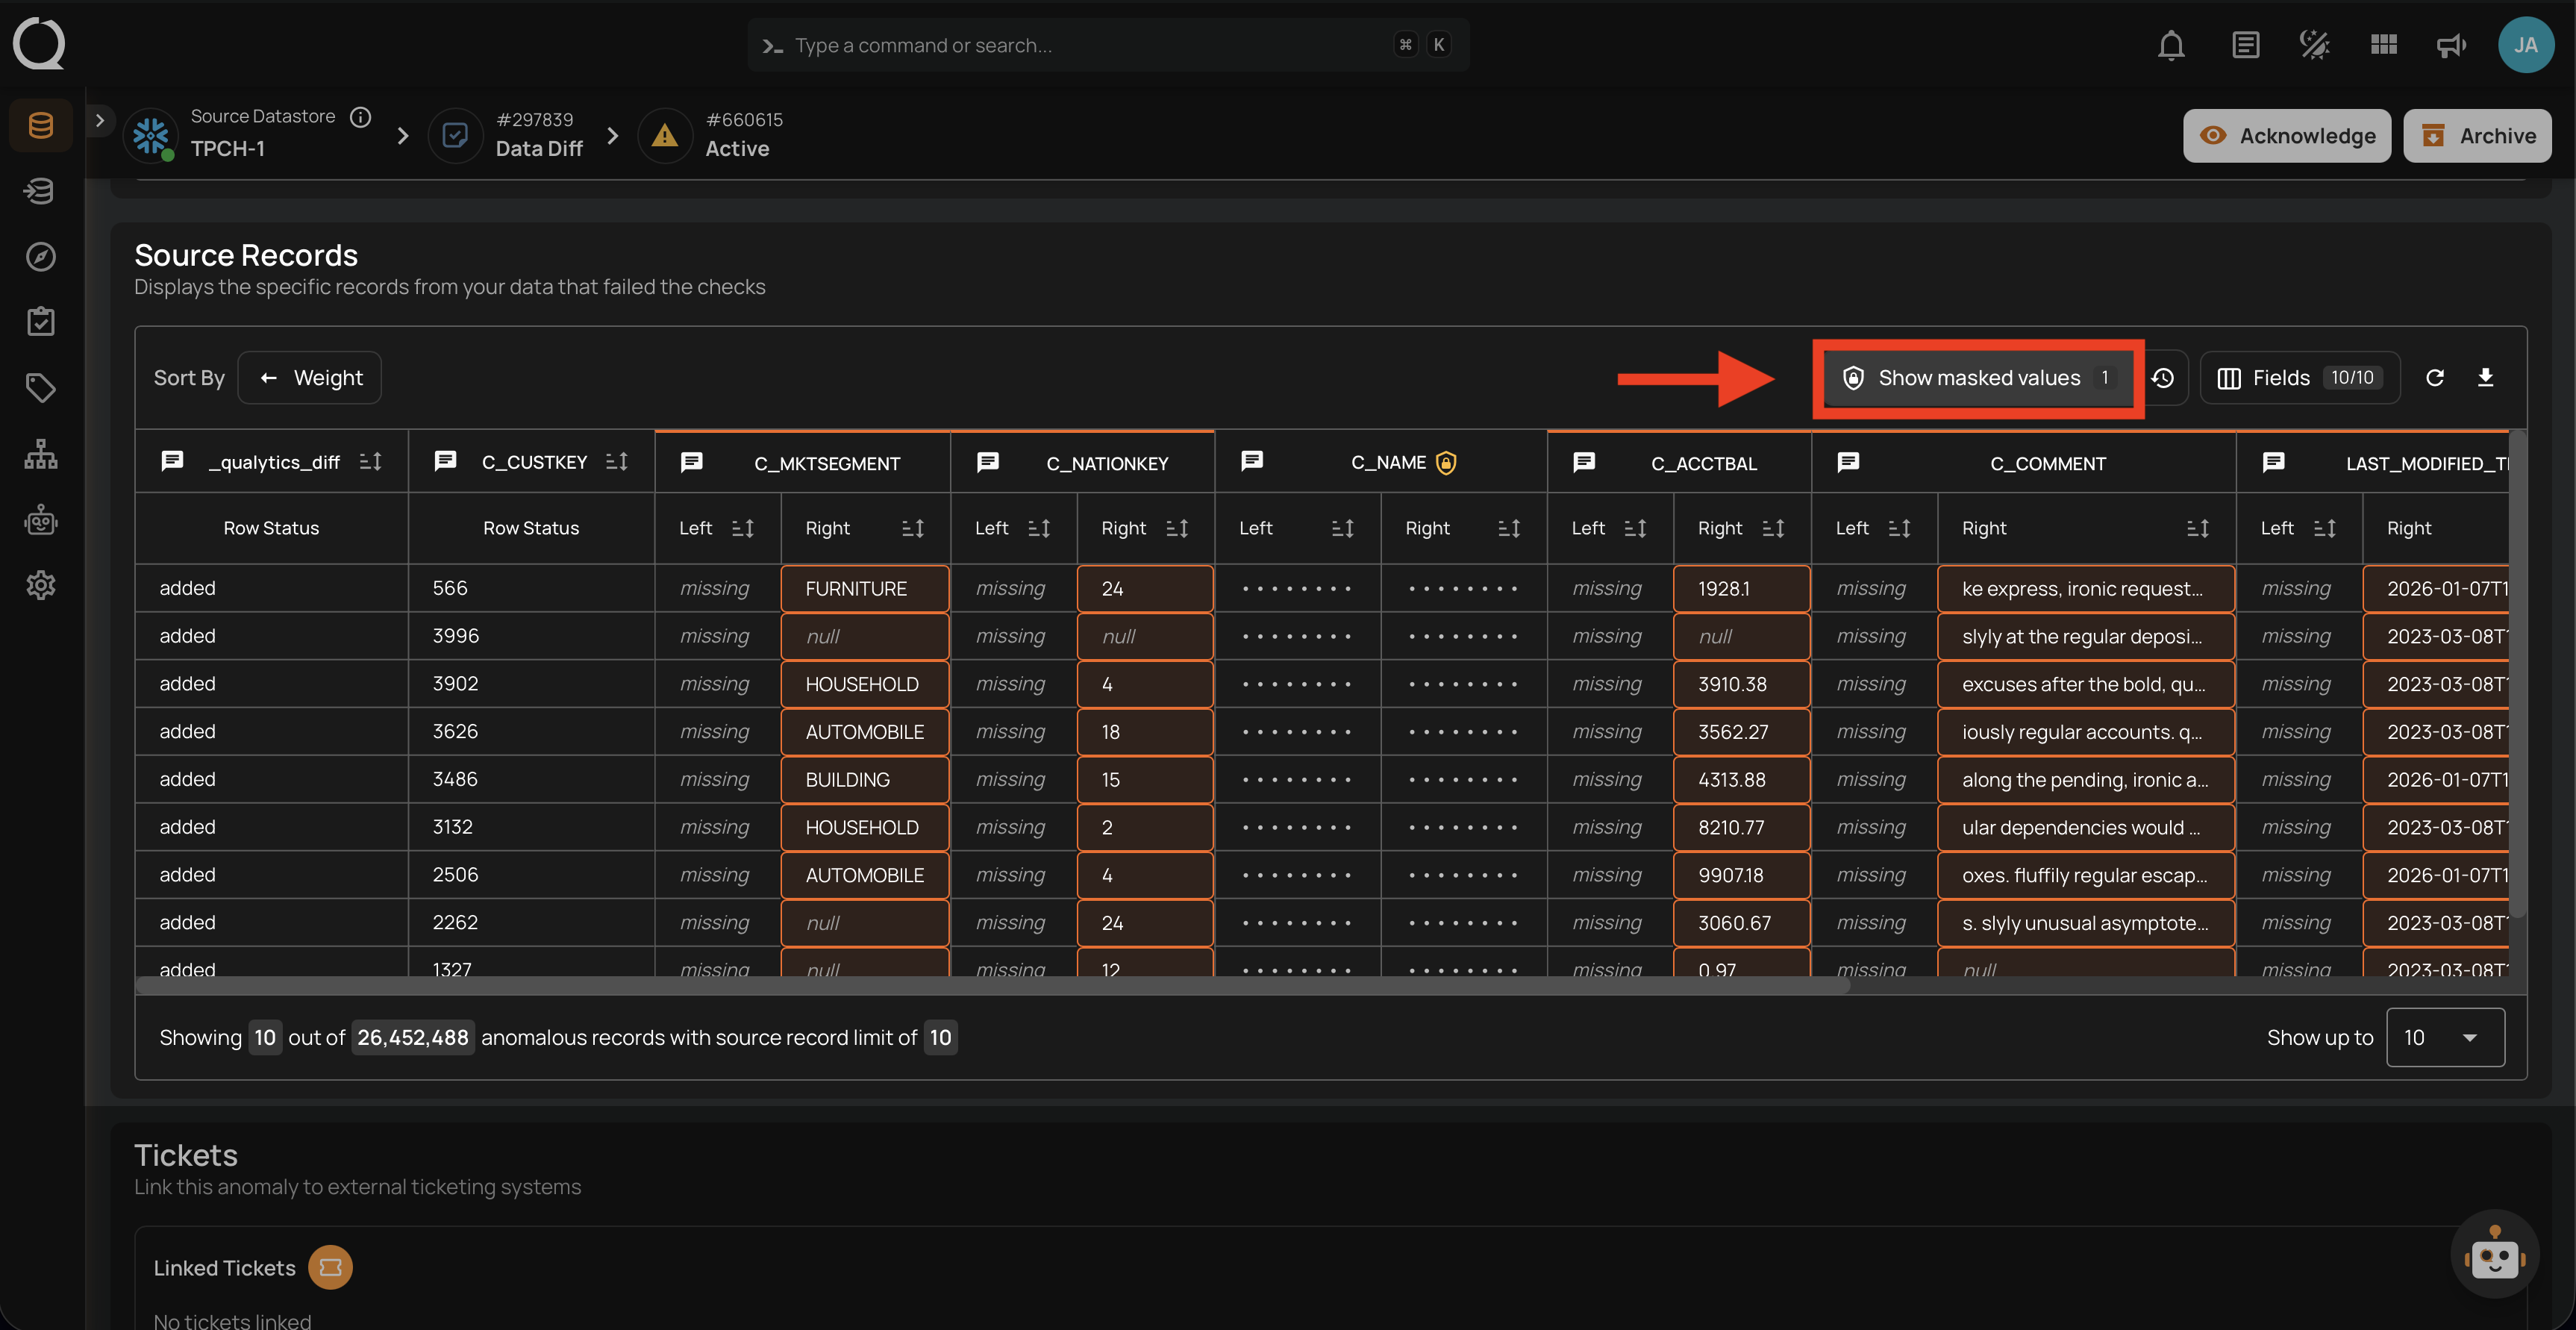
If a container contains masked fields, their values display as ***MASKED*** by default in the source records table.
Users with the Editor team permission can reveal masked values for an anomaly using the reveal toggle. Toggling reveal shows all source records attached to that anomaly at once. The reveal is per-anomaly, not per-record.
Revealing Masked Values
Step 1: Click the Show masked values toggle in the source records toolbar to initiate the reveal process.
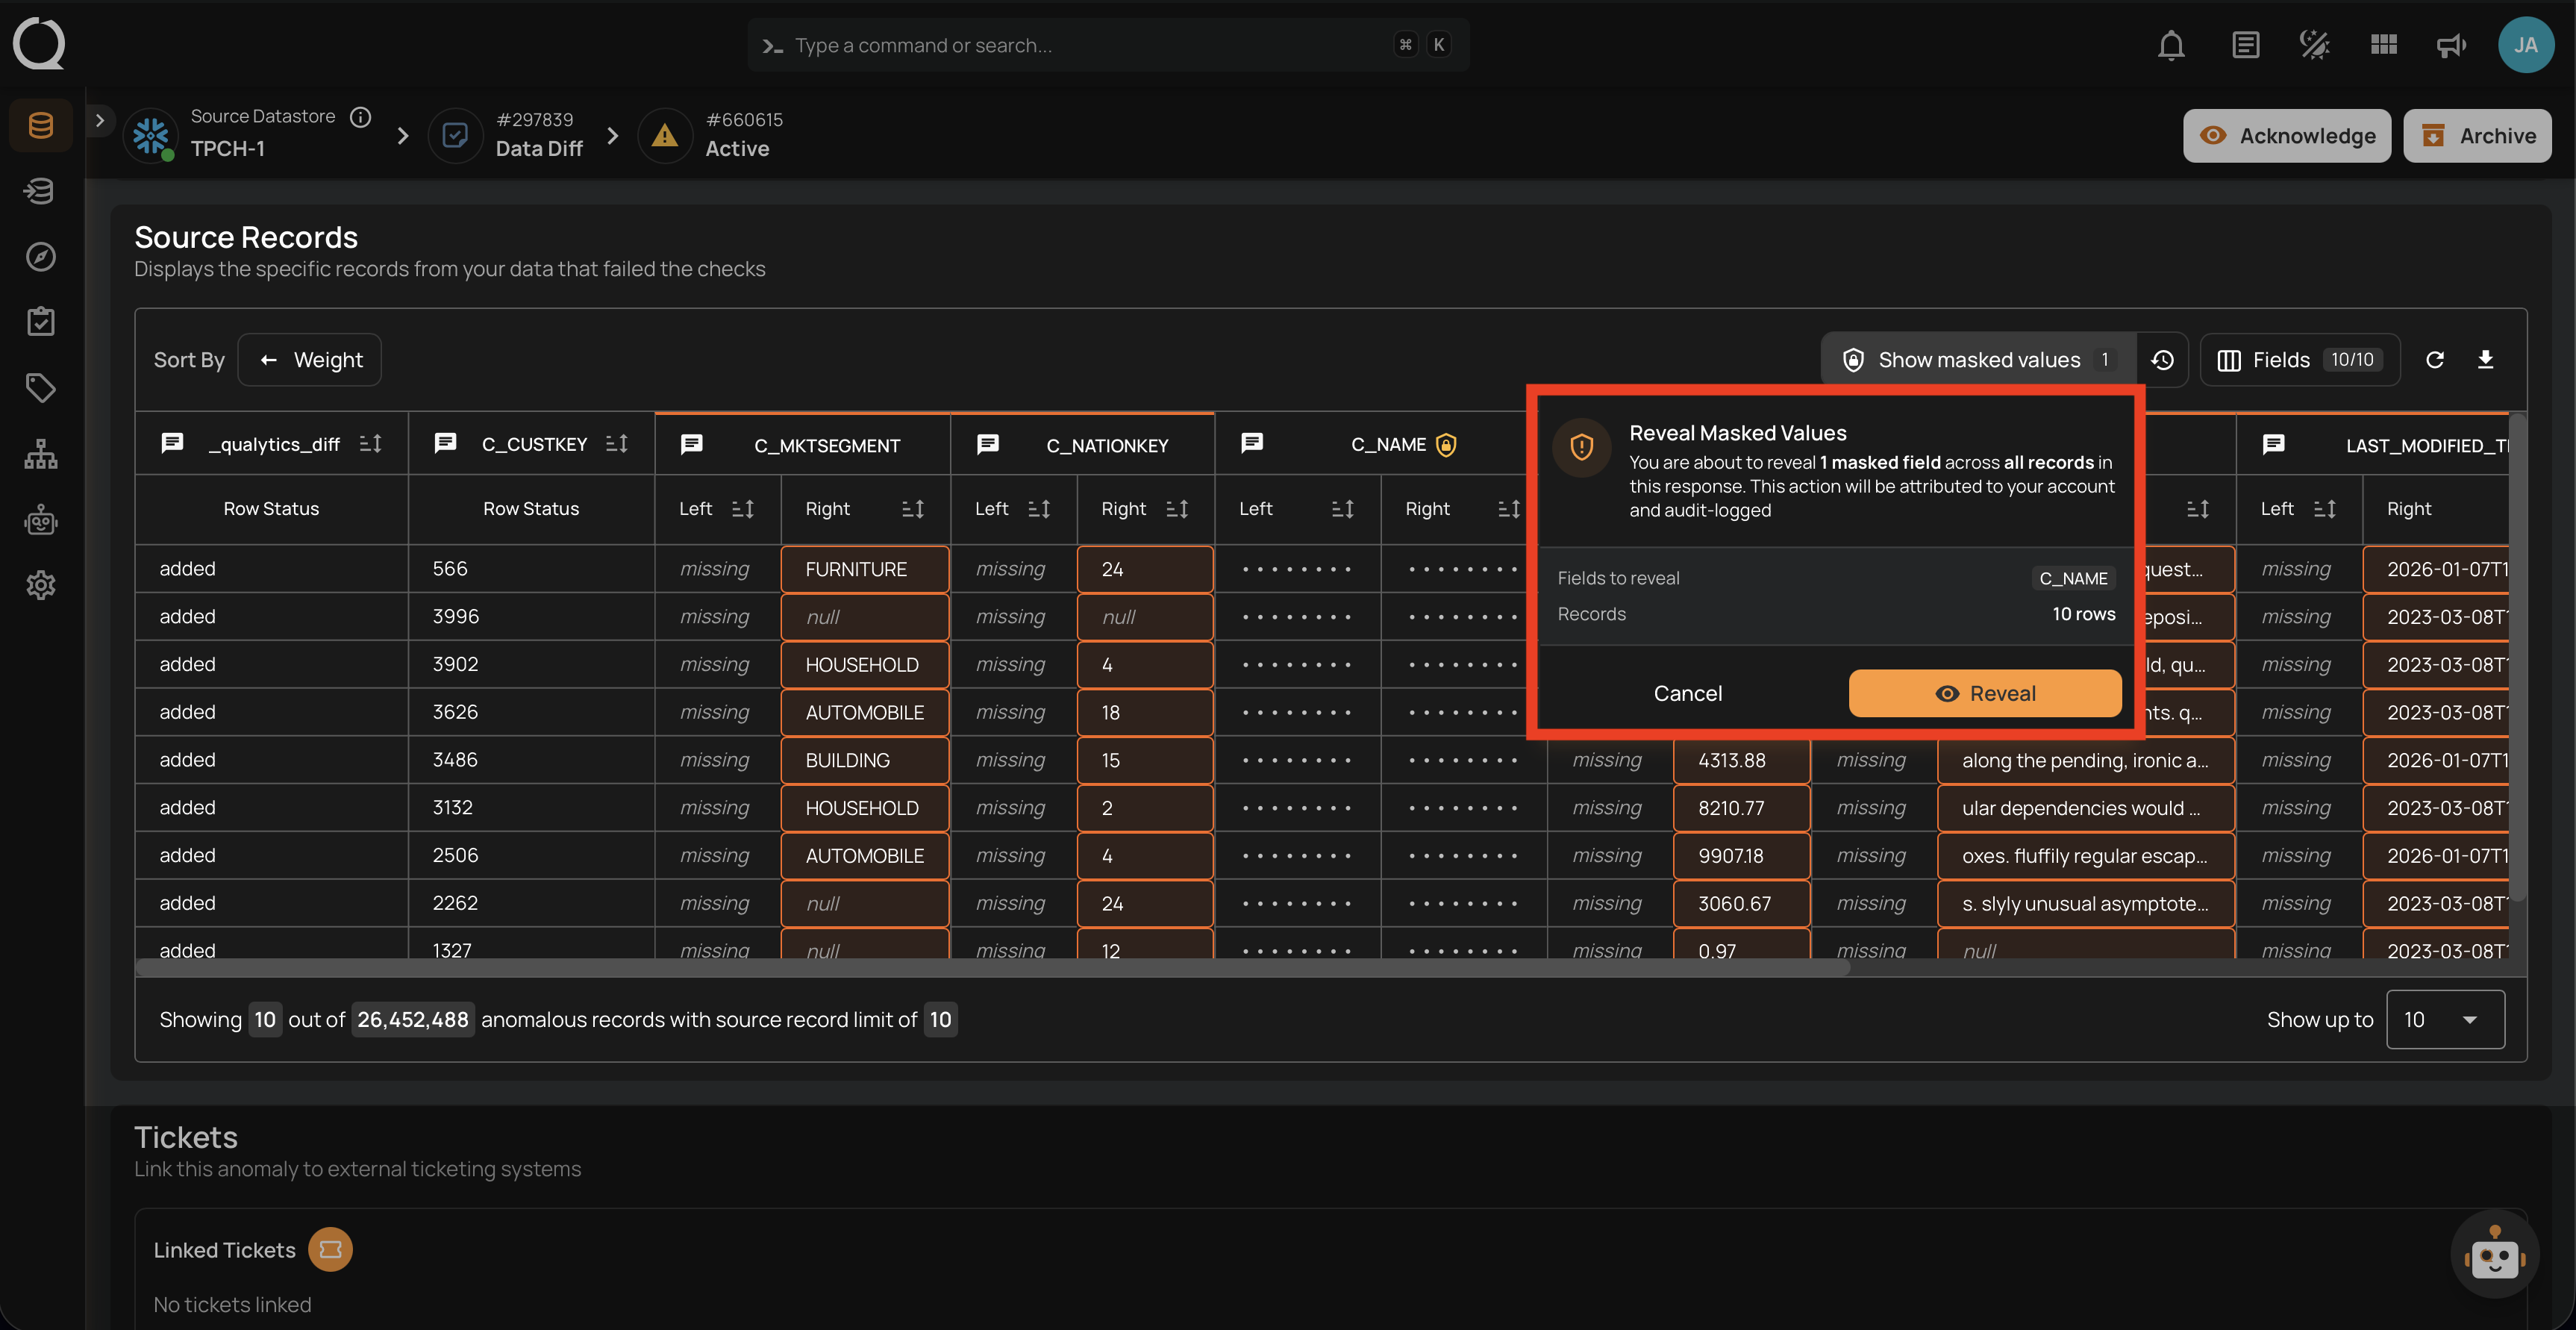
Step 2: A confirmation dialog will appear indicating the number of masked fields to be revealed and the number of records affected. Click Reveal to proceed, or Cancel to discard.
Masking Audit Log
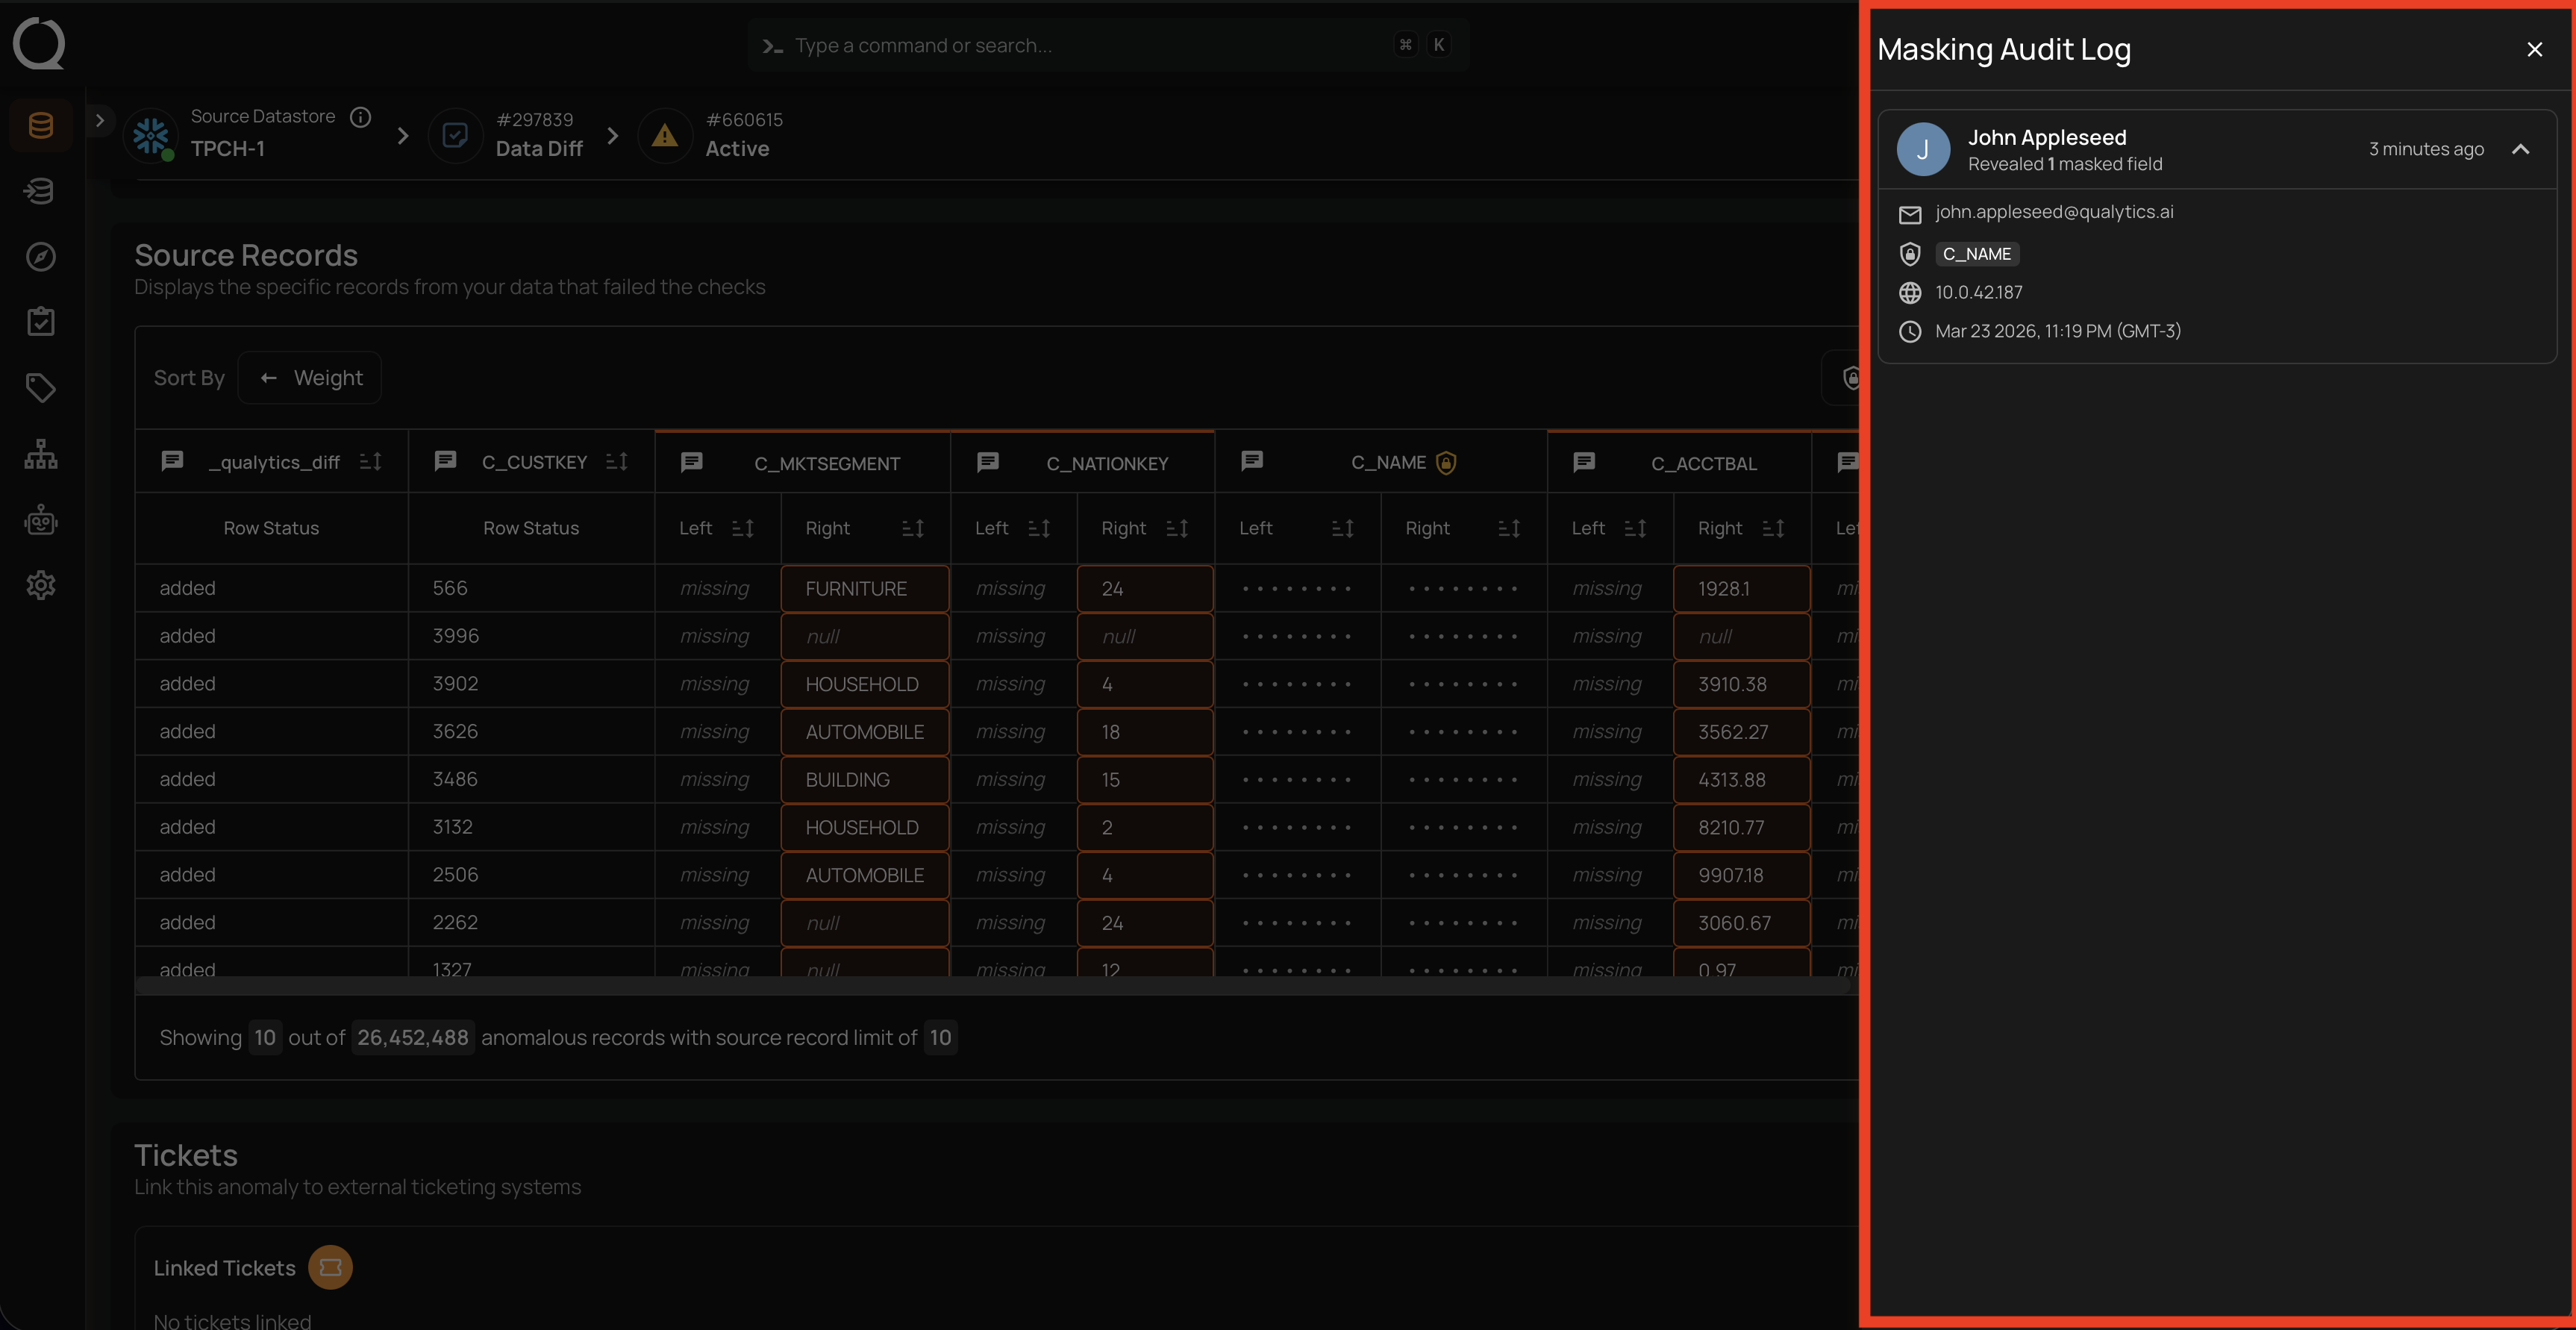
Every reveal action is recorded in the masking audit log with the user identity, timestamp, IP address, and the specific fields accessed. This log is reviewable by users with the Admin role.
Step 1: Click the Show audit log button in the source records toolbar to open the audit log panel.
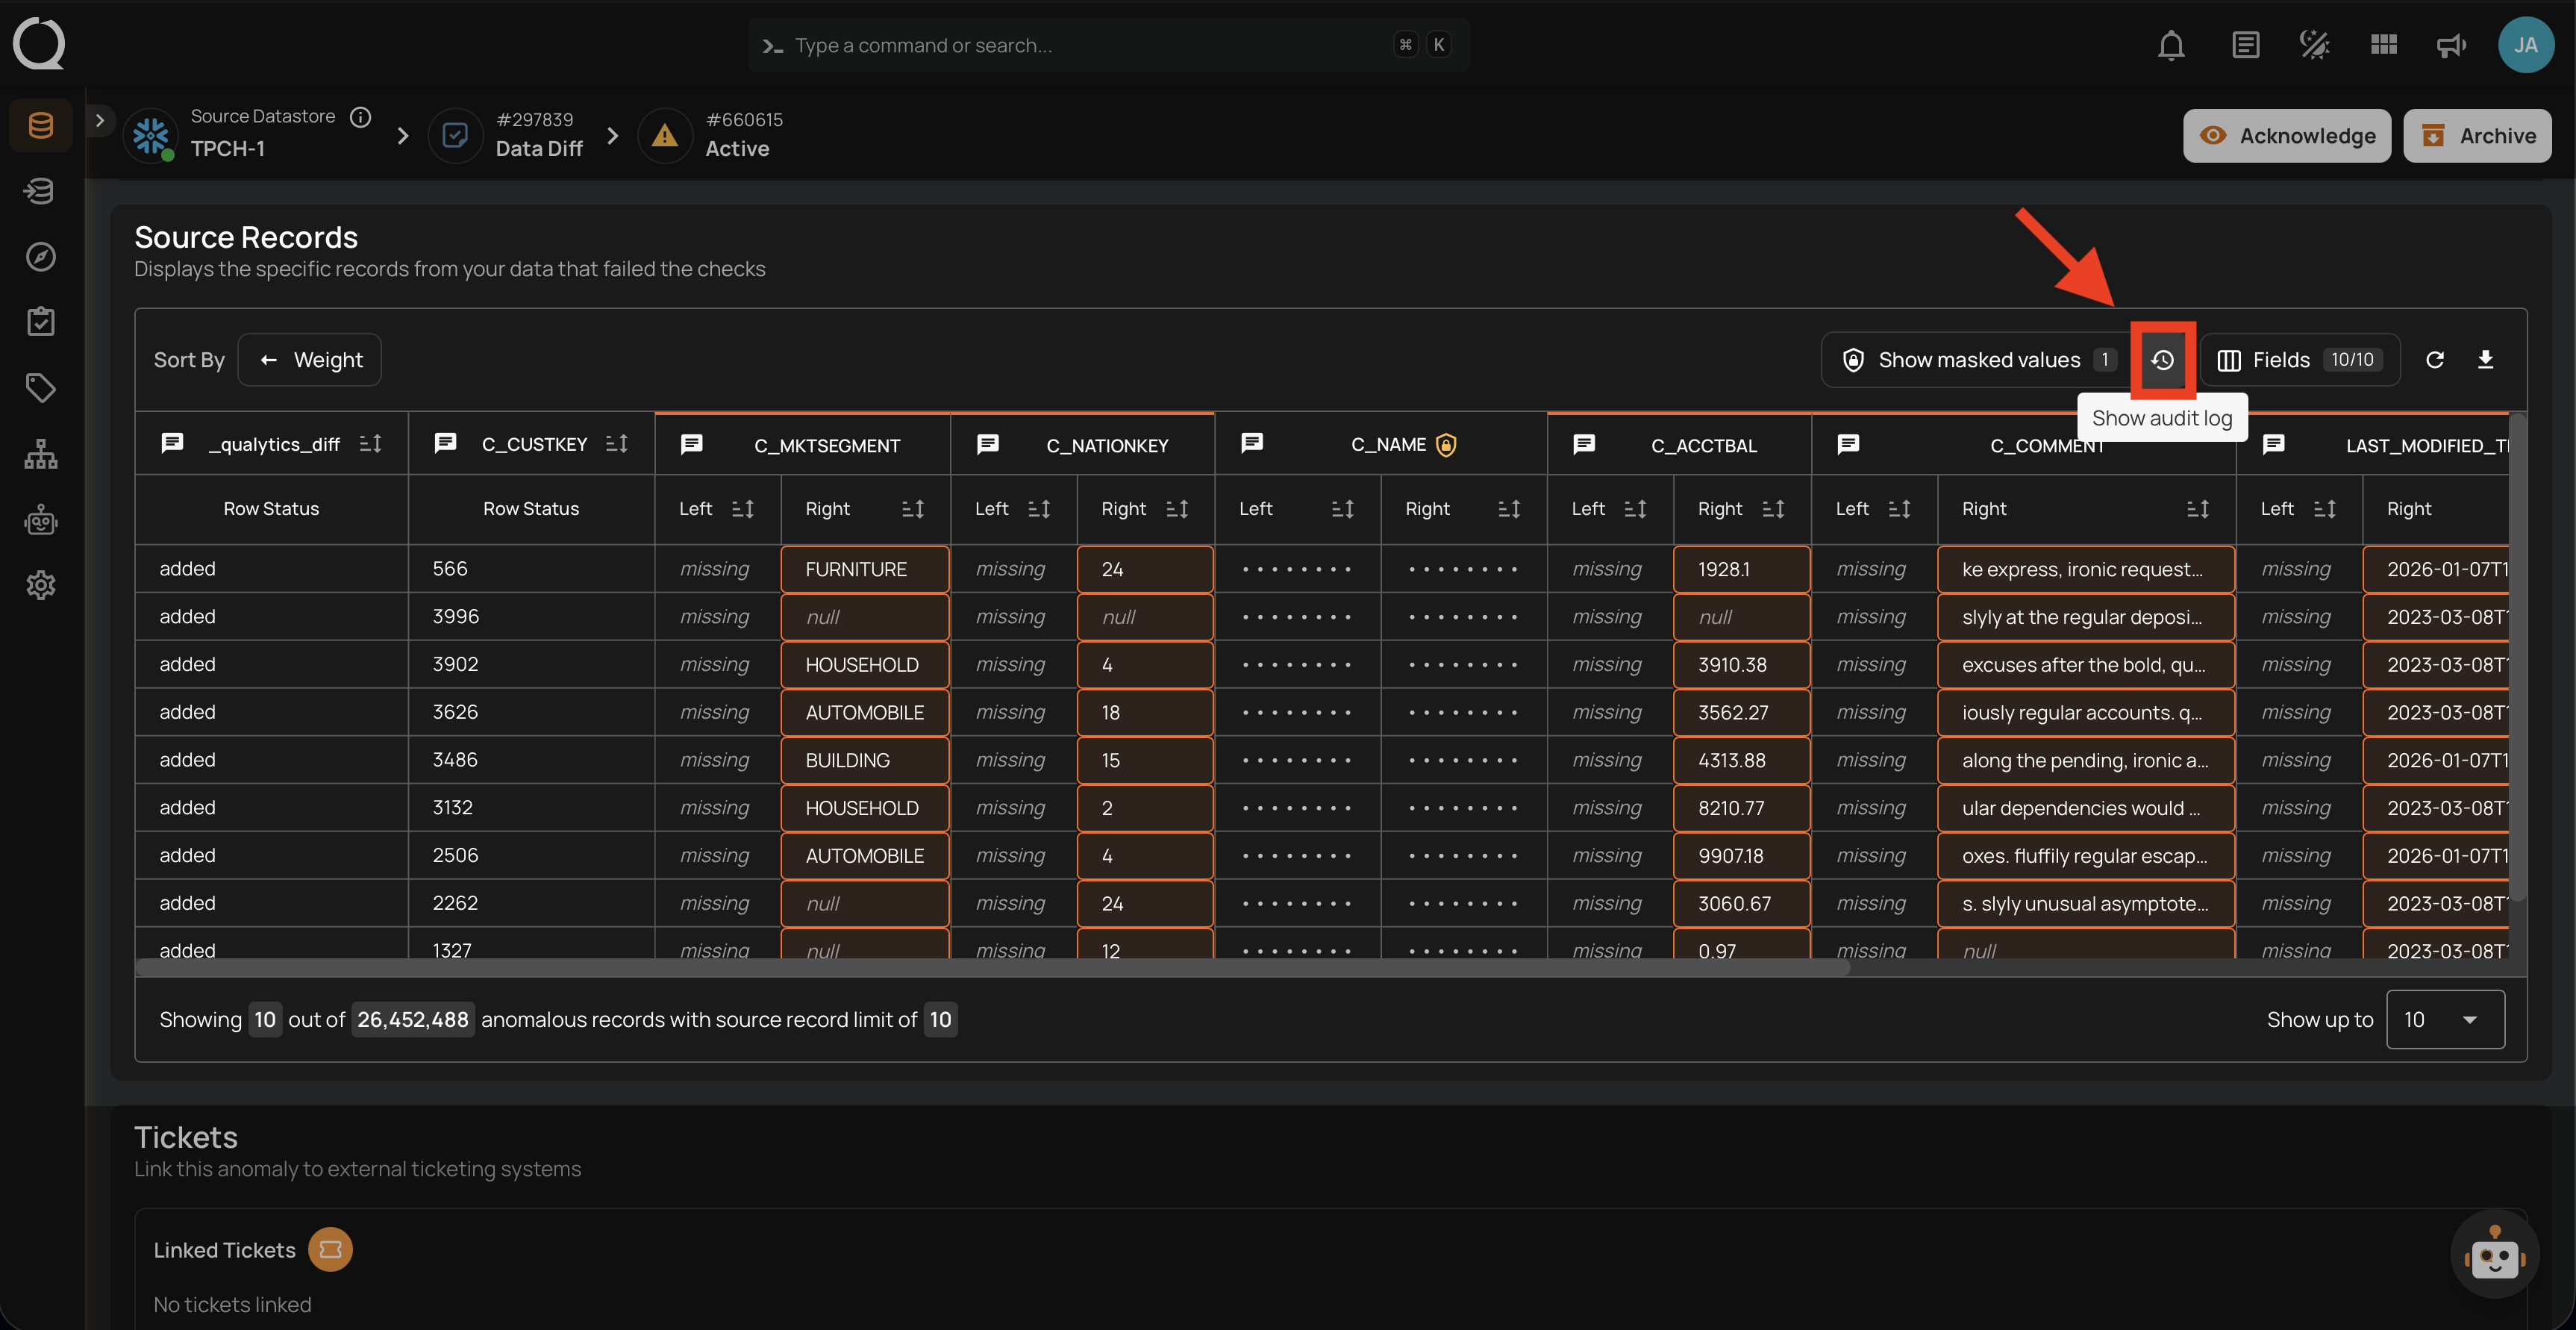
Step 2: A right-side panel will open displaying the Masking Audit Log with details including the user name, email, revealed fields, IP address, and timestamp of each reveal action.
Info
To protect sensitive data consistently, masking also applies to anomaly descriptions. Check failure messages permanently show <masked> in place of actual values. The original value is not stored in the anomaly record. Use the source record reveal toggle to investigate specific values.
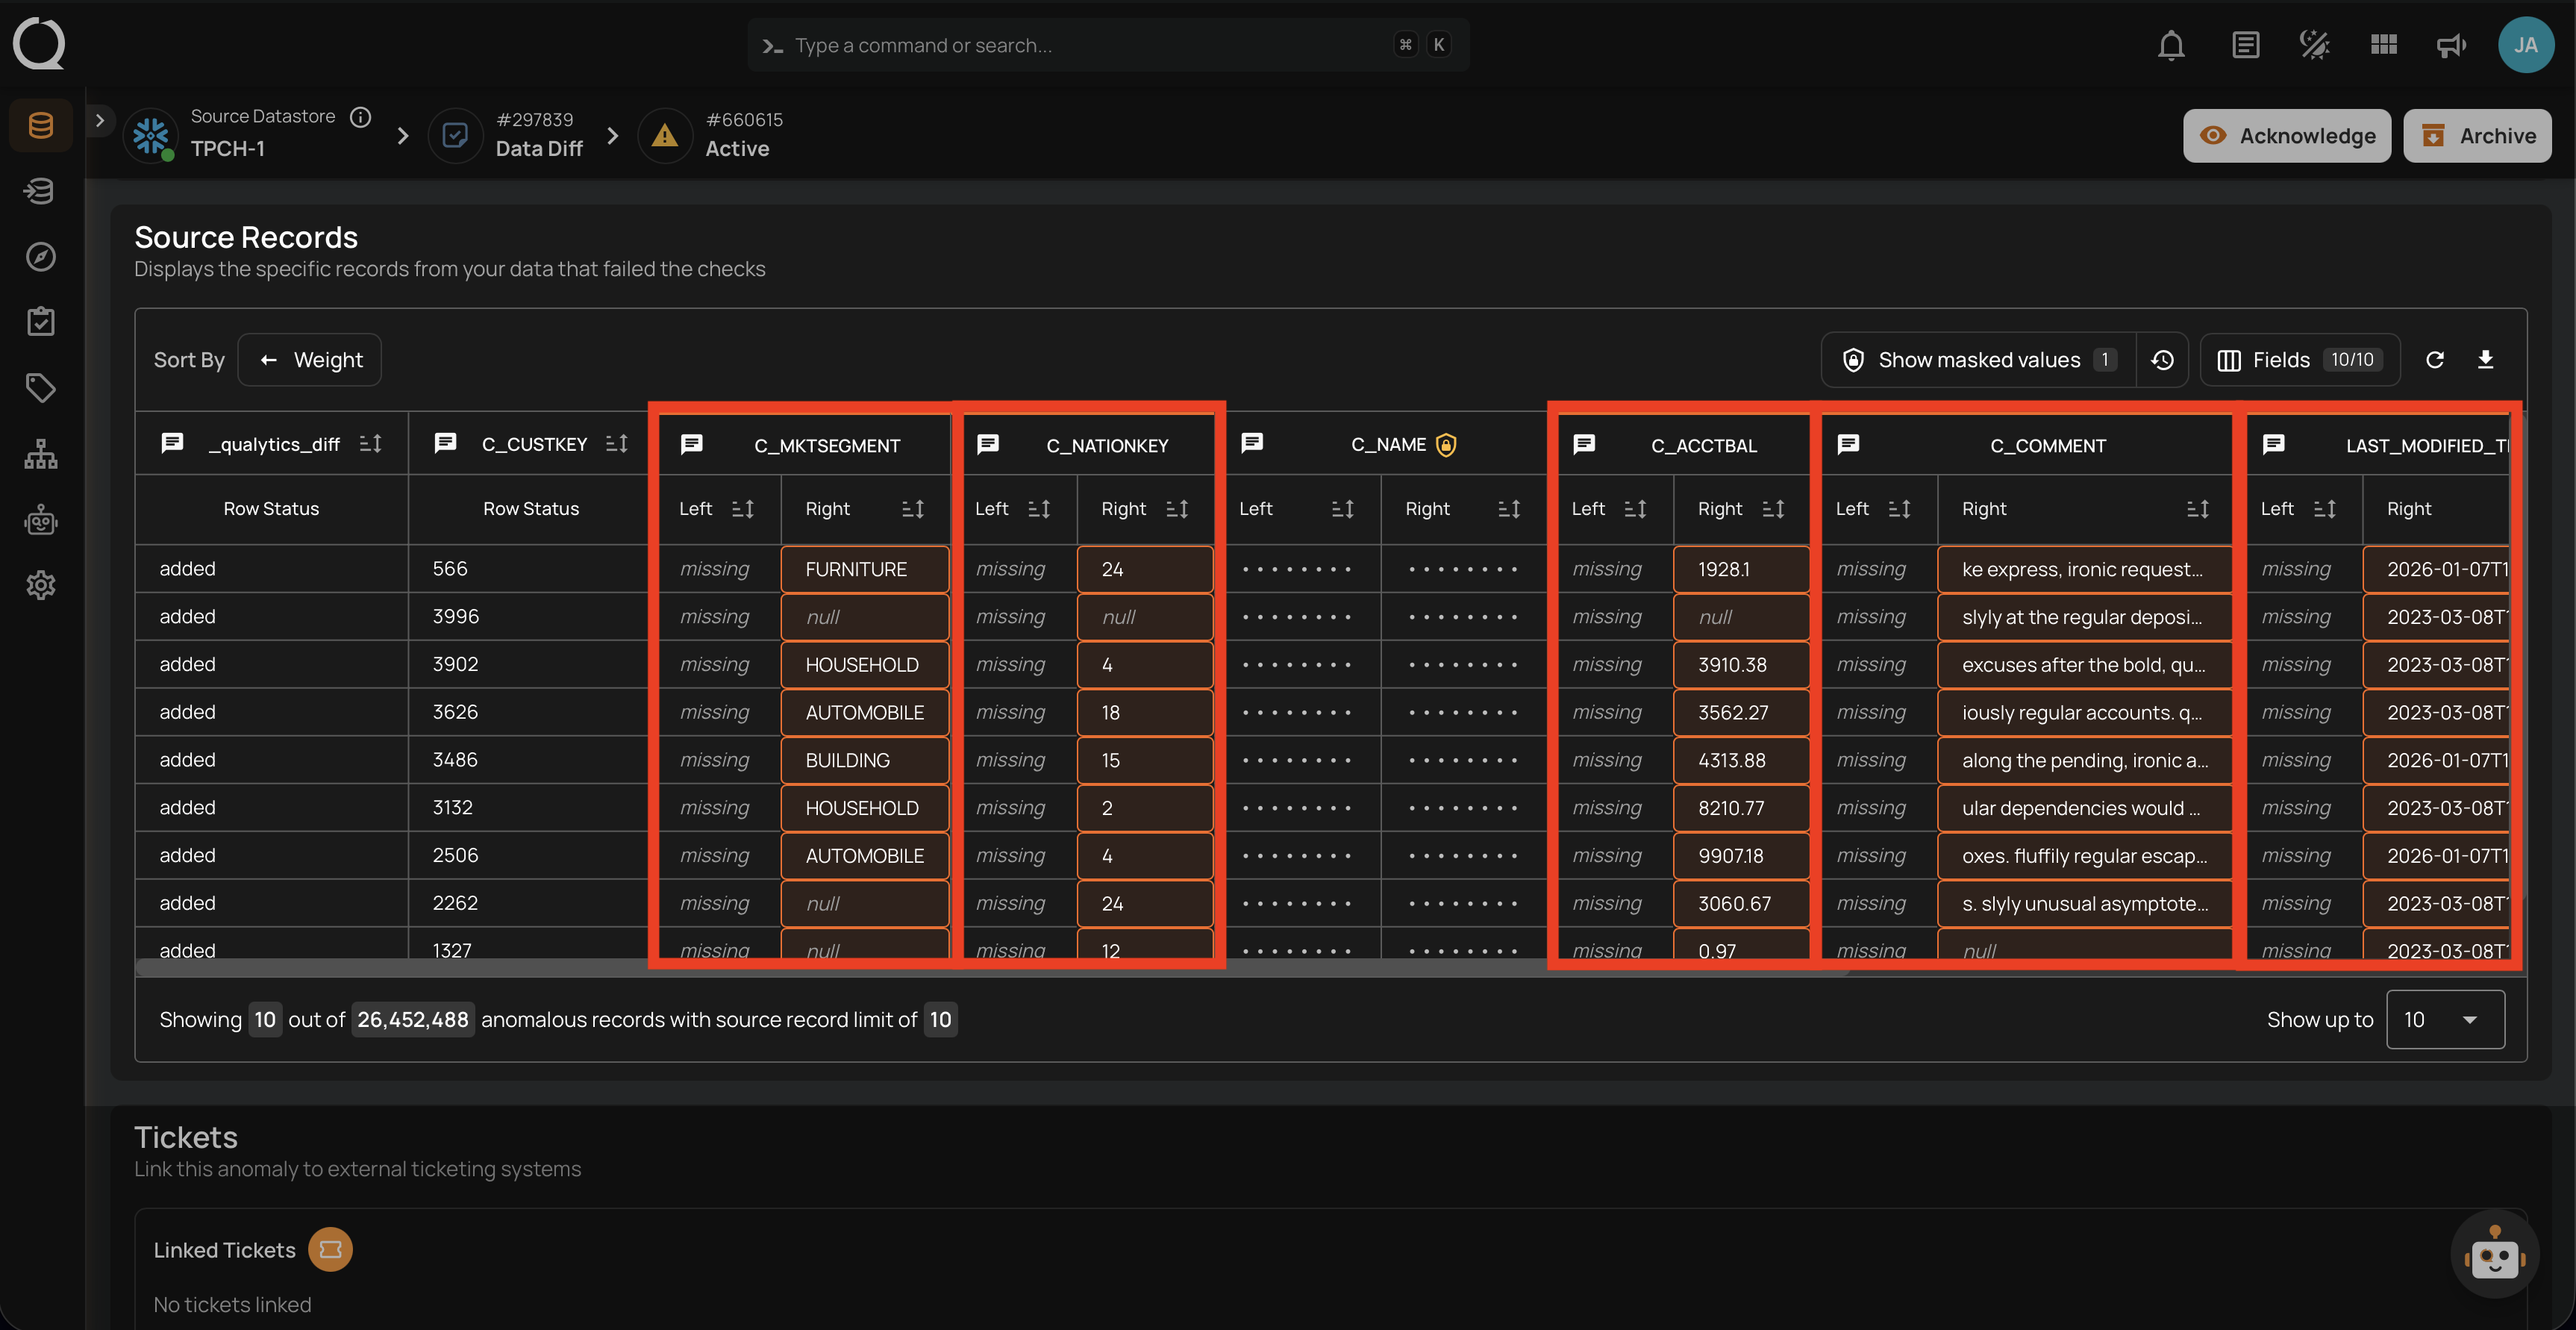
Comparison Source Records
Anomalies identified by the Data Diff rule type, configured with Row Identifiers, are displayed with a detailed source record comparison. This visualization highlights differences between rows, making it easier to identify specific discrepancies.