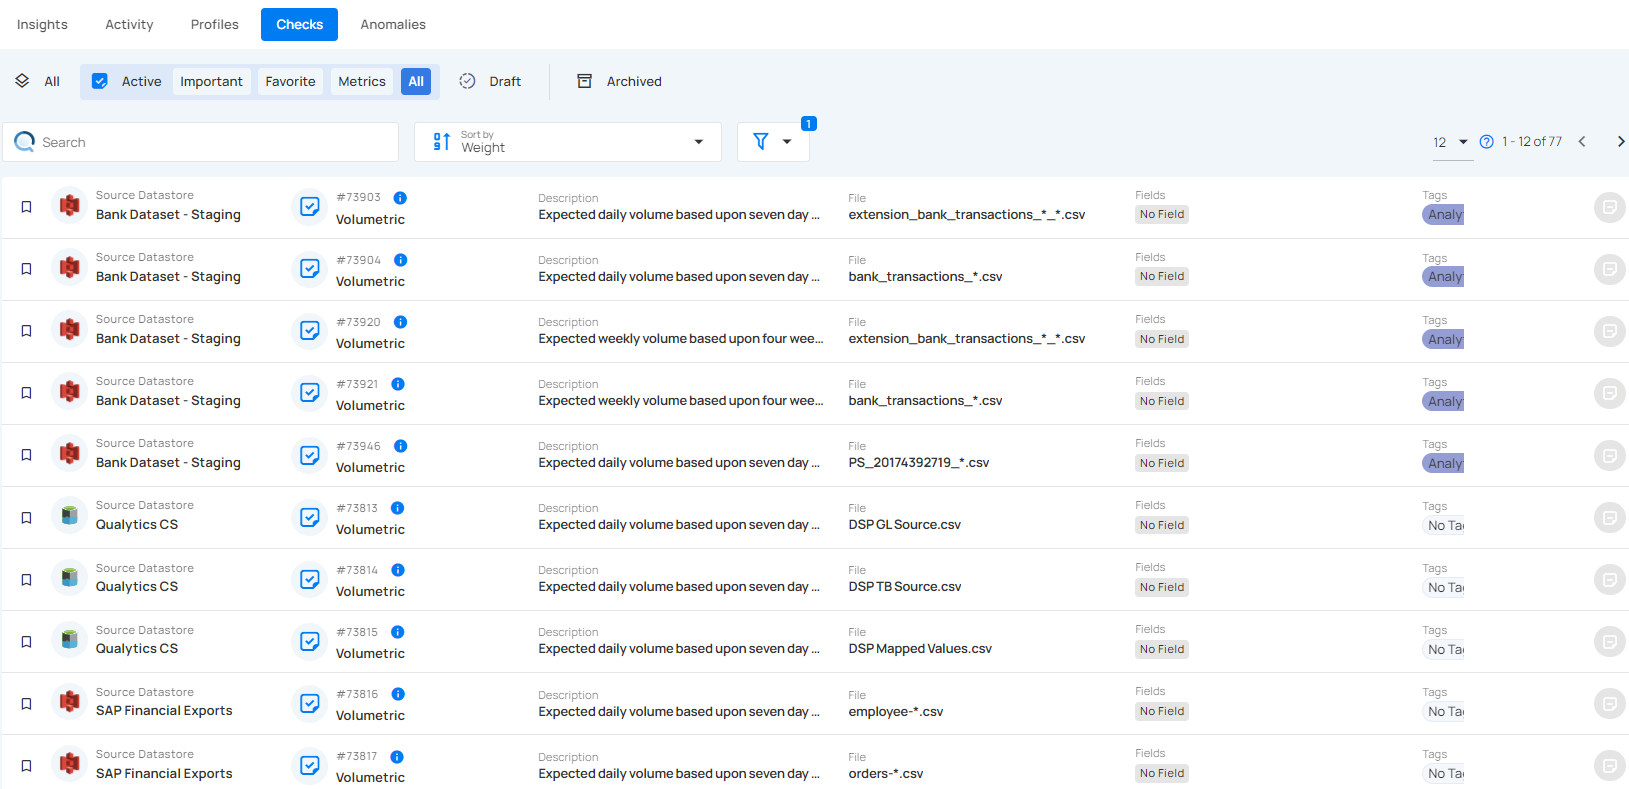
Volumetric Check
Volumetric Check ensures data stability by monitoring fluctuations in a table or file's row count. It detects anomalies by comparing current volumes against historical trends (daily, weekly, monthly). Users can configure rules for precise control, while automated threshold adjustments enhance accuracy over time.
Let's get started 🚀
Configure Volumetric Check
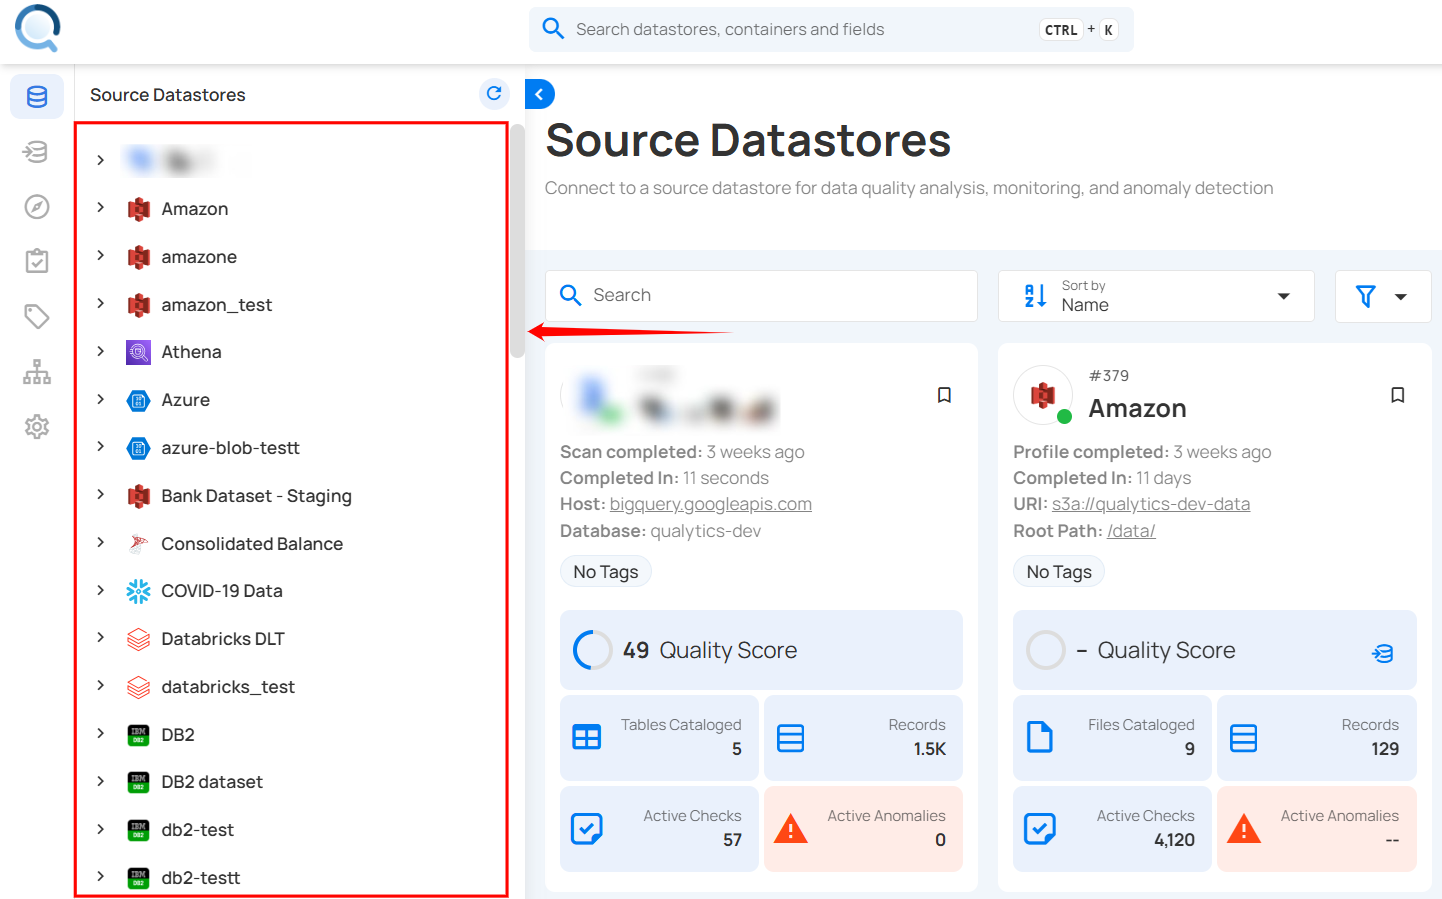
Step 1: Login into your Qualytics account and select the datastore from the left menu on which you want to add a volumetric check.
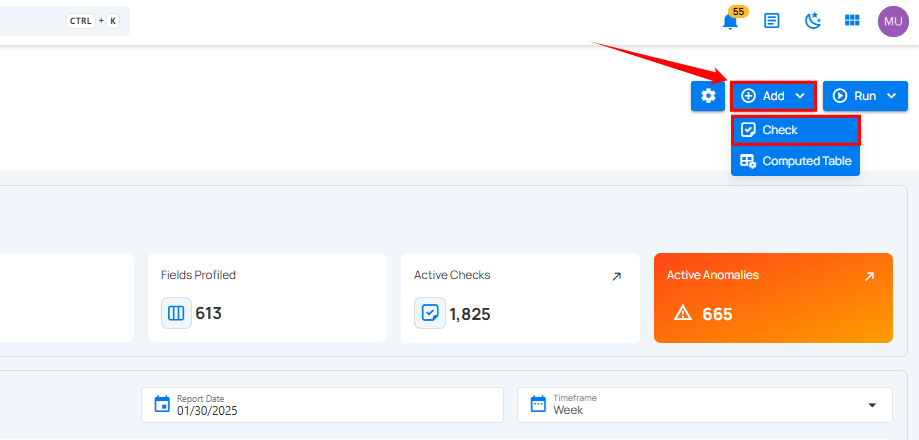
Step 2: Click the Add button and select Checks.
Step 3: A modal window appears. Enter the required details to configure the Volumetric Check.
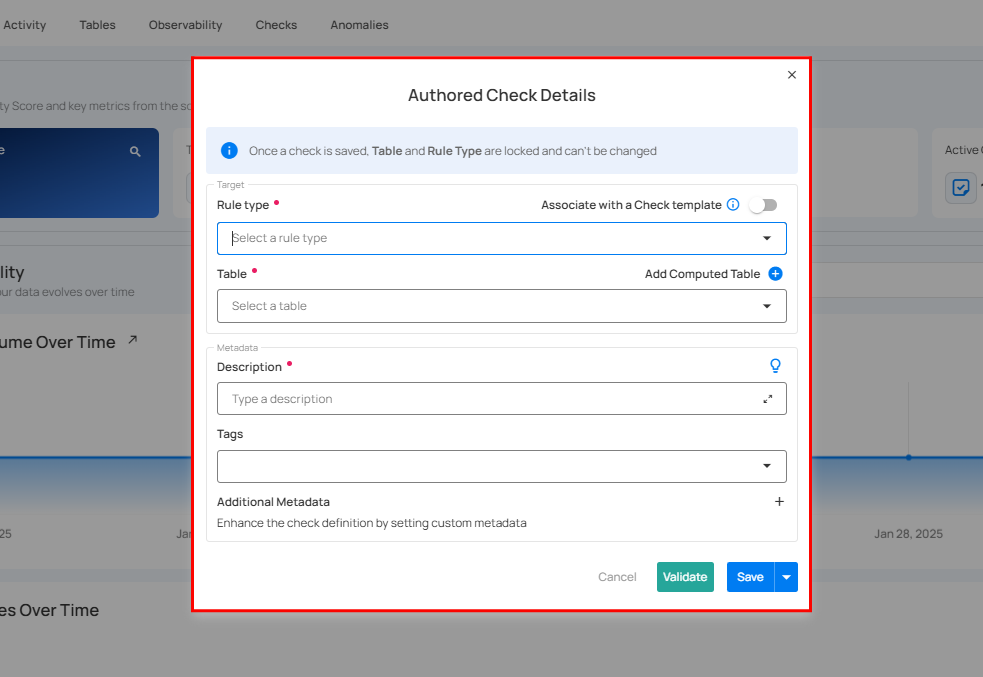
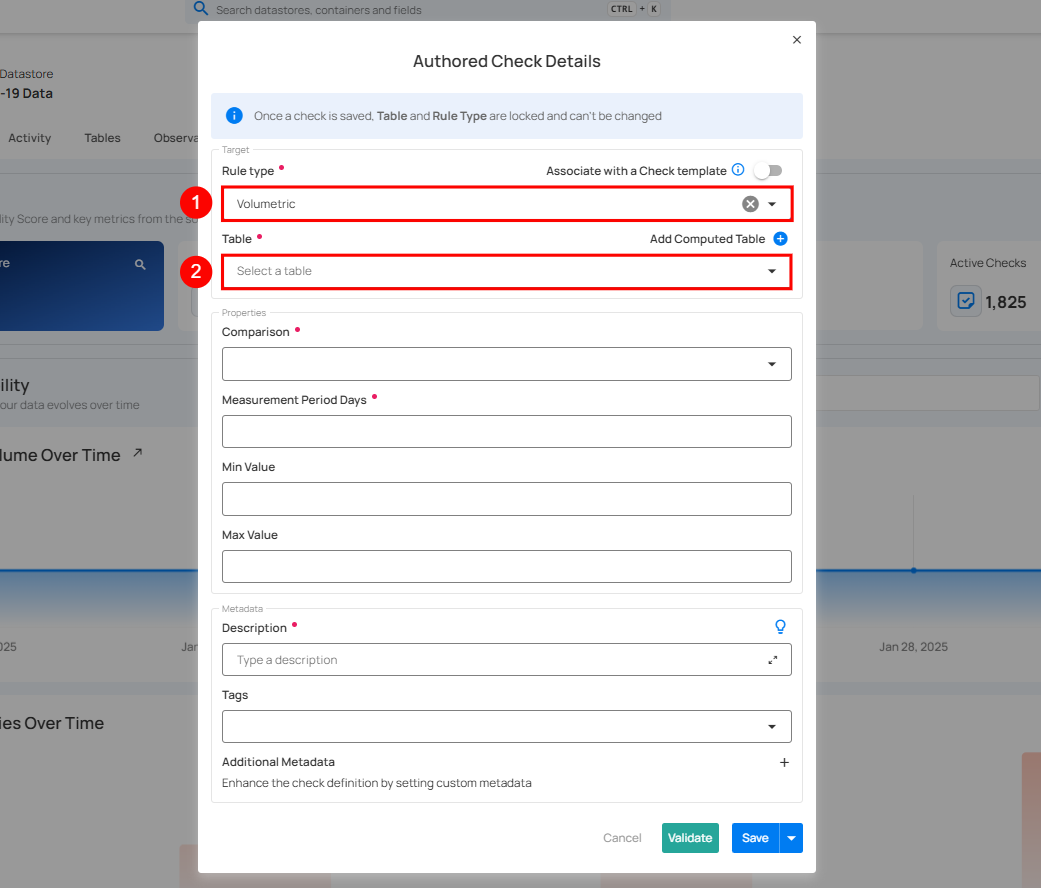
Step 4: Enter the details to configure the volumetric check:
| No. | Field | Description |
|---|---|---|
| 1. | Rule Type | Select the Volumetric Rule type from the dropdown. |
| 2. | Table | Select the table for the rule to apply. |
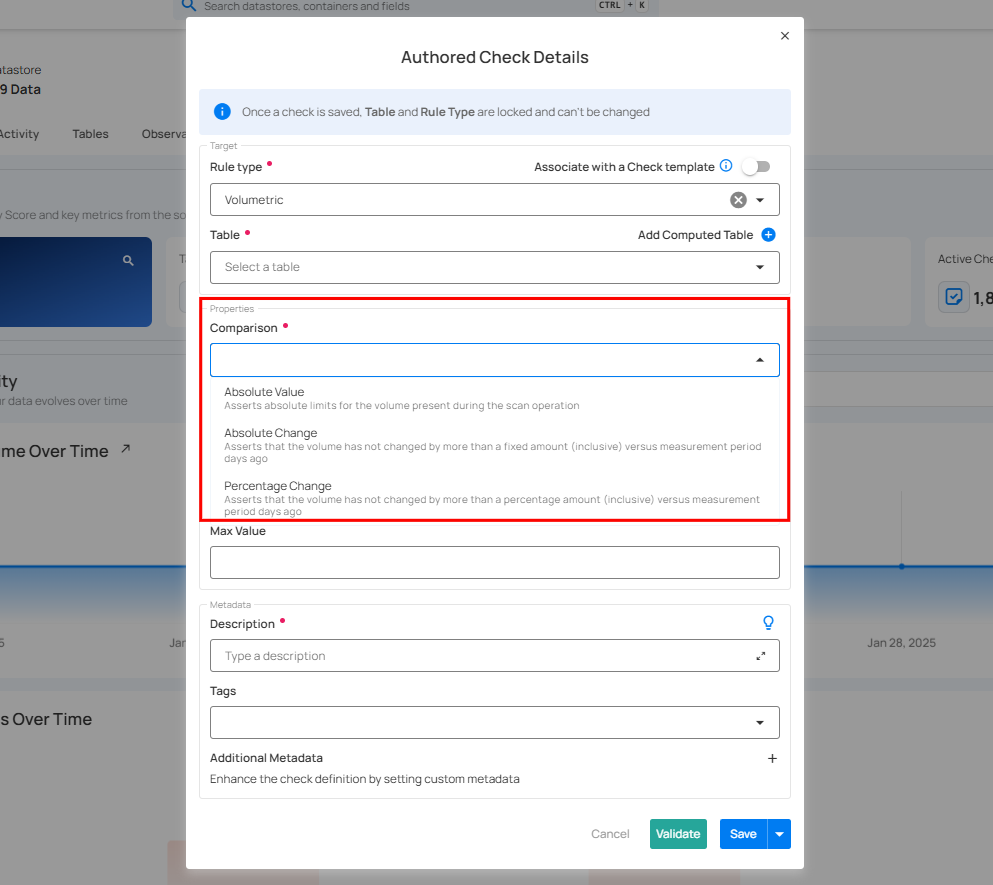
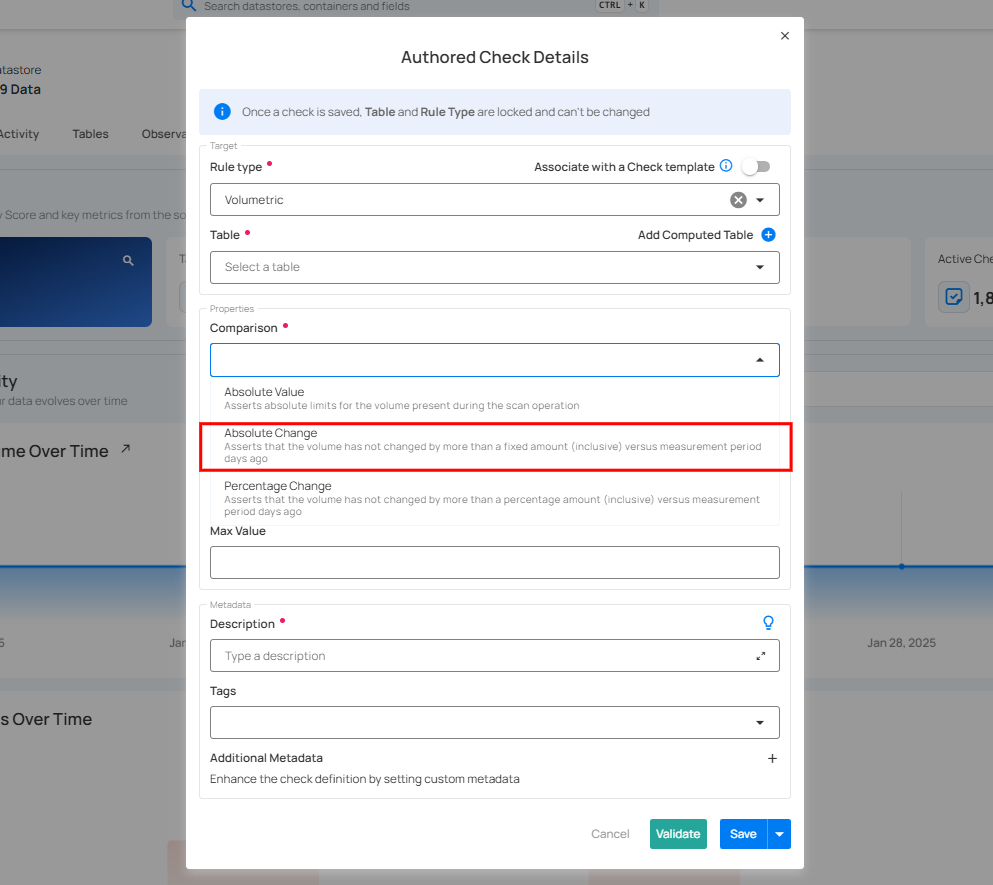
3. Comparison: Specifies the type of comparison: Absolute Change, Absolute Value, or Percentage Change:
Details
Comparison Options
Absolute Value
The Absolute Value comparison works by comparing the row count to a pre-set limit between Min and Max values. When the Measurement Period is longer than one day, the value compared is the average daily row count across that period. If it falls outside the specified range when the check is asserted, an anomaly is identified.
Illustration
The value of the record in each scan should be within 100 and 300 to be considered normal
Thresholds: Min Value = 100, Max Value = 300
| Scan | Current Value | Anomaly Detected |
|---|---|---|
| #1 | 150 | No |
| #2 | 90 |
Yes |
| #3 | 250 | No |
| #4 | 310 |
Yes |
Details
Comparison Options
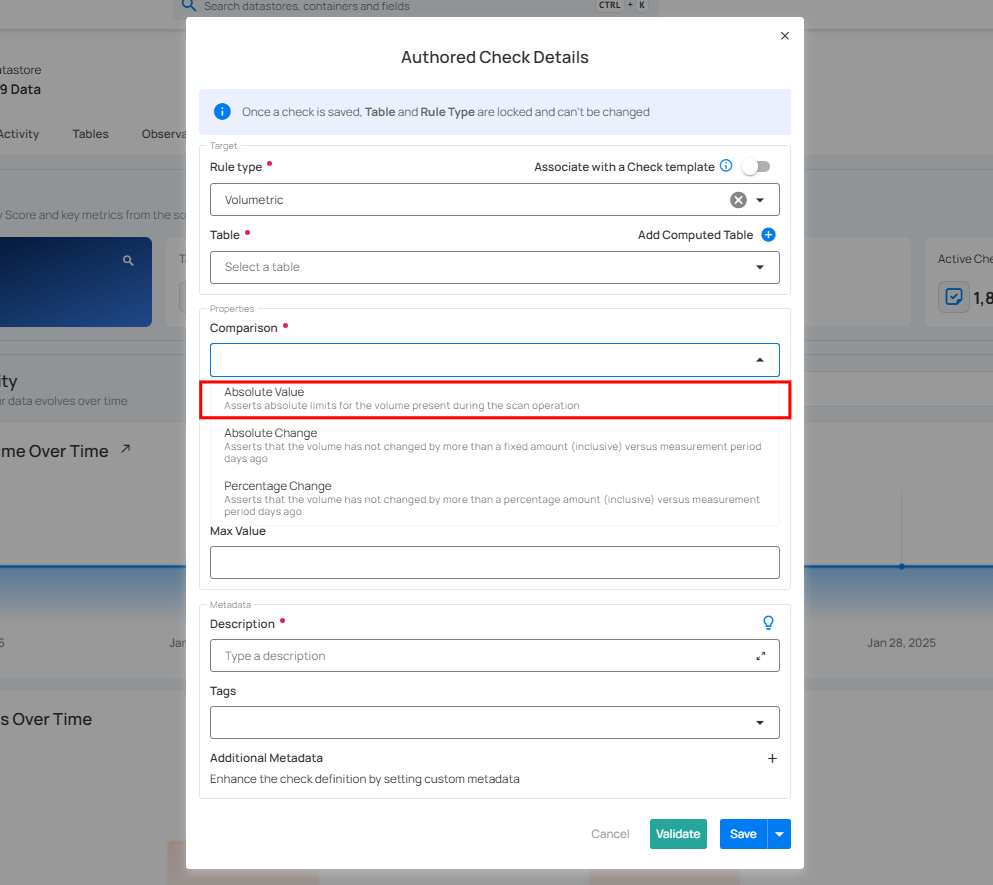
Absolute Change
The Absolute Change comparison works by comparing the change in the row count to a pre-set limit (Min / Max). If the count changes by more than this specified limit since the measurement one Measurement Period earlier, an anomaly is identified. A 1 Day check compares against yesterday's count, and a 7 Days check compares against the count from seven days ago.
Illustration
Any change in row count smaller than 30 or greater than 70 compared to one measurement period earlier should be flagged as anomalous
Thresholds: Min Change = 30, Max Change = 70
| Scan | Previous Value | Current Value | Absolute Change | Anomaly Detected |
|---|---|---|---|---|
| #1 | - | 100 | - | No |
| #2 | 100 | 150 | 50 | No |
| #3 | 150 | 220 | 70 | No |
| #4 | 220 | 300 |
80 |
Yes |
Details
Comparison Options
Percentage Change
The Percentage Change comparison operates by tracking changes in the row count relative to its earlier value. If the change exceeds the predefined percentage (%) limit since the measurement one Measurement Period earlier, an anomaly is generated.
Illustration
An anomaly is identified if the row count decreases by more than 20% or increases by more than 50% compared to one measurement period earlier.
Thresholds: Min Percentage Change = -20%, Max Percentage Change = 50%
Percentage Change Formula: ( (current_value - previous_value) / previous_value ) * 100
| Scan | Previous Value | Current Value | Percentage Change | Anomaly Detected |
|---|---|---|---|---|
| 1 | - | 100 | - | No |
| 2 | 100 | 150 | 50% | No |
| 3 | 150 | 120 | -20% | No |
| 4 | 120 | 65 | -45.83% |
Yes |
| 5 | 65 | 110 | 69.23% |
Yes |
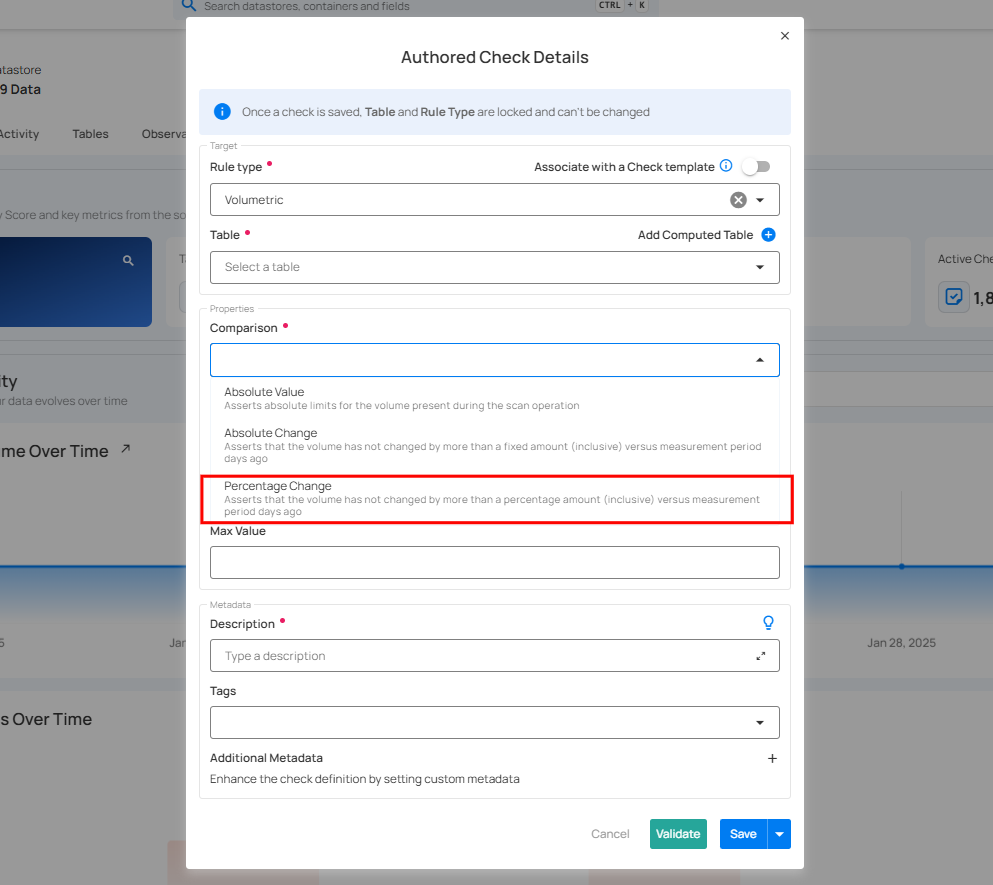
4. Measurement Period Days: Enter the number of days for measurement.
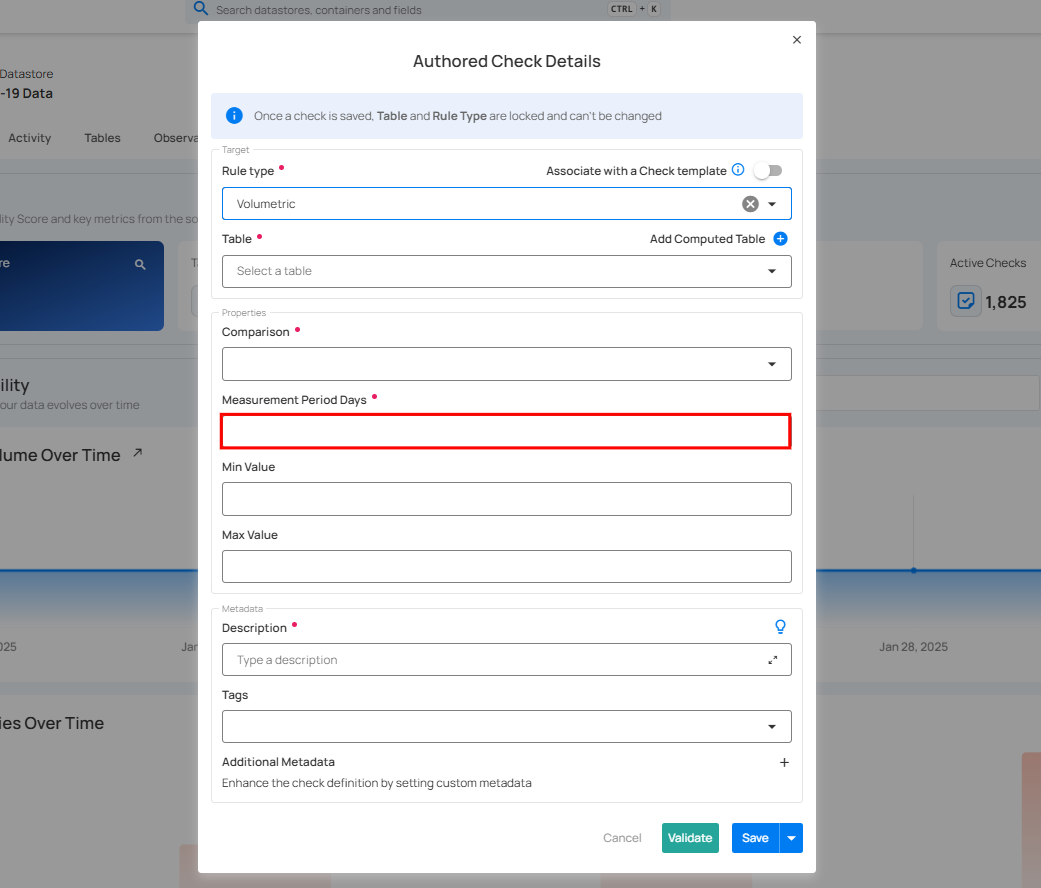
5. Threshold: At least the Min or Max value must be specified, and including both is optional. What these values bound depends on the comparison: the row count itself for Absolute Value, or how much it may move for Absolute Change and Percentage Change.
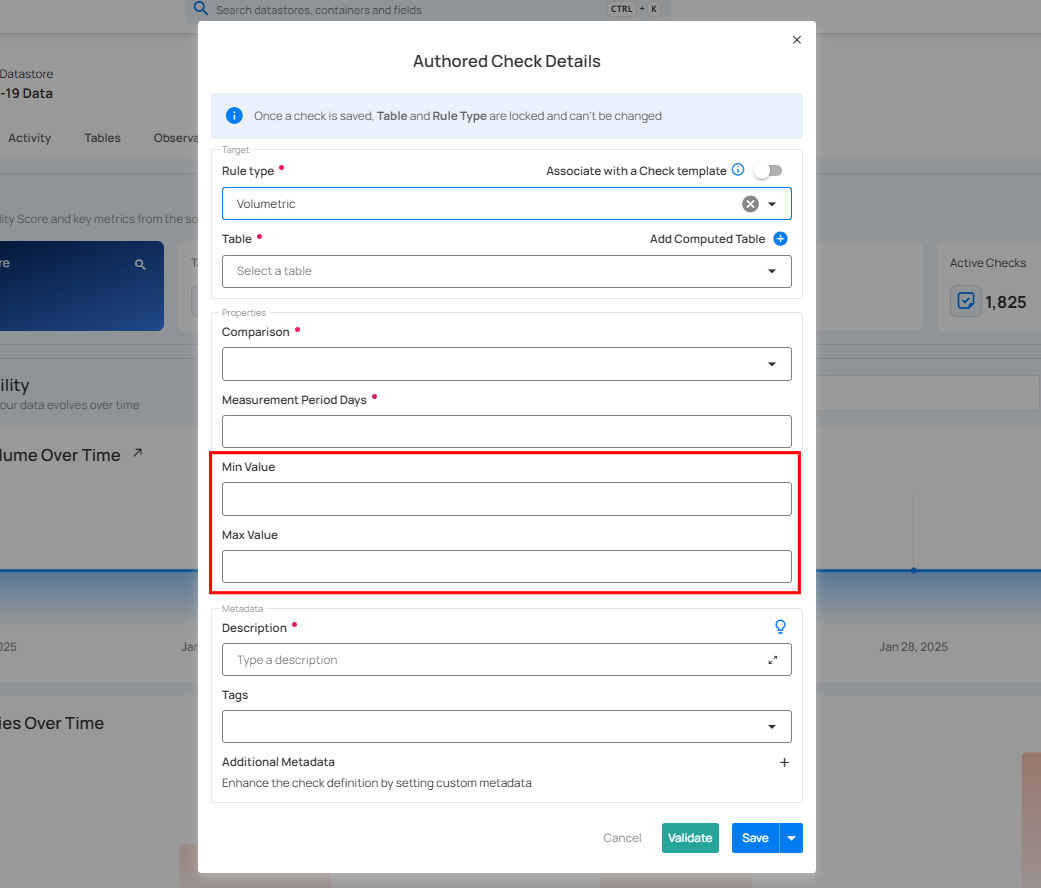
Min Value
-
For
Absolute Value, represents the minimum acceptable row count. -
For
Absolute Change, represents the minimum acceptable change in the row count since one Measurement Period earlier. A negative Min Value allows the count to decrease by up to that amount. -
For
Percentage Change, represents the same limit expressed as a percentage of the earlier count.
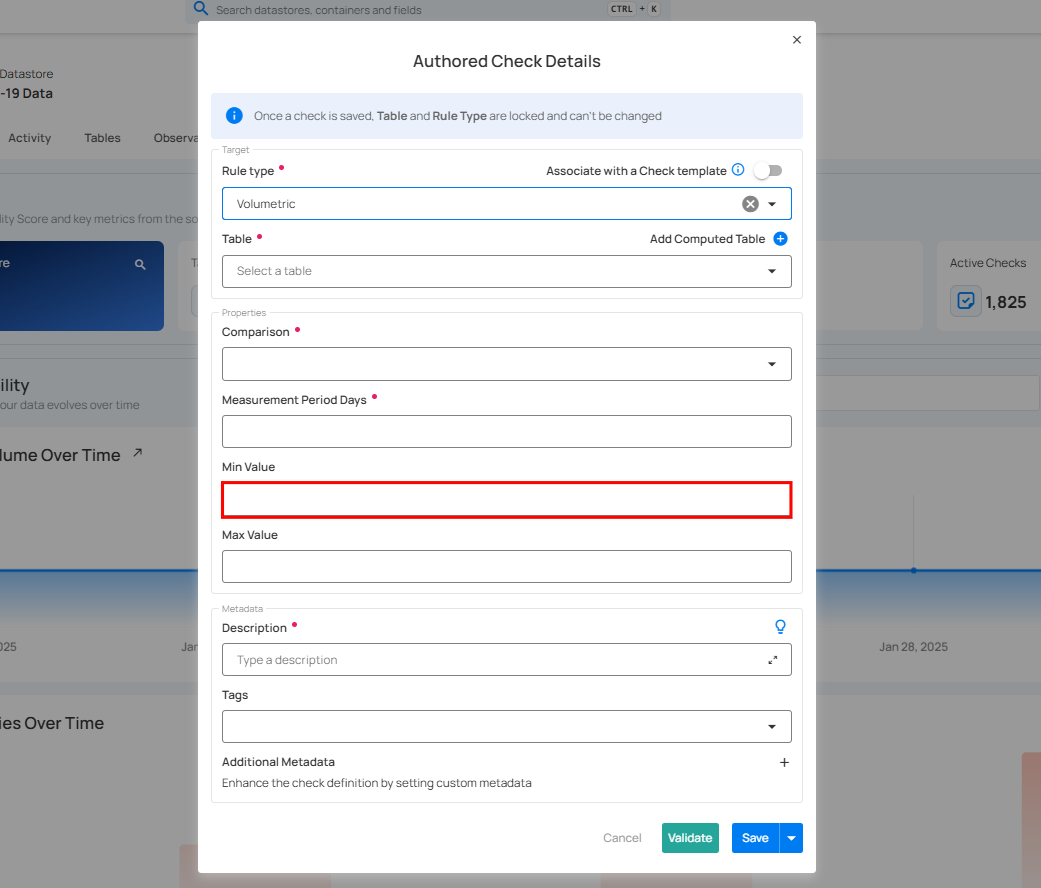
Max Value
-
For
Absolute Value, represents the maximum acceptable row count. -
For
Absolute ChangeandPercentage Change, sets the upper limit for the count's growth, as a fixed amount or a percentage of the earlier count.
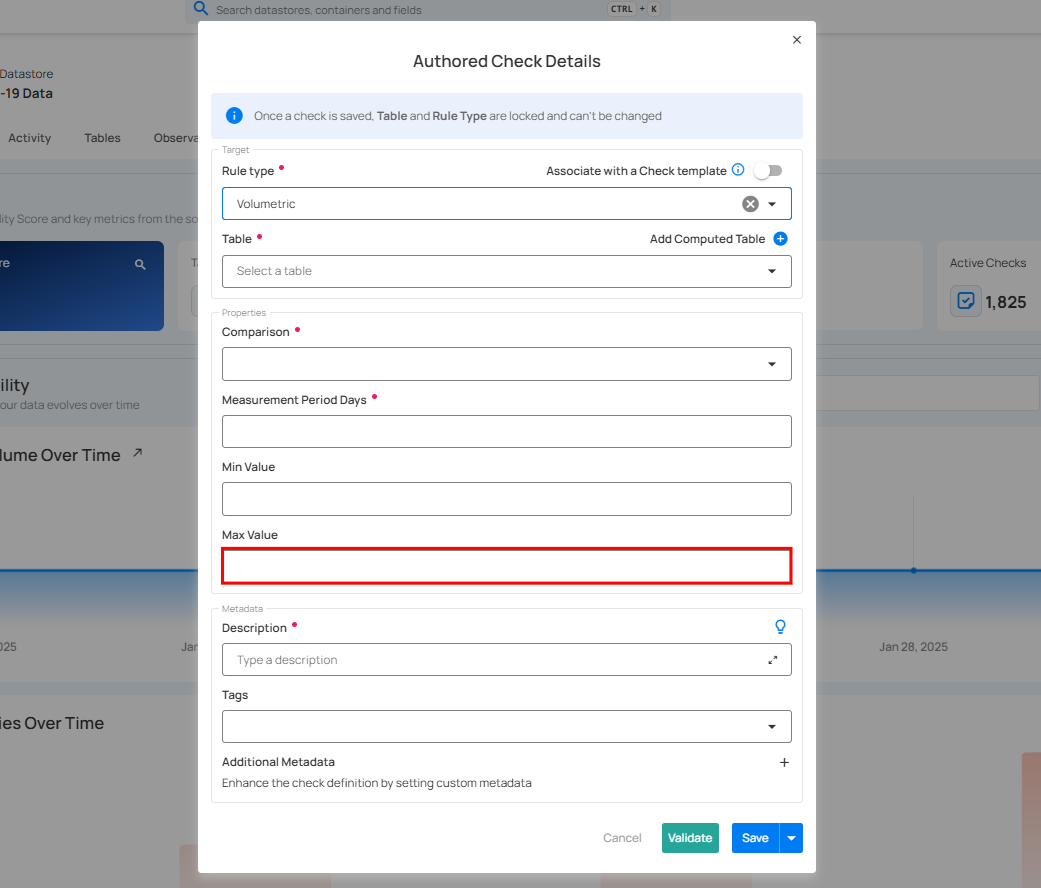
| No. | Field | Description |
|---|---|---|
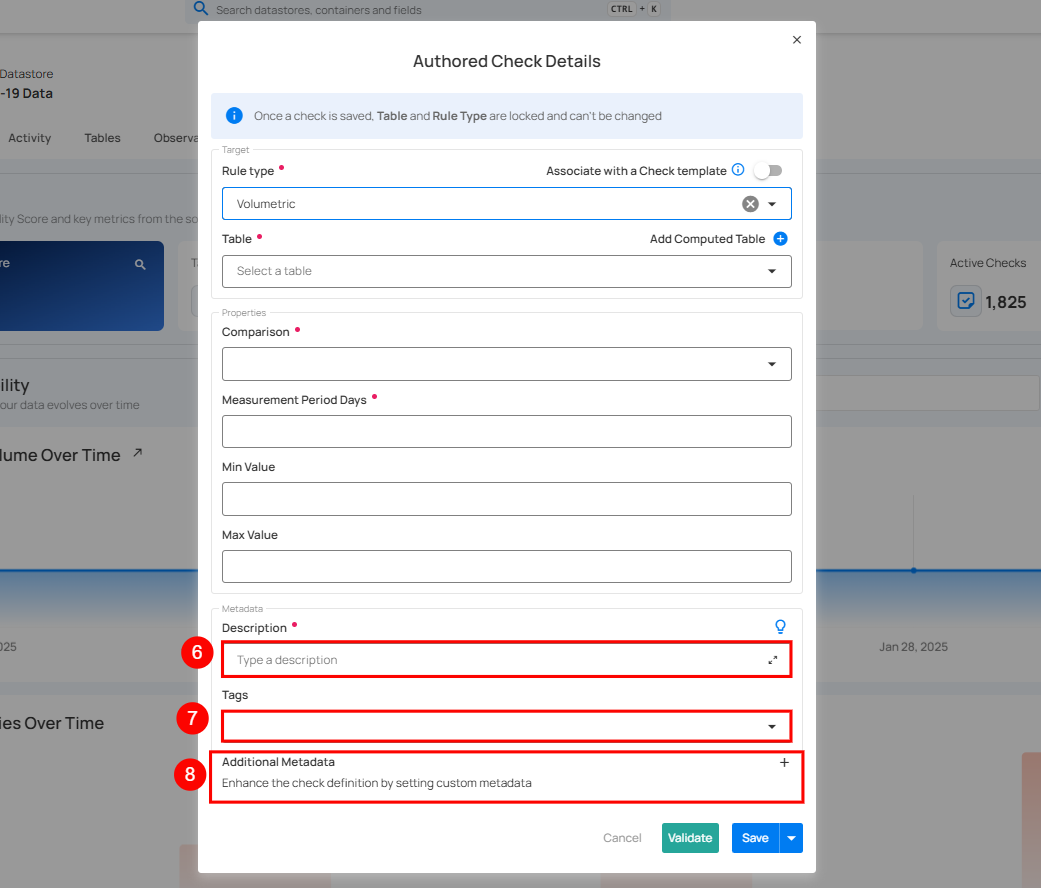
| 6. | Description | Enter a description for the check. The description supports Markdown formatting. |
| 7. | Tag | Add tags for categorizing the check. |
| 8. | Additional Metadata | Add custom metadata for additional details. |
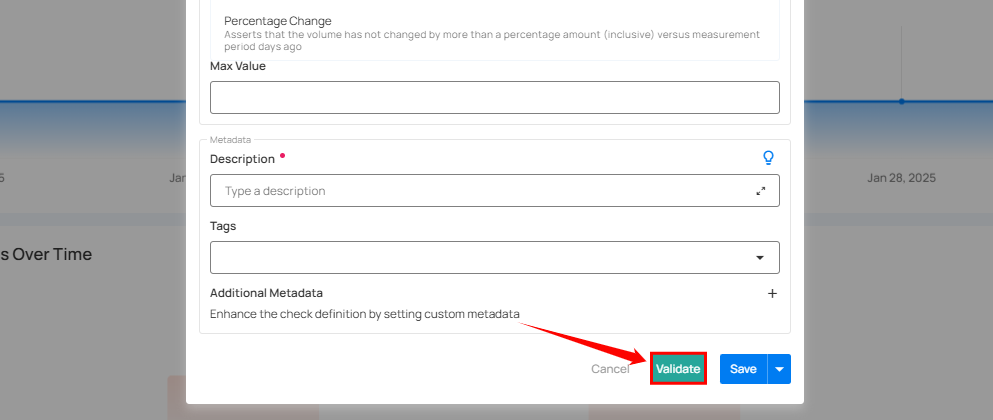
Step 4: After completing all the check details, click on the "Validate" button. This will perform a validation operation on the check without saving it. The validation allows you to verify that the logic and parameters defined for the check are correct. It ensures that the check will work as expected by running it against the data without committing any changes.
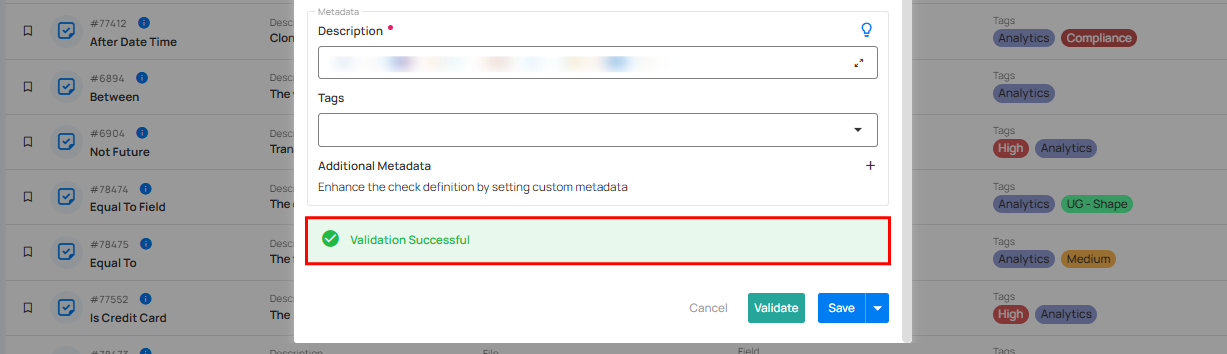
If the validation is successful, a green message will appear saying "Validation Successful".
Step 5: Once you have a successful validation, click the "Save" button.
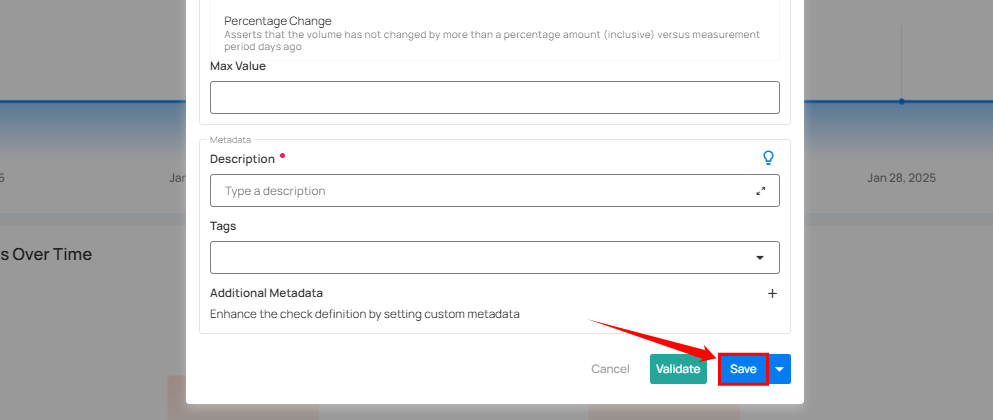
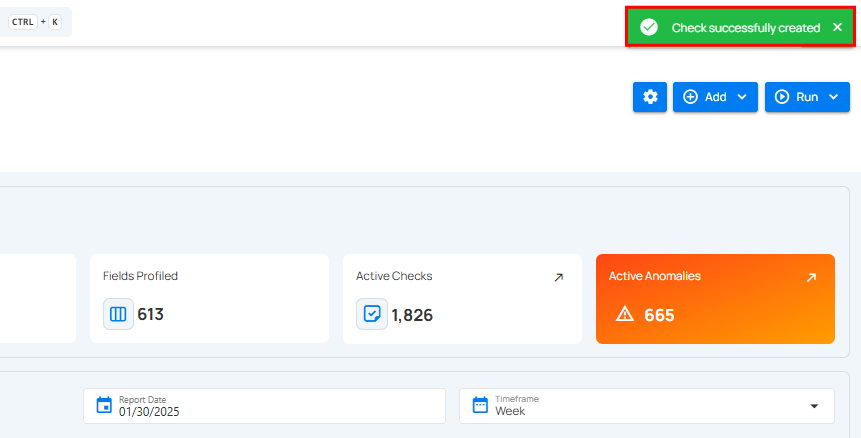
After clicking on the “Save” button your check is successfully created and a success flash message will appear saying “Check successfully created”.
How It Works
The system automatically infers and maintains volumetric checks from the row count changes it observes over daily, weekly, and monthly windows. These checks enable proactive management of data volume trends, ensuring that any unexpected deviations are identified as anomalies for review.
Automating Adaptive Volumetric Checks
The following Volumetric Checks are automatically inferred for data assets with automated volume measurements enabled. All three use the Absolute Change comparison, so their Min and Max thresholds bound how far the row count may move across the check's Measurement Period rather than what the count itself may be:
-
Daily (
1 Day): the expected change in volume from one day to the next, inferred from the daily changes observed over the previous 7 to 28 days. -
Weekly (
7 Days): the expected change in volume from one week to the next, inferred from the weekly changes observed over the previous four weeks. -
Monthly (
28 Days): the expected change in volume over 4 weeks, inferred from the 4-week changes observed over the previous sixteen weeks.
In each case the thresholds are the range of changes actually observed during the training period, widened by a multiple of their standard deviation so that a change slightly outside what the training period happened to see does not raise an anomaly.
Each check only appears once its window has enough history to learn from: the 1 Day check after about a week of measurements, the 7 Days check after about a month, and the 28 Days check after about sixteen weeks. Inference also needs measurements taken exactly one Measurement Period apart, since each observed change compares a count against the count from one period earlier. A container that is measured only sporadically may not receive an inferred check at all until enough evenly spaced measurements accumulate.
Scan Assertion and Anomaly Creation
Volumetric Checks are asserted during a Scan Operation just like all other check types and enrichment of volumetric check anomalies is fully supported. This enables full support for custom scheduling of volumetric checks and remediation workflows of volumetric anomalies.
Adaptive Thresholds and Manual Adjustments
The system re-infers each AI Managed Volumetric Check about once a day, on its next daily measurement. Manually authored checks, and checks owned by a locked check template, keep the thresholds you set.
1.Automatic Threshold Adjustment:
-
A newly inferred check pads the observed range of changes by about 1.5 standard deviations.
-
On each update the padding is set from how much confidence the platform has in the check, starting as wide as 2 standard deviations and tightening toward 1 as confidence grows, so the thresholds track observed behavior more closely over time.
2.Continuous Learning:
- The system monitors past data and adapts thresholds to detect unusual data volume changes.
3.Why It Matters:
-
Helps maintain data integrity by identifying unexpected volume changes.
-
Ensures quick detection and response to potential data issues.