Container Attributes
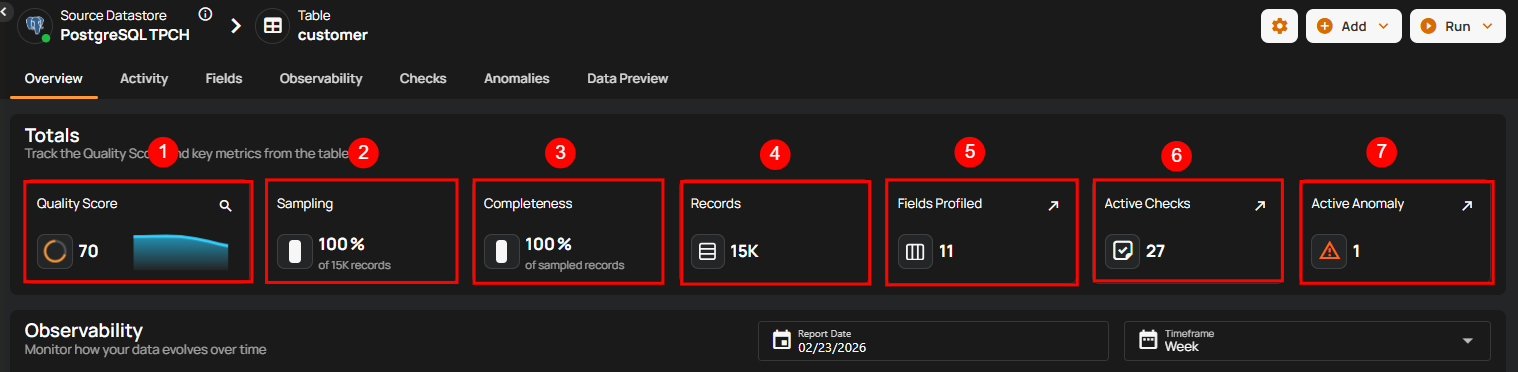
Totals
Note
Totals are calculated from sampled data, not the full dataset. Values may differ from actual totals across all records.
1 Quality Score: This represents the overall health of the data based on various checks. A higher score indicates better data quality and fewer issues detected.
2 Sampling: Displays the percentage of data sampled during profiling. A 100% sampling rate means the entire dataset was analyzed for the quality report.
3 Completeness: Indicates the percentage of records that are fully populated without missing or incomplete data. Lower percentages may suggest that some fields have missing values.
4 Records Profiled: Shows the number or percentage of records that have been analyzed during the profiling process.
5 Fields Profiled: This shows the number of fields or attributes within the dataset that have undergone data profiling, which helps identify potential data issues in specific columns.
6 Active Checks: Represents the number of ongoing checks applied to the dataset. These checks monitor data quality, consistency, and correctness.
7 Active Anomalies: Displays the total number of anomalies found during the data profiling process. Anomalies can indicate inconsistencies, outliers, or potential data quality issues that need resolution.
Observability
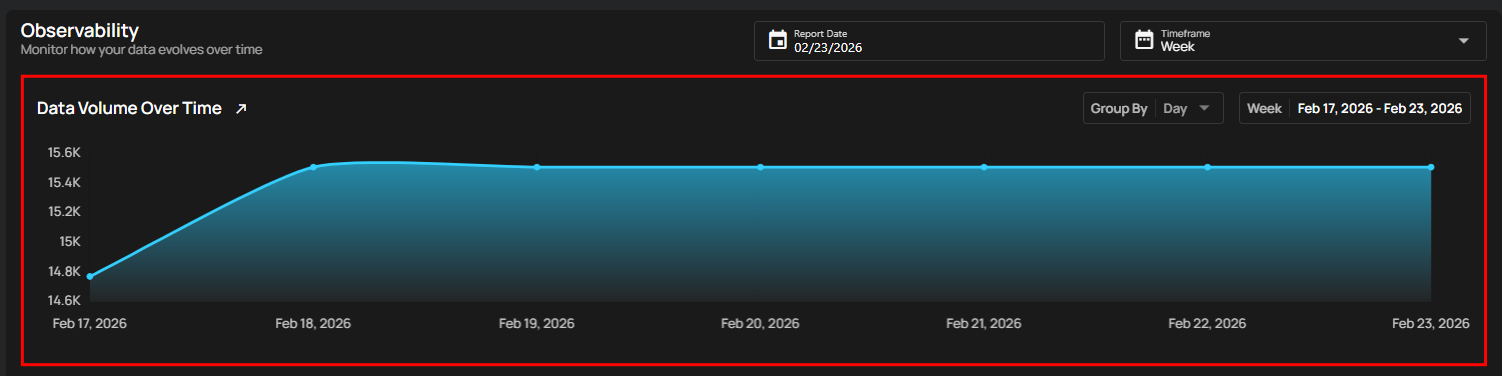
1 Volumetric Measurement
Volumetric measurement allows users to track the size of data stored within the table over time. This helps in monitoring how the data grows or changes, making it easier to detect sudden spikes that may impact system performance. Users can visualize data volume trends and manage the table's efficiency. This helps in optimizing storage, adjusting resource allocation, and improving query performance based on the size and growth of the computed table.
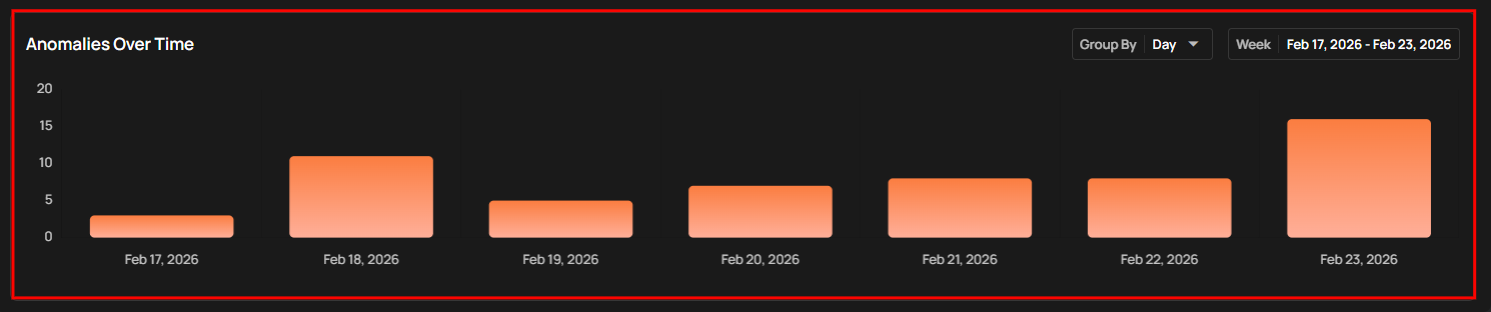
2 Anomalies Measurement
The Anomalies section helps users track any unusual data patterns or issues within the computed tables. It shows a visual representation of when anomalies occurred over a specific time period, making it easy to spot unusual activity. This allows users to quickly identify when something might have gone wrong and take action to fix it, ensuring the data stays accurate and reliable.
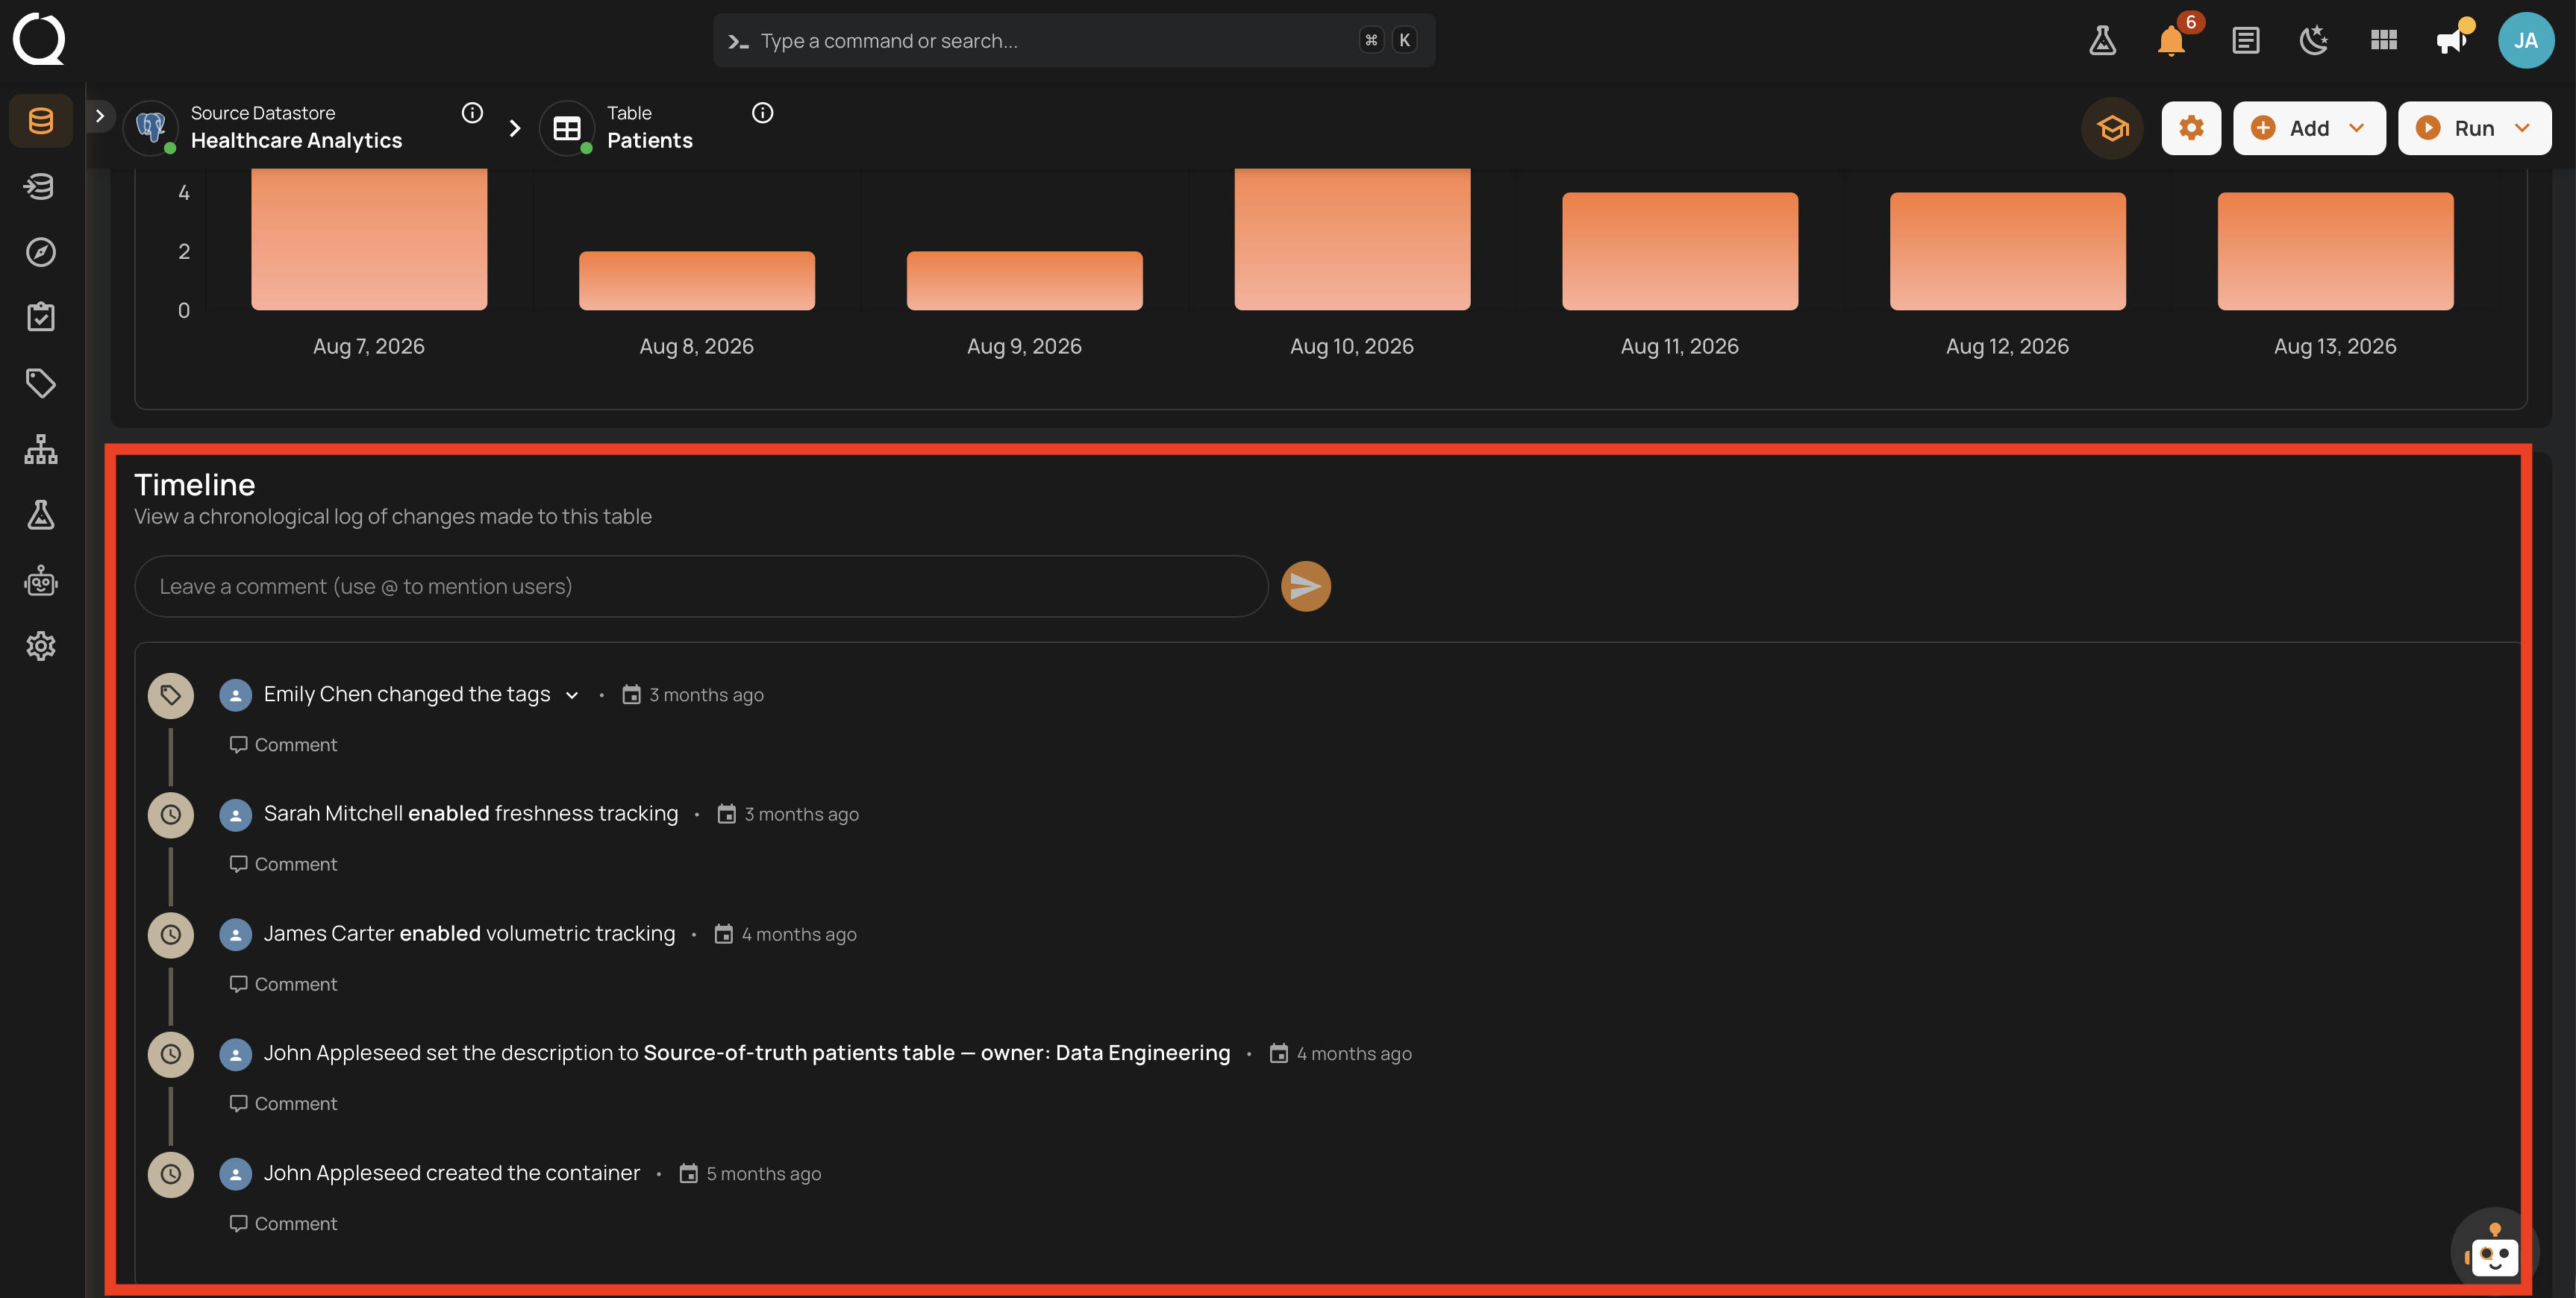
Timeline
The Timeline section displays a detailed, chronological log of all configuration changes. It provides complete visibility into what was modified, who made the update, and when the action occurred. Click Show more at the bottom of the list to load older changes.
Ownership changes on a computed asset are recorded here alongside the other configuration changes. The entry names the previous and new owner, so a transfer is auditable in the same timeline as edits to the definition, the description, or the tags.
Note
This section was previously labeled History. It was renamed to Timeline because it now carries discussion alongside the change record.
Reviewing a Change
Short values are shown inline on the entry, reading from <previous value> to <new value>. A long change collapses behind a View changes control instead, so it never floods the Timeline: this happens when the two values together run past roughly 170 characters, or when either one contains a line break. The control reports the before and after lengths (for example, 32 → 166 chars) and expands into a panel with the From and To values. Any field can collapse this way, a rewritten description as much as a tag list. On a computed container, the query and clause fields are the exception: they always collapse behind the control, however short the change is. When one save changes several properties at once, they are grouped into a single entry rather than split into separate rows.
SQL changes get a richer view. For the Query of a Computed Table, the Select Clause, Where Clause, or Group By Clause of a Computed File or a two-source Computed Join, and the Query of a Computed Join built in SQL mode, View changes opens the two versions side by side, aligned line for line and sharing a single scrollbar, with the changed lines highlighted and a copy button on each side. See Computed Table Query Diff, Computed File Query Diff, or Computed Join Query Diff.
The dialog is titled after the field that changed, so a Computed File's filter opens as Where Clause Changes even though the edit form labels that input Filter Clause.
Commenting on the Timeline
You can discuss changes directly on the Timeline, which is what keeps the reason for a change next to the change itself:
- Comment on the container. Use the comment box above the Timeline, with the placeholder "Leave a comment (use @ to mention users)". The comment takes its own place in the Timeline, in chronological order.
- Comment on a specific change. Click the Comment control below a change entry. The comment stays attached to that entry, and once an entry has comments they collapse into a pill showing the author avatars, the comment count, and when the last comment was posted.
- Reply to a comment. Click the Reply control below a comment. Threads are one level deep, so you reply to a comment, not to a reply.
- Mention a teammate. Type
@and pick a user from the list. They receive an in-app Mention notification that opens this page, expands the thread, and highlights the comment, even when it sits further back in the Timeline.
Comment authors can edit and delete their own comments from the options menu on the comment; users with the Admin role can delete anyone's comment, and nobody can edit someone else's. Deleting a comment that already has replies leaves a placeholder reading This comment was deleted so the replies stay visible.
Permissions
Reading the Timeline and its comments requires at least the Reporter team permission on the datastore. Posting a comment, replying, and editing or deleting your own comment require at least the Viewer team permission. See Team Permissions.