Filter Observability Checks
The Observability listing exposes a different set of narrowing controls depending on where you are (Explore scope, Container scope) and which tab is active (Measures, Metrics). This page catalogs each combination so you know which control is available on each surface.
Permissions
Any user with at least Reporter on the datastore can narrow the Observability listing. See Observability Permissions for the full matrix.
Controls at a glance
| Control | Explore • Measures | Explore • Metrics | Container • Measures | Container • Metrics |
|---|---|---|---|---|
| Search | ||||
| Report Date | ||||
| Timeframe | ||||
| Sort By | ||||
| Filter menu |
The global Explore, Observability page lists checks across every datastore you have access to, so the full set of controls is available.
Measures tab
Five controls: Search, Report Date, Timeframe, Sort By, and Filter menu.
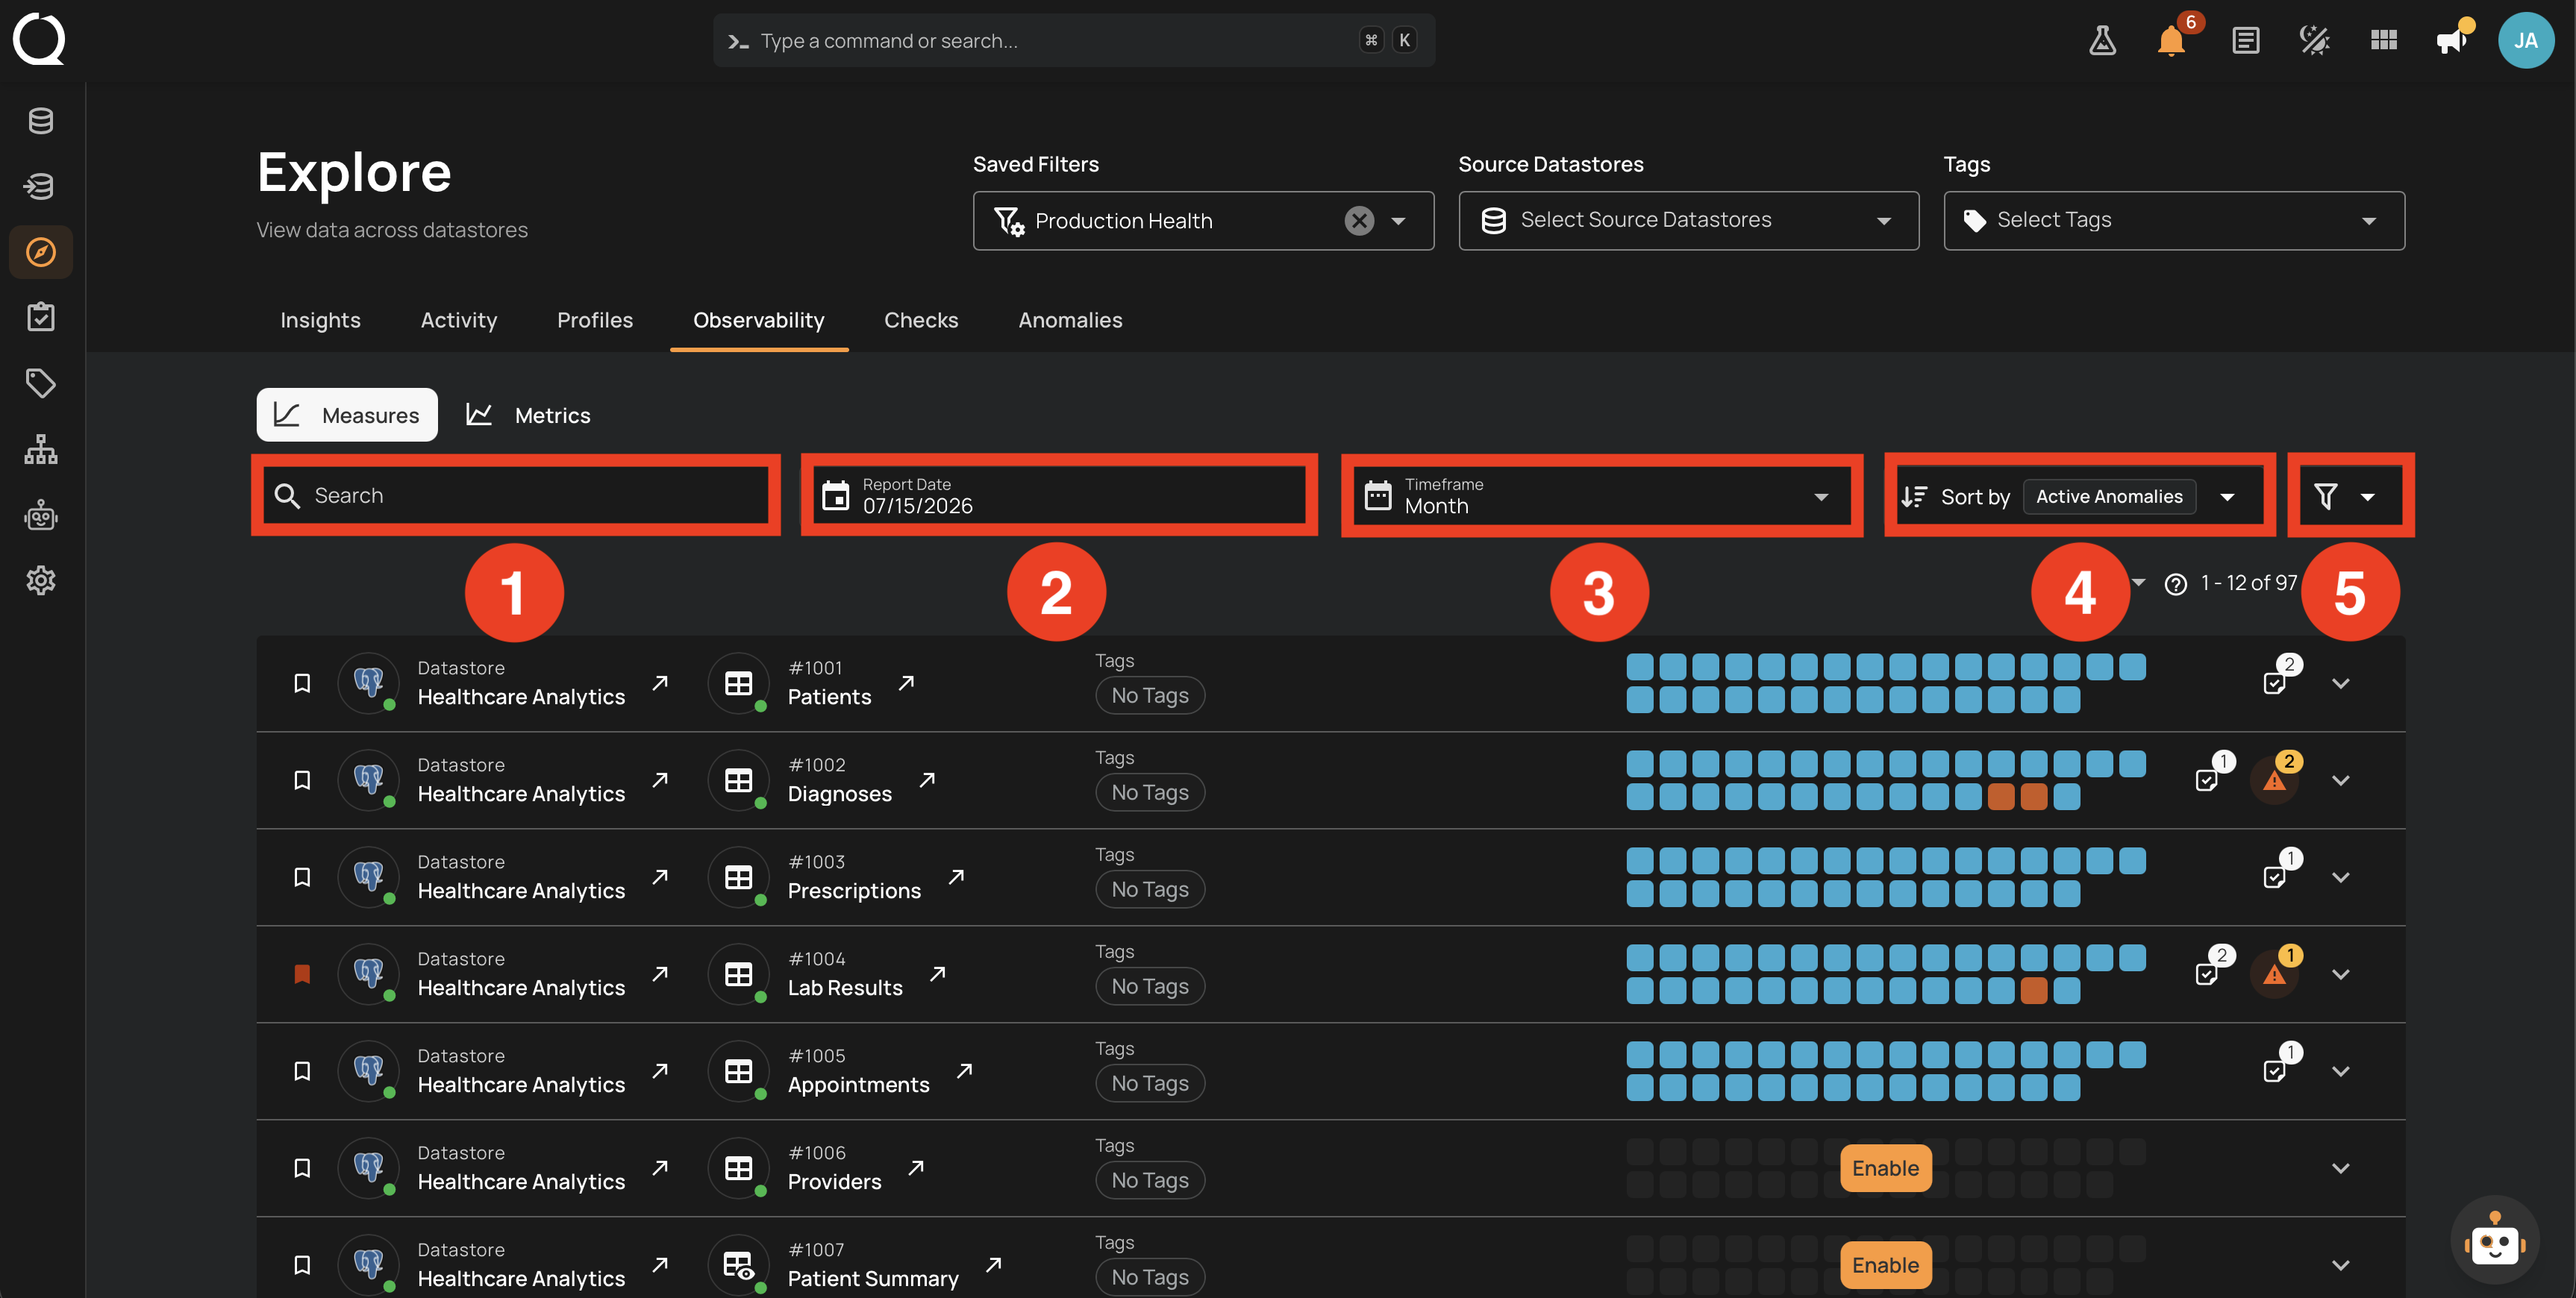
| # | Control | Purpose |
|---|---|---|
| 1 | Search | Match a container name or identifier. |
| 2 | Report Date | Anchor the charts to a specific end date. |
| 3 | Timeframe | Pick the window length (Week, Month, Quarter, Year). |
| 4 | Sort by | Order by Name, Type, Created Date, Active Anomalies, Active Checks, or Last Scanned. |
| 5 | Filter menu | Narrow by Tags, Rule Type (Volumetric / Freshness), Datastore, or Container. |
Metrics tab
Two controls at the tab level: Search and Sort By. Broader filtering (Datastore, Container, Tags) is applied via the top-of-page Saved Filters / Source Datastores / Tags dropdowns on the Explore page itself.
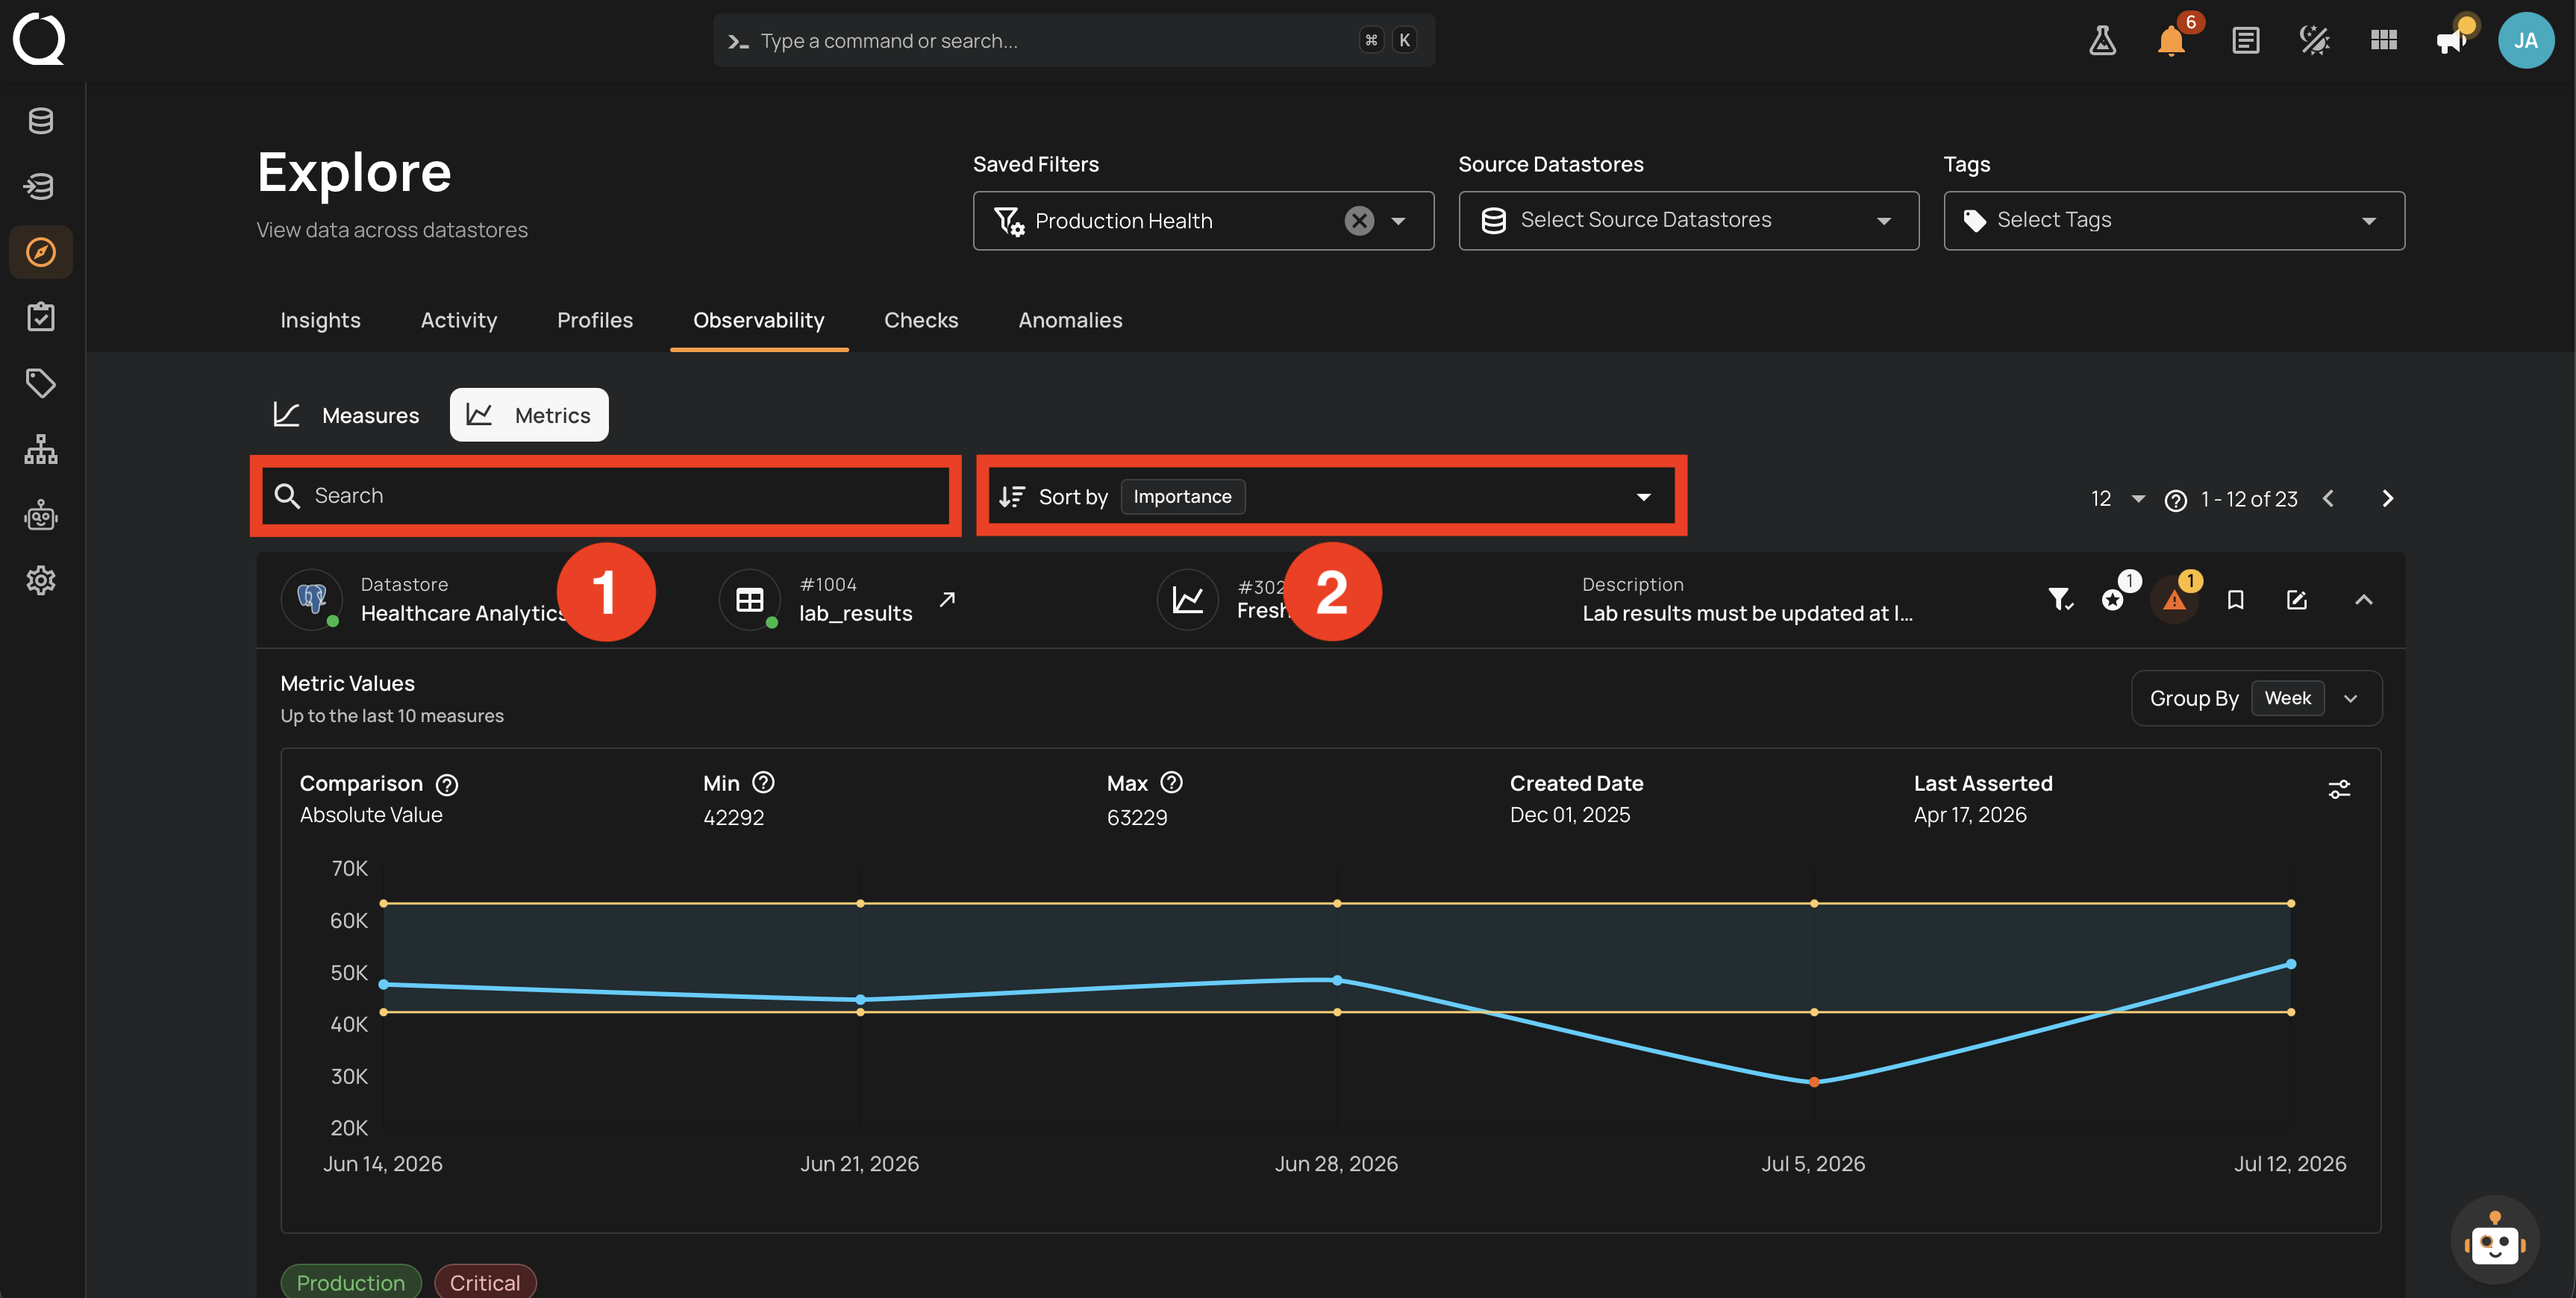
| # | Control | Purpose |
|---|---|---|
| 1 | Search | Match a metric check's description or identifier. |
| 2 | Sort by | Order by Importance, Created Date, or Active Anomalies. |
When you open the Observability tab from inside a single container (table or file), the listing is already scoped to that container, so several controls collapse into just the chart-timeframe knobs.
Measures tab
Only Report Date and Timeframe are exposed. Search and Filter menu are unnecessary because there is a single card on the page.
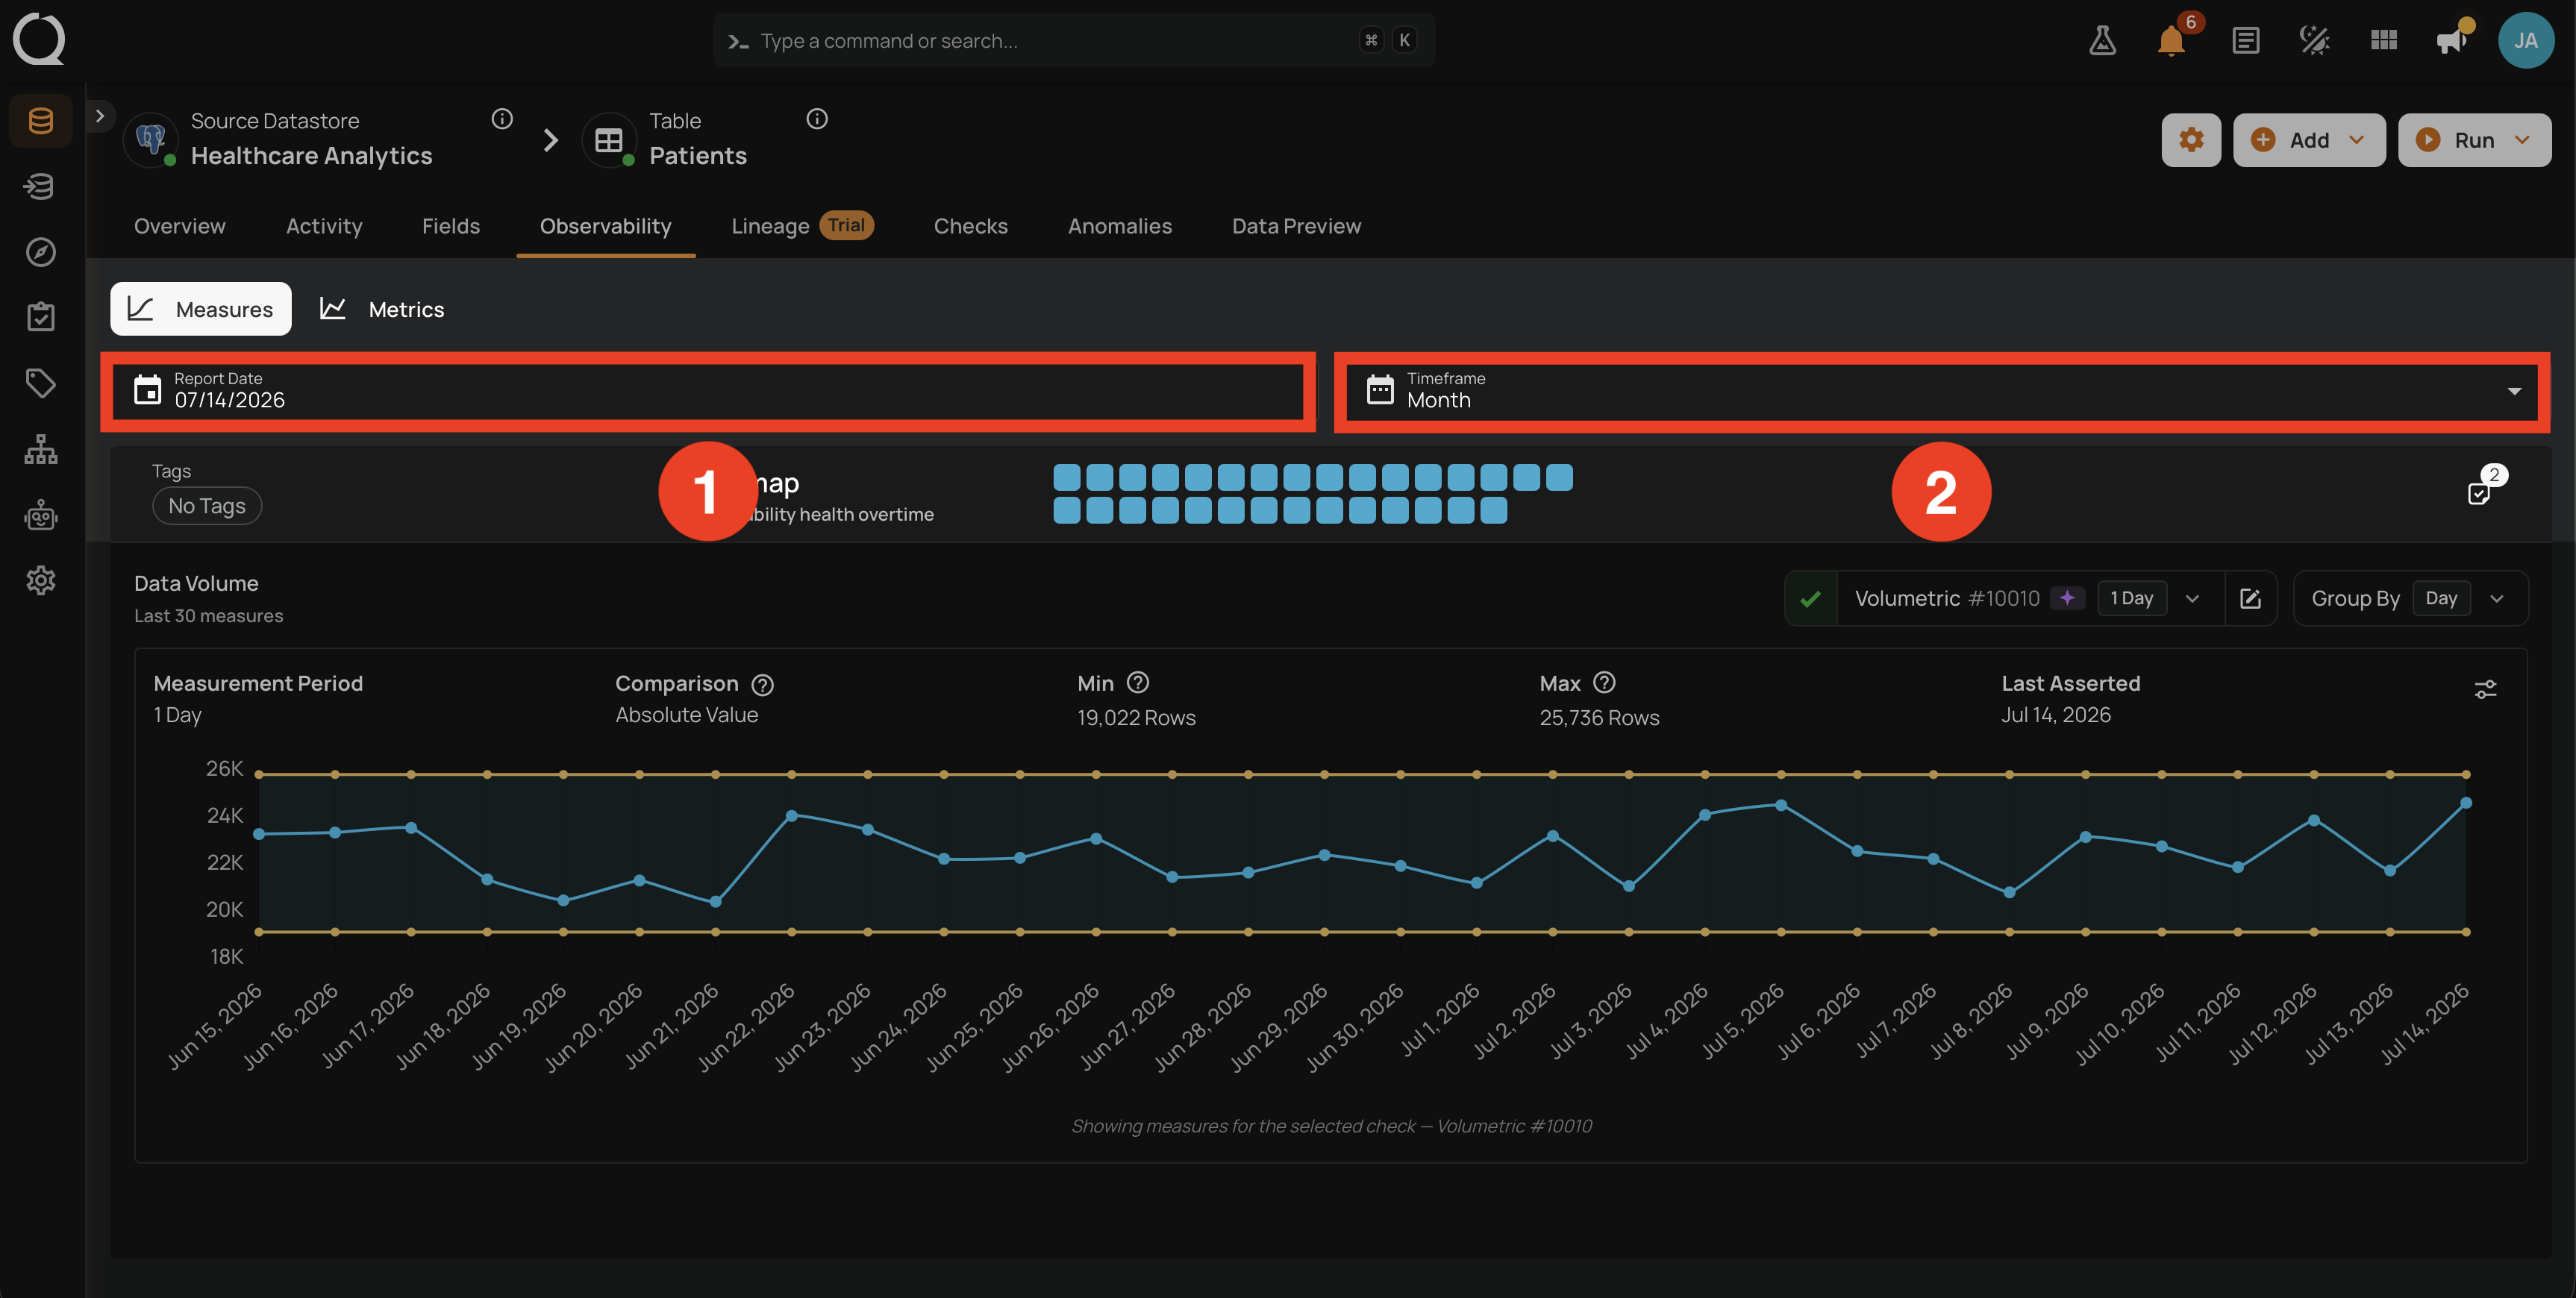
| # | Control | Purpose |
|---|---|---|
| 1 | Report Date | Pick the anchor date for the chart. The chart extends backward from this date. |
| 2 | Timeframe | Pick the window length (Week, Month, Quarter, Year). |
Metrics tab
Metric checks are per-field, so a single container can have several. Search, Sort By, and the Filter menu narrow the listing.
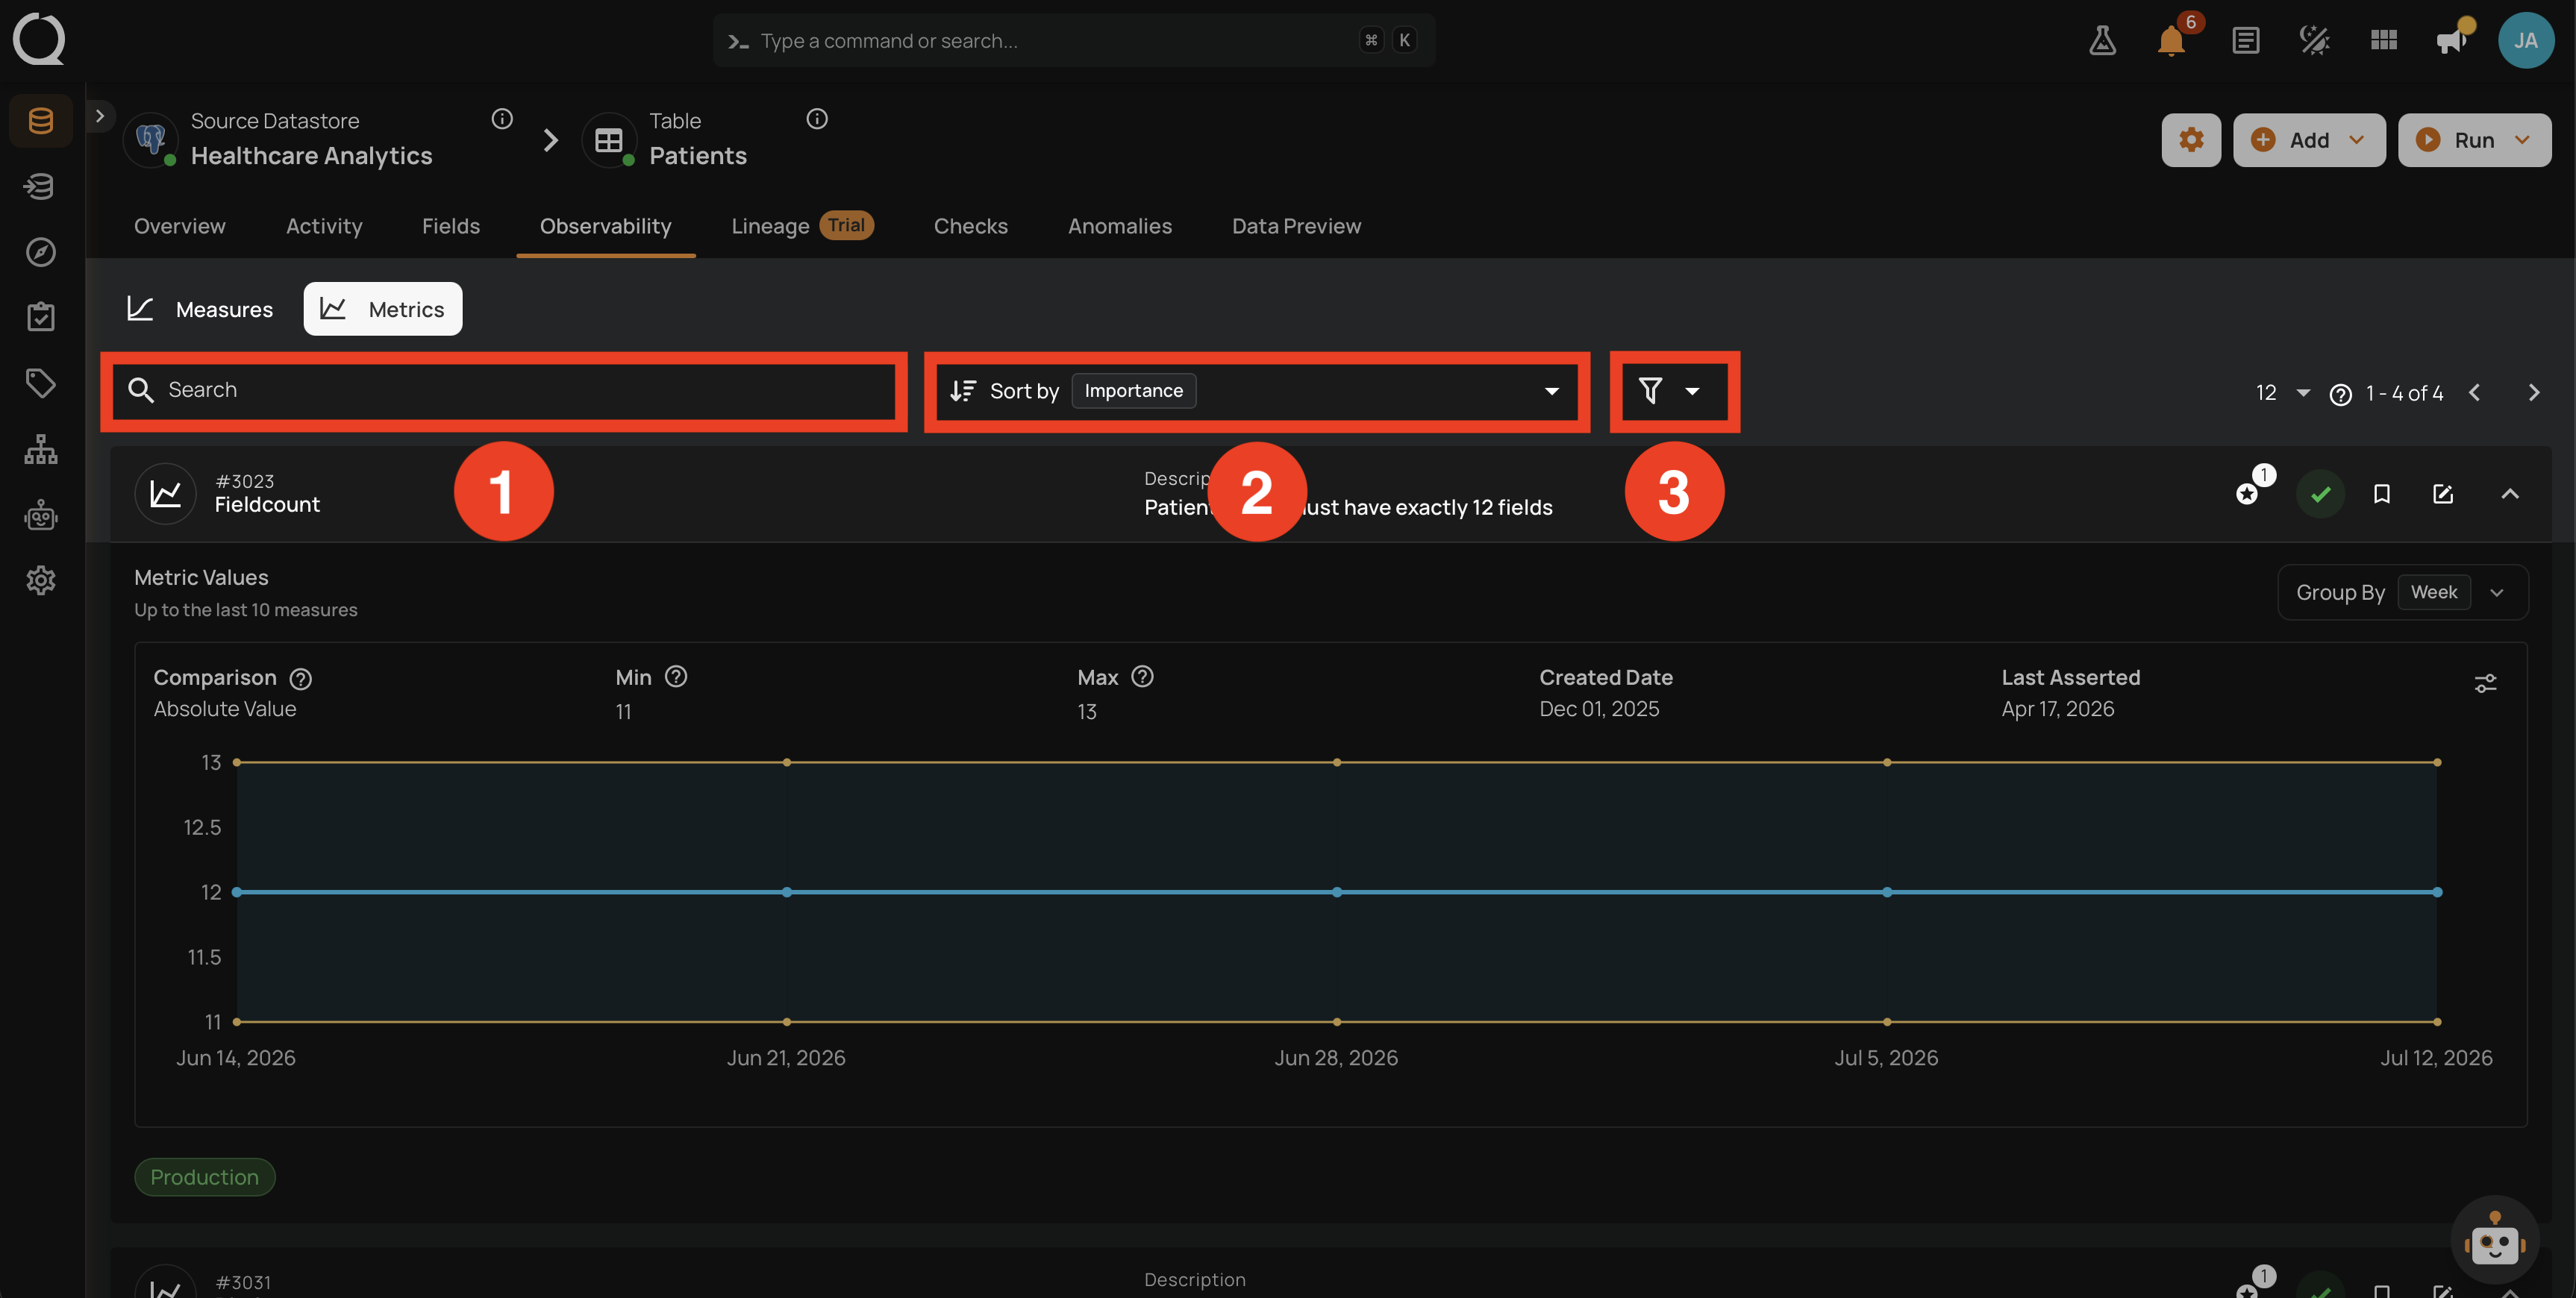
| # | Control | Purpose |
|---|---|---|
| 1 | Search | Match the check's description or identifier. |
| 2 | Sort by | Order by Importance, Created Date, or Active Anomalies. |
| 3 | Filter menu | Narrow by Tags or Field. |