DataHub
Beta Integration
The DataHub integration is currently in Beta. Functionality may evolve based on feedback. Please review the Known Limitations before getting started. If you encounter any issues or have suggestions, we'd love to hear from you — reach out to the Qualytics support team so we can make this integration even better.
Integrating DataHub with Qualytics brings your data quality insights directly into your data discovery workflows. Once connected, Qualytics keeps DataHub up to date with quality scores, anomaly details, and check results, while also pulling tags from DataHub back into Qualytics. Updates can happen automatically whenever key events occur, like completed scans or new anomalies, so your teams always have the latest quality context without extra manual work.
Let's get started 🚀
Prerequisites
Before you begin, make sure you have the following:
- Access to a DataHub instance (self-hosted or managed)
- An account with permissions to generate Personal Access Tokens in DataHub
- Network access between your DataHub instance and Qualytics
DataHub Setup
Before connecting to Qualytics, you'll need to generate a Personal Access Token in DataHub that Qualytics can use to communicate securely with the DataHub API.
Generate a Personal Access Token
Step 1: Sign in to your DataHub instance.
Step 2: Click on your profile icon in the top-right corner and select Settings.
Step 3: Navigate to the Access Tokens section and click Generate New Token.
Step 4: Fill in the details:
| Field | Value |
|---|---|
| Name | Qualytics Integration (or any name you prefer) |
| Description | Token for Qualytics data quality sync |
| Expiration | Choose an appropriate expiration period |
Step 5: Click Create and copy the generated token. Save it somewhere secure.
Important
The token is only shown once upon creation. Make sure to save it immediately. You'll need this token to complete the setup in Qualytics.
Qualytics Configuration
Navigation to Integration
Step 1: Log in to your Qualytics account and click the "Settings" button on the left side panel of the interface.
Step 2: Click on the Integrations tab.
Connect DataHub Integration
Step 1: Click on the Connect button next to DataHub.
A modal window titled "Add DataHub Integration" will appear, asking you to fill in your connection details.
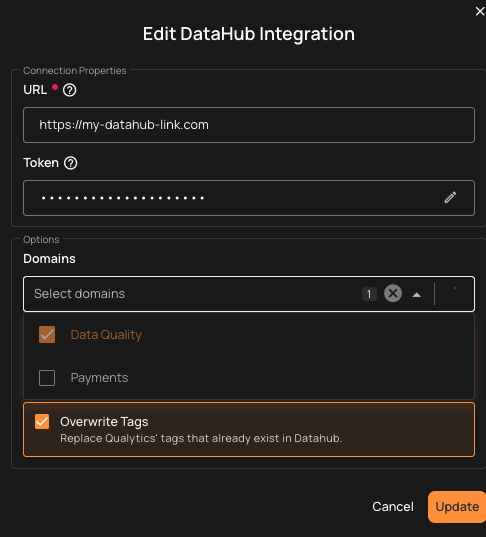
Step 2: Fill in the following connection details:
| REF. | Field | Required | Description |
|---|---|---|---|
| 1. | DataHub URL | Yes | Your DataHub web address (e.g., https://your-instance.datahub.com). Just the main URL, no extra paths needed. |
| 2. | Token | Yes | The Personal Access Token you generated in DataHub. This is stored securely (encrypted) in Qualytics. |
| 3. | Domains | No | Choose the DataHub domains that contain the assets you want to sync. Only assets within these domains will be matched with your Qualytics resources. If no domains are selected, all domains are searched. |
| 4. | Event Driven | No | When turned on, Qualytics automatically pushes updates to DataHub when scans complete, when anomalies are detected or resolved in Qualytics, and when checks or scans are deleted (default: on). For more details, see Event Driven. |
| 5. | Overwrite Tags | No | When turned on, existing Qualytics tags with the same name are converted into external tags managed by the DataHub integration. When turned off, the existing Qualytics tag is left unchanged and the DataHub tag is skipped (default: off). For more details, see Overwrite Tags. |
Step 3: Click the Create button.
Qualytics will verify the connection by testing your credentials against DataHub. If everything checks out, the integration will appear in your list as Connected.
Domain Filters
Domain filters control which DataHub assets Qualytics will look at during synchronization. Understanding how they work is key to getting the sync configured correctly.
How Domain Filters Work
In DataHub, assets (datasets, schemas, fields) are organized under Platforms and can be grouped by Domains. When you set up the DataHub integration in Qualytics, you select one or more domains. During sync, Qualytics will only search for matching assets within those selected domains — everything outside them is ignored.
When to Use Domain Filters
Use domain filters when you want to:
- Focus on specific areas — For example, if your DataHub instance catalogs many platforms but you only care about syncing quality data for your production databases, select just the domains that contain those datasets.
- Avoid noise — Filtering prevents Qualytics from trying to match assets in domains that are unrelated to your data quality workflows (e.g., staging or experimental datasets).
- Speed up sync — A narrower domain scope means fewer assets to search through, which makes the sync faster.
When to Remove or Broaden Domain Filters
Remove or expand your domain filter if:
- Nothing is syncing — This is the most common issue. If you selected a domain that has no datasets in it, Qualytics won't find any assets to match and the sync will complete with no results. Check your selected domains in DataHub and make sure they actually contain the assets you expect.
- Only some datastores are syncing — Your assets may be spread across multiple domains. Add the missing domains to your filter to pick up the rest.
- You're unsure which domains to pick — You can temporarily select all available domains to let Qualytics find every possible match, then narrow it down later once you know which domains contain your target assets.
Common Pitfall
If you select a domain that is empty or contains no data assets (datasets, schema fields), the sync will complete successfully but no resources will be matched or updated. Always verify that your selected domains contain the assets that correspond to your Qualytics datastores.
How to Change Your Domain Filter
Step 1: Go to Settings > Integrations and click the Edit button (pencil icon) on your DataHub integration.
Step 2: In the Domains field, add or remove domains as needed. You can search by domain name to find the right ones.
Step 3: Click Update, then run a manual sync to verify the updated filter is working as expected.
Finding the Right Domains
If you're not sure which DataHub domains contain your assets, open DataHub and browse your Domains and Platforms. Look for the domains that hold the datasets that match the datastores you've set up in Qualytics.
Synchronization
Once connected, you can sync data between Qualytics and DataHub in two directions:
- Pull brings information from DataHub into Qualytics (like tags)
- Push sends Qualytics quality results to DataHub (like scores and anomaly counts)
What Gets Synced
Pull (DataHub → Qualytics):
| What | Description |
|---|---|
| Tags | Tags on DataHub datasets are imported into Qualytics as external tags, keeping your governance labels visible in both platforms. |
Push (Qualytics → DataHub): Qualytics writes to three places on each matched asset.
| DataHub Tab / Location | What Qualytics Writes |
|---|---|
| Documentation / About | A markdown summary containing the Qualytics wordmark, a key/value listing of every quality dimension, and a "View in Qualytics" link. |
| Properties → Structured Properties | Typed fields for the overall Quality Score Total, 8 quality-dimension scores (Completeness, Coverage, Conformity, Consistency, Precision, Timeliness, Volumetrics, Accuracy), Active Anomalies, Active Checks, and the Qualytics URL. See Attributes Added to DataHub Assets for the full list. |
| Incidents tab | One DataHub Incident per container titled Qualytics: Active Anomalies, raised when active anomalies exist and resolved automatically when they are all archived. See DataHub Incidents. |
How Qualytics Matches Assets
During sync, Qualytics automatically matches your resources to the corresponding assets in DataHub based on their names:
| Your Qualytics Resource | Matches These DataHub Assets |
|---|---|
| Datastore | Container with subType Schema, disambiguated by parent database name |
| Container (table) | Dataset |
| Field (column) | SchemaField |
Matching is done by case-insensitive dotted-suffix comparison on the qualified name (database.schema.table.field or schema.table.field). The DataHub platform (BigQuery, Snowflake, etc.) is supplied as a filter on the search, not as a name segment. For datastores, Qualytics walks the DataHub parentContainers chain and matches the parent name against your datastore's database field, so schemas with the same name in different databases are resolved correctly.
Multiple schemas with the same name
If your DataHub instance has multiple schemas with the same name across different databases (for example, TPCH_SF1 in both DEVELOP_DB and ANALYTICS_DB), Qualytics matches the one whose parent database name matches your Qualytics datastore's database field (case-insensitive). If no parent matches, the datastore-level Documentation push is skipped, but tables and fields still sync normally.
Note
Currently, only JDBC datastores are supported for catalog sync. File-based (DFS) datastores are not yet included.
Manual Sync
You can trigger a sync at any time to pull the latest information from DataHub or push your quality results.
Step 1: Click the vertical ellipsis (three dots) next to the DataHub integration and select Sync from the dropdown.
Step 2: Choose what you'd like to sync:
- Pull DataHub Metadata - Brings tags and asset information from DataHub into Qualytics
- Push Qualytics Metadata - Sends quality scores, anomaly counts, check counts, and links to DataHub
You can select one or both options.
Step 3: Click the "Start" button.
Step 4: The sync process will begin. Qualytics goes through your datastores and matches their tables and columns to the corresponding DataHub datasets. Once complete, you can review the sync logs to see which assets were successfully matched.
Note
Pulling tags from DataHub requires a manual sync. Even with Event Driven turned on, tag imports only happen when you manually trigger a sync.
Cancel Sync
If a sync is taking longer than expected, you can stop it at any time.
Click the vertical ellipsis (three dots) next to the DataHub integration and select Cancel Sync. The process will stop gracefully after finishing the current datastore.
Metadata in DataHub
When Qualytics pushes quality results to DataHub, it writes a Qualytics-branded summary to the Documentation tab and a set of Structured Properties (DataHub's term) on the matched asset. These property definitions are created automatically during the first sync if they don't already exist.
Documentation Tab
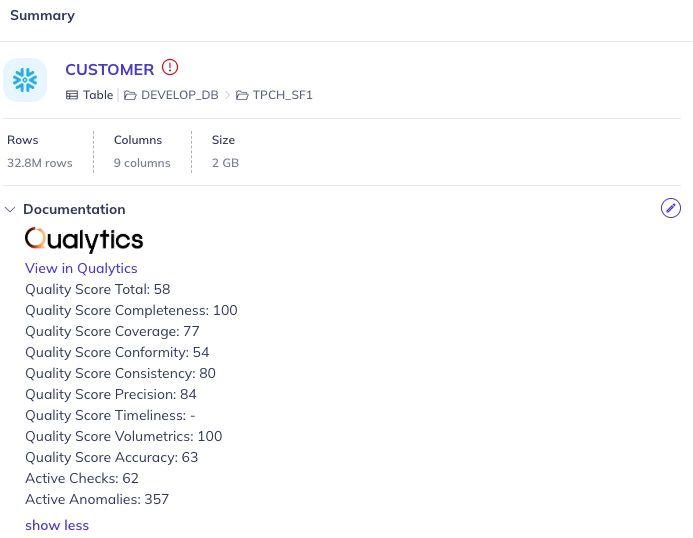
The Documentation tab on each matched asset shows the Qualytics wordmark, a View in Qualytics link back to the asset, and the current values of every quality dimension along with active checks and active anomalies.
Attributes Added to DataHub Assets
Each matched dataset and schema field gets the following values pushed by Qualytics. They appear in the Documentation tab (as shown above) and as typed fields under Properties → Structured Properties.
| Field | Description |
|---|---|
| View in Qualytics | A direct link back to the asset in Qualytics. |
| Quality Score Total | The overall data quality score (0-100). |
| Quality Score Completeness | Score for the Completeness dimension. |
| Quality Score Coverage | Score for the Coverage dimension. |
| Quality Score Conformity | Score for the Conformity dimension. |
| Quality Score Consistency | Score for the Consistency dimension. |
| Quality Score Precision | Score for the Precision dimension. |
| Quality Score Timeliness | Score for the Timeliness dimension. Displays - when no Timeliness checks are active. |
| Quality Score Volumetrics | Score for the Volumetrics dimension. |
| Quality Score Accuracy | Score for the Accuracy dimension. |
| Active Checks | Number of active quality checks monitoring the asset. |
| Active Anomalies | Number of active data quality issues detected on the asset. |
What Appears at Each Level
The surface differs by level: datastore-level pushes write Documentation only, while tables and columns get the full set of Structured Properties.
| Qualytics Level | DataHub Entity | Documentation Tab | Structured Properties | Incidents |
|---|---|---|---|---|
| Datastore (database + schema) | Container (subType Schema) |
✅ | ❌ | ❌ |
| Container (table) | Dataset | ✅ | ✅ | ✅ |
| Field (column) | SchemaField | ✅ (via the dataset's editable schema metadata) | ✅ | ❌ |
Structured Property definitions are scoped to DataHub's DATASET and SCHEMA_FIELD entity types only, which is why schema-level containers don't receive them. The Incidents surface is scoped to containers (tables) only.
DataHub Incidents
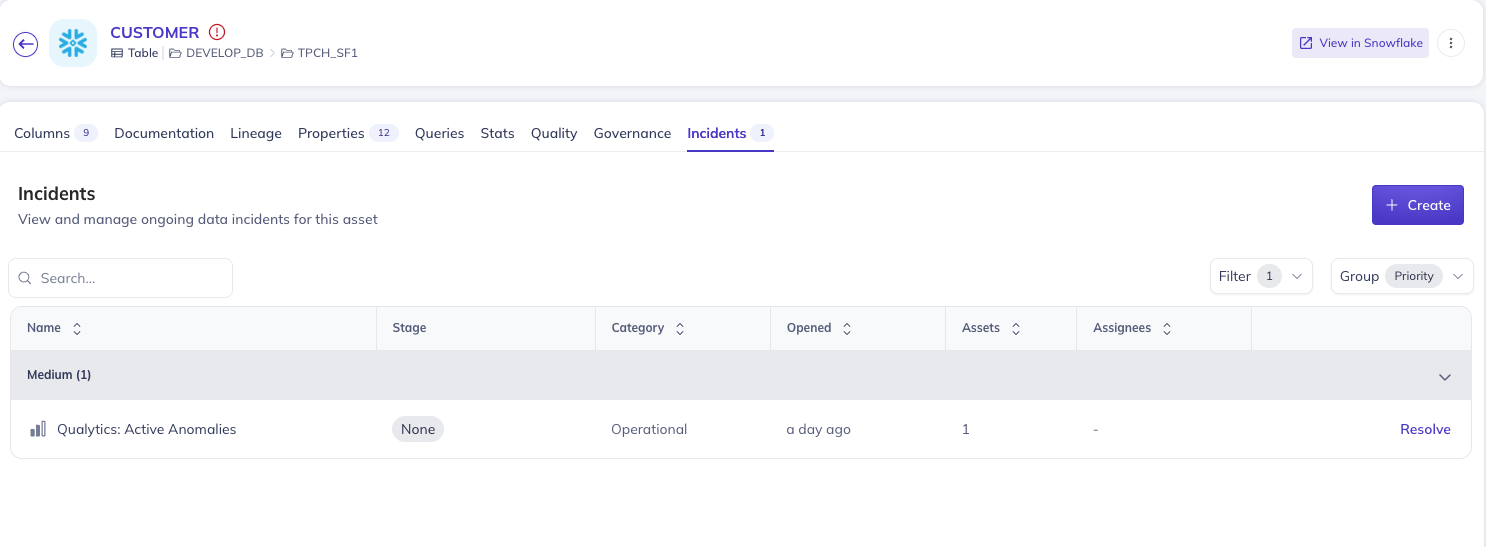
When Qualytics detects active anomalies on a container, the integration raises a DataHub Incident on the corresponding dataset. The incident appears under the dataset's Incidents tab in DataHub.
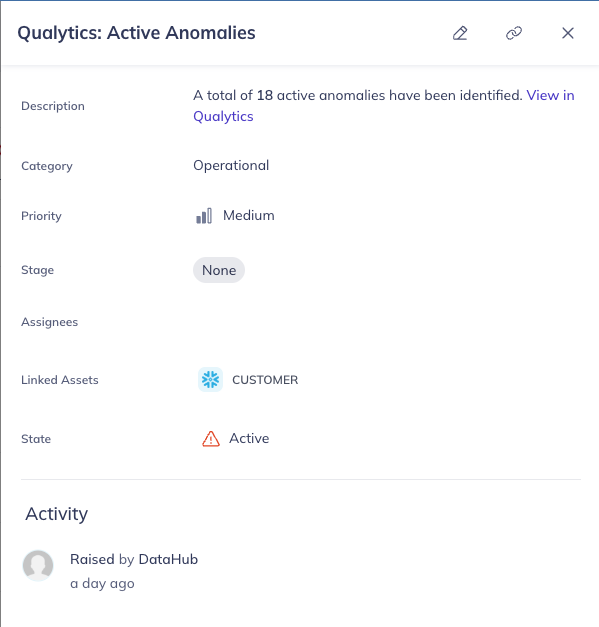
Opening the incident shows its description, category, priority, and current state, along with a View in Qualytics link in the description that jumps straight to the anomalies view.
| Field | Value |
|---|---|
| Title | Qualytics: Active Anomalies (fixed) |
| Description | Active anomaly count with a clickable View in Qualytics link to the anomalies view |
| Category | Operational |
| Priority | Medium |
| State | Active (until all anomalies are resolved in Qualytics) |
Lifecycle:
- The incident is raised the first time Qualytics pushes an active anomaly count greater than zero to the dataset.
- While anomalies remain active in Qualytics, subsequent pushes leave the existing incident alone (no churn).
- When all anomalies on the container are resolved or archived in Qualytics, the incident is automatically moved to Resolved within about 10 seconds (debounced).
- If new anomalies appear afterwards, a fresh incident is raised.
Manually-raised DataHub incidents on the same dataset are untouched. Qualytics only manages incidents whose title starts with Qualytics:.
When You Resolve Anomalies in Qualytics
Archiving or resolving anomalies in Qualytics automatically triggers a push to DataHub when Event Driven is on. The corresponding DataHub Incident transitions to Resolved within about 10 seconds. No manual sync is required.
External Tags
When you pull metadata from DataHub, any tags on DataHub datasets are imported into Qualytics as external tags. These are visually distinct from regular Qualytics tags, so you can easily tell which labels came from your data catalog. Hovering over an external tag in Qualytics shows the source integration.
How external tags work:
- Tags from DataHub are automatically linked to the matching Qualytics resource (datastore, table, or column)
- If a tag is removed from a DataHub dataset, it will also be removed from Qualytics on the next sync
- Tags that no longer exist in DataHub are automatically cleaned up
- External tags on tables do not automatically carry over to their columns
Tip
Use the Overwrite Tags setting to control what happens when both platforms have tags with the same name. When off, the existing Qualytics tag is kept and the DataHub tag is skipped. When on, the existing tag is converted into an external tag managed by DataHub. For more details, see Overwrite Tags.
Known Limitations
As a Beta integration, there are some limitations to be aware of:
| Limitation | Details |
|---|---|
| JDBC datastores only | Only JDBC datastores (e.g., PostgreSQL, Snowflake, BigQuery) are supported for sync. File-based (DFS) datastores are not yet included. |
| Push-only for event-driven sync | When Event Driven is turned on, Qualytics only pushes data to DataHub. Pulling tags from DataHub still requires a manual sync. |
| Name-based asset matching | Qualytics matches assets by case-insensitive dotted-suffix comparison on the qualified name (database.schema.table.field). If naming conventions differ between DataHub and your datastores, some assets may not match automatically. |
| No column-level tag pull for all catalogs | Tags are pulled at the datastore, table, and column level, but the depth of tag coverage depends on how your DataHub datasets are tagged. |
| Single sync at a time | Only one sync can run at a time per integration. If a sync is already in progress, you'll need to wait for it to finish or cancel it before starting a new one. |
| No custom attribute mapping | The set of values pushed to DataHub is fixed (Quality Score Total, 8 dimension scores, Active Checks, Active Anomalies, and the Qualytics URL). Custom attribute mapping is not yet supported. |
Info
We're actively improving the DataHub integration based on customer feedback. If you run into a limitation that impacts your workflow, please reach out to the Qualytics support team so we can prioritize it.
Troubleshooting
Common Issues
| Issue | Possible Cause | What to Do |
|---|---|---|
| Authentication Failed | Invalid or expired token | Double-check that the Personal Access Token is correct and has not expired. Generate a new token in DataHub if needed. |
| Sync Completes but Nothing Appears in DataHub | Wrong domains selected | Make sure the domains you selected actually contain the datasets that correspond to your Qualytics datastores. |
| Sync Failed | Connection issue | Confirm that your DataHub URL is correct and that Qualytics can reach it over the network. |
| Some Assets Not Updated | No matching assets found | Check that the dataset names in DataHub match the names used in your Qualytics datastores. |
| Structured Properties Not Showing in DataHub | Permission issue | Make sure the token has sufficient permissions to create Structured Property definitions and to apply them to datasets and schema fields. |
| Sync Takes Too Long | Too many assets in scope | Narrow your domain selection to focus on the most important assets. You can always cancel and retry with a smaller scope. |
Tip
You can view detailed sync logs by clicking on the DataHub integration card. The logs show a summary for each datastore, including how many tables, columns, and tags were synced, along with any errors.
Examples
Asset Matching Example
The following example shows how Qualytics maps a BigQuery project to DataHub assets during synchronization.
Source database: BigQuery datastore with project my-project, dataset analytics, table events, and column event_id.
During sync, Qualytics matches resources by walking the DataHub entity hierarchy:
| Qualytics Resource | Name | Matched DataHub Asset | DataHub Asset Type |
|---|---|---|---|
| Datastore | my-project.analytics |
Schema container analytics whose parent container is my-project |
Container (subType Schema) |
| Container | events |
events |
Dataset |
| Field | event_id |
event_id |
SchemaField |
The DataHub platform (bigquery) is supplied as a search filter, not as a name segment. Matching itself is a case-insensitive dotted-suffix comparison on the qualified name within the selected domains.
End-to-End Sync Scenario
This example walks through a complete synchronization workflow between Qualytics and DataHub.
Step 1: Connect the integration
Set up the DataHub integration with your Personal Access Token and select the relevant domains (e.g., the "Analytics" domain containing your production datasets).
Step 2: Run a manual pull sync
Trigger a pull sync from DataHub. Qualytics scans the selected domains and matches DataHub datasets to your datastores. Tags assigned to DataHub datasets (e.g., PII, Core Dataset) appear in Qualytics as external tags on the matched datastores, tables, and columns.
Step 3: Run a scan in Qualytics
Execute a scan operation on your datastores. Qualytics evaluates your quality checks and generates quality scores, anomaly counts, and check counts for each table and column.
Step 4: Run a push sync
Trigger a push sync (or let Event Driven handle it automatically). Qualytics writes to three surfaces on each matched DataHub asset:
- Documentation tab — a Qualytics-branded summary with a View in Qualytics link, the overall Quality Score Total, all 8 dimension scores, Active Checks, and Active Anomalies.
- Properties → Structured Properties — the same values as typed fields on the matched dataset and its schema fields.
- Incidents tab — a
Qualytics: Active Anomaliesincident is raised on the container when the active anomaly count is greater than zero, and resolved automatically when all anomalies are archived in Qualytics.
See What Gets Synced for the full surface breakdown and DataHub Incidents for the incident lifecycle.
Step 5: View results in DataHub
In DataHub, navigate to the matched dataset (e.g., events):
- The Documentation tab shows the Qualytics-branded summary with the View in Qualytics link, the Quality Score Total, all 8 dimension scores, and the Active Checks / Active Anomalies counts.
- The Properties → Structured Properties sidebar shows the same values as typed fields.
- If active anomalies exist, the Incidents tab shows an open
Qualytics: Active Anomaliesincident. Once you archive the anomalies in Qualytics, the incident moves to Resolved automatically.