Scan: Failure
Failure operations stopped because of a fatal error and did not produce a complete result set. Any partial results captured before the failure are still visible; the Logs section on the detail page explains the cause. The Status badge shows the red Failure state. Action buttons available: Results, Resume (when applicable), Rerun, Delete.
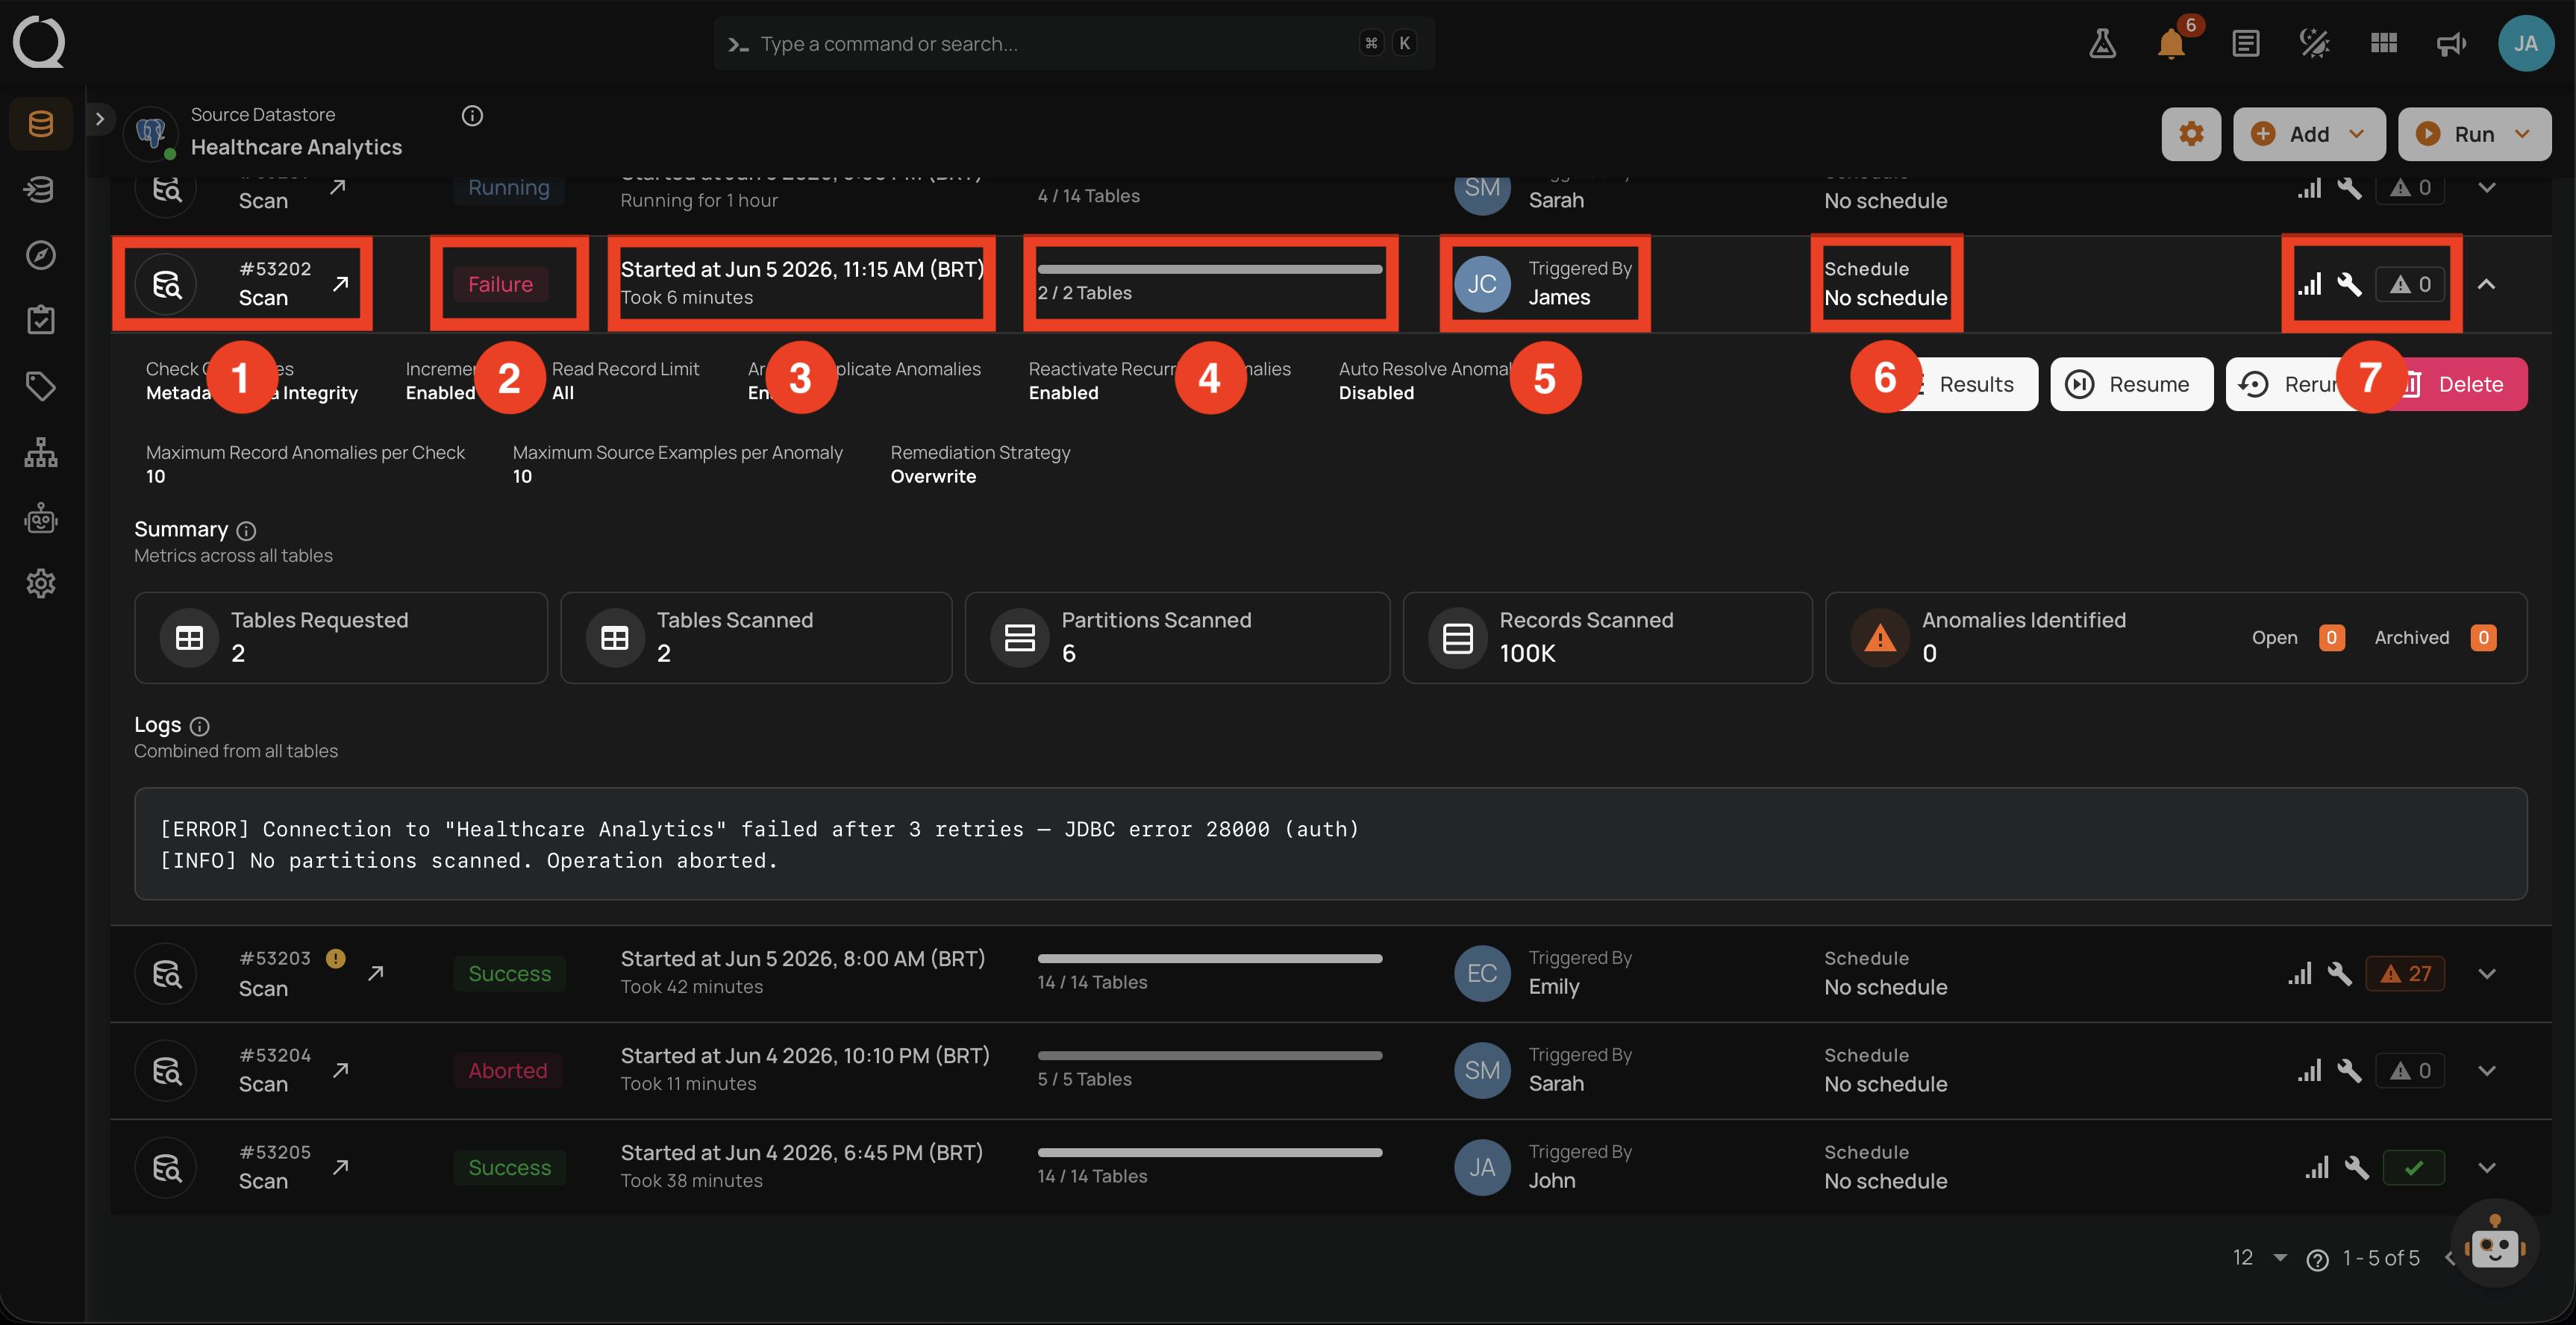
Expanded row in the operations list
Header of the operation
| No. | Element | What it shows |
|---|---|---|
| 1 | Operation ID and type | The unique identifier (for example #53201) and the operation type (Scan). The icon next to the ID links to the dedicated Overview of the operation. |
| 2 | Status badge | The red Failure badge indicating the operation stopped because of a fatal error. |
| 3 | Time info | Started At (for example Started at Jun 5 2026, 11:15 AM (BRT)) and Duration (for example Took 6 minutes). |
| 4 | Progress | Containers processed against the total requested (typically 0 / 14 Tables for early failures). |
| 5 | Triggered by | The user (avatar and name) who launched the operation, or the schedule that triggered it. |
| 6 | Schedule | The named schedule if recurring, otherwise No schedule. |
| 7 | Quick stats icons | A cluster of small status icons on the right of the row. Each icon shows a tooltip on hover summarizing configuration and result counters at a glance. See the Right-side icons (No. 7) in detail breakdown below this table. Not the row action buttons. |
The red badge is the trigger to open the Logs: a Failure operation always has a cause recorded in the Logs block on the detail page.
Right-side icons (No. 7) in detail
For this Failure operation the cluster shows the following icons, left to right:
| Icon | Tooltip | What this screenshot shows |
|---|---|---|
| Incremental Field | Filled, indicating the Incremental read strategy was Enabled for this run. | |
| Remediation Strategy | Filled, indicating a remediation strategy is set (Overwrite in this run). |
|
| Anomalies Identified | Counter pill; for Failure scans this is typically zero because the operation stopped before reading records. Hovering surfaces the breakdown into Open and Archived. |
The Anomalies Auto-Resolved indicator () is not shown for this run because no anomalies were resolved before the failure (and Auto-Resolve only applies to Full scans).
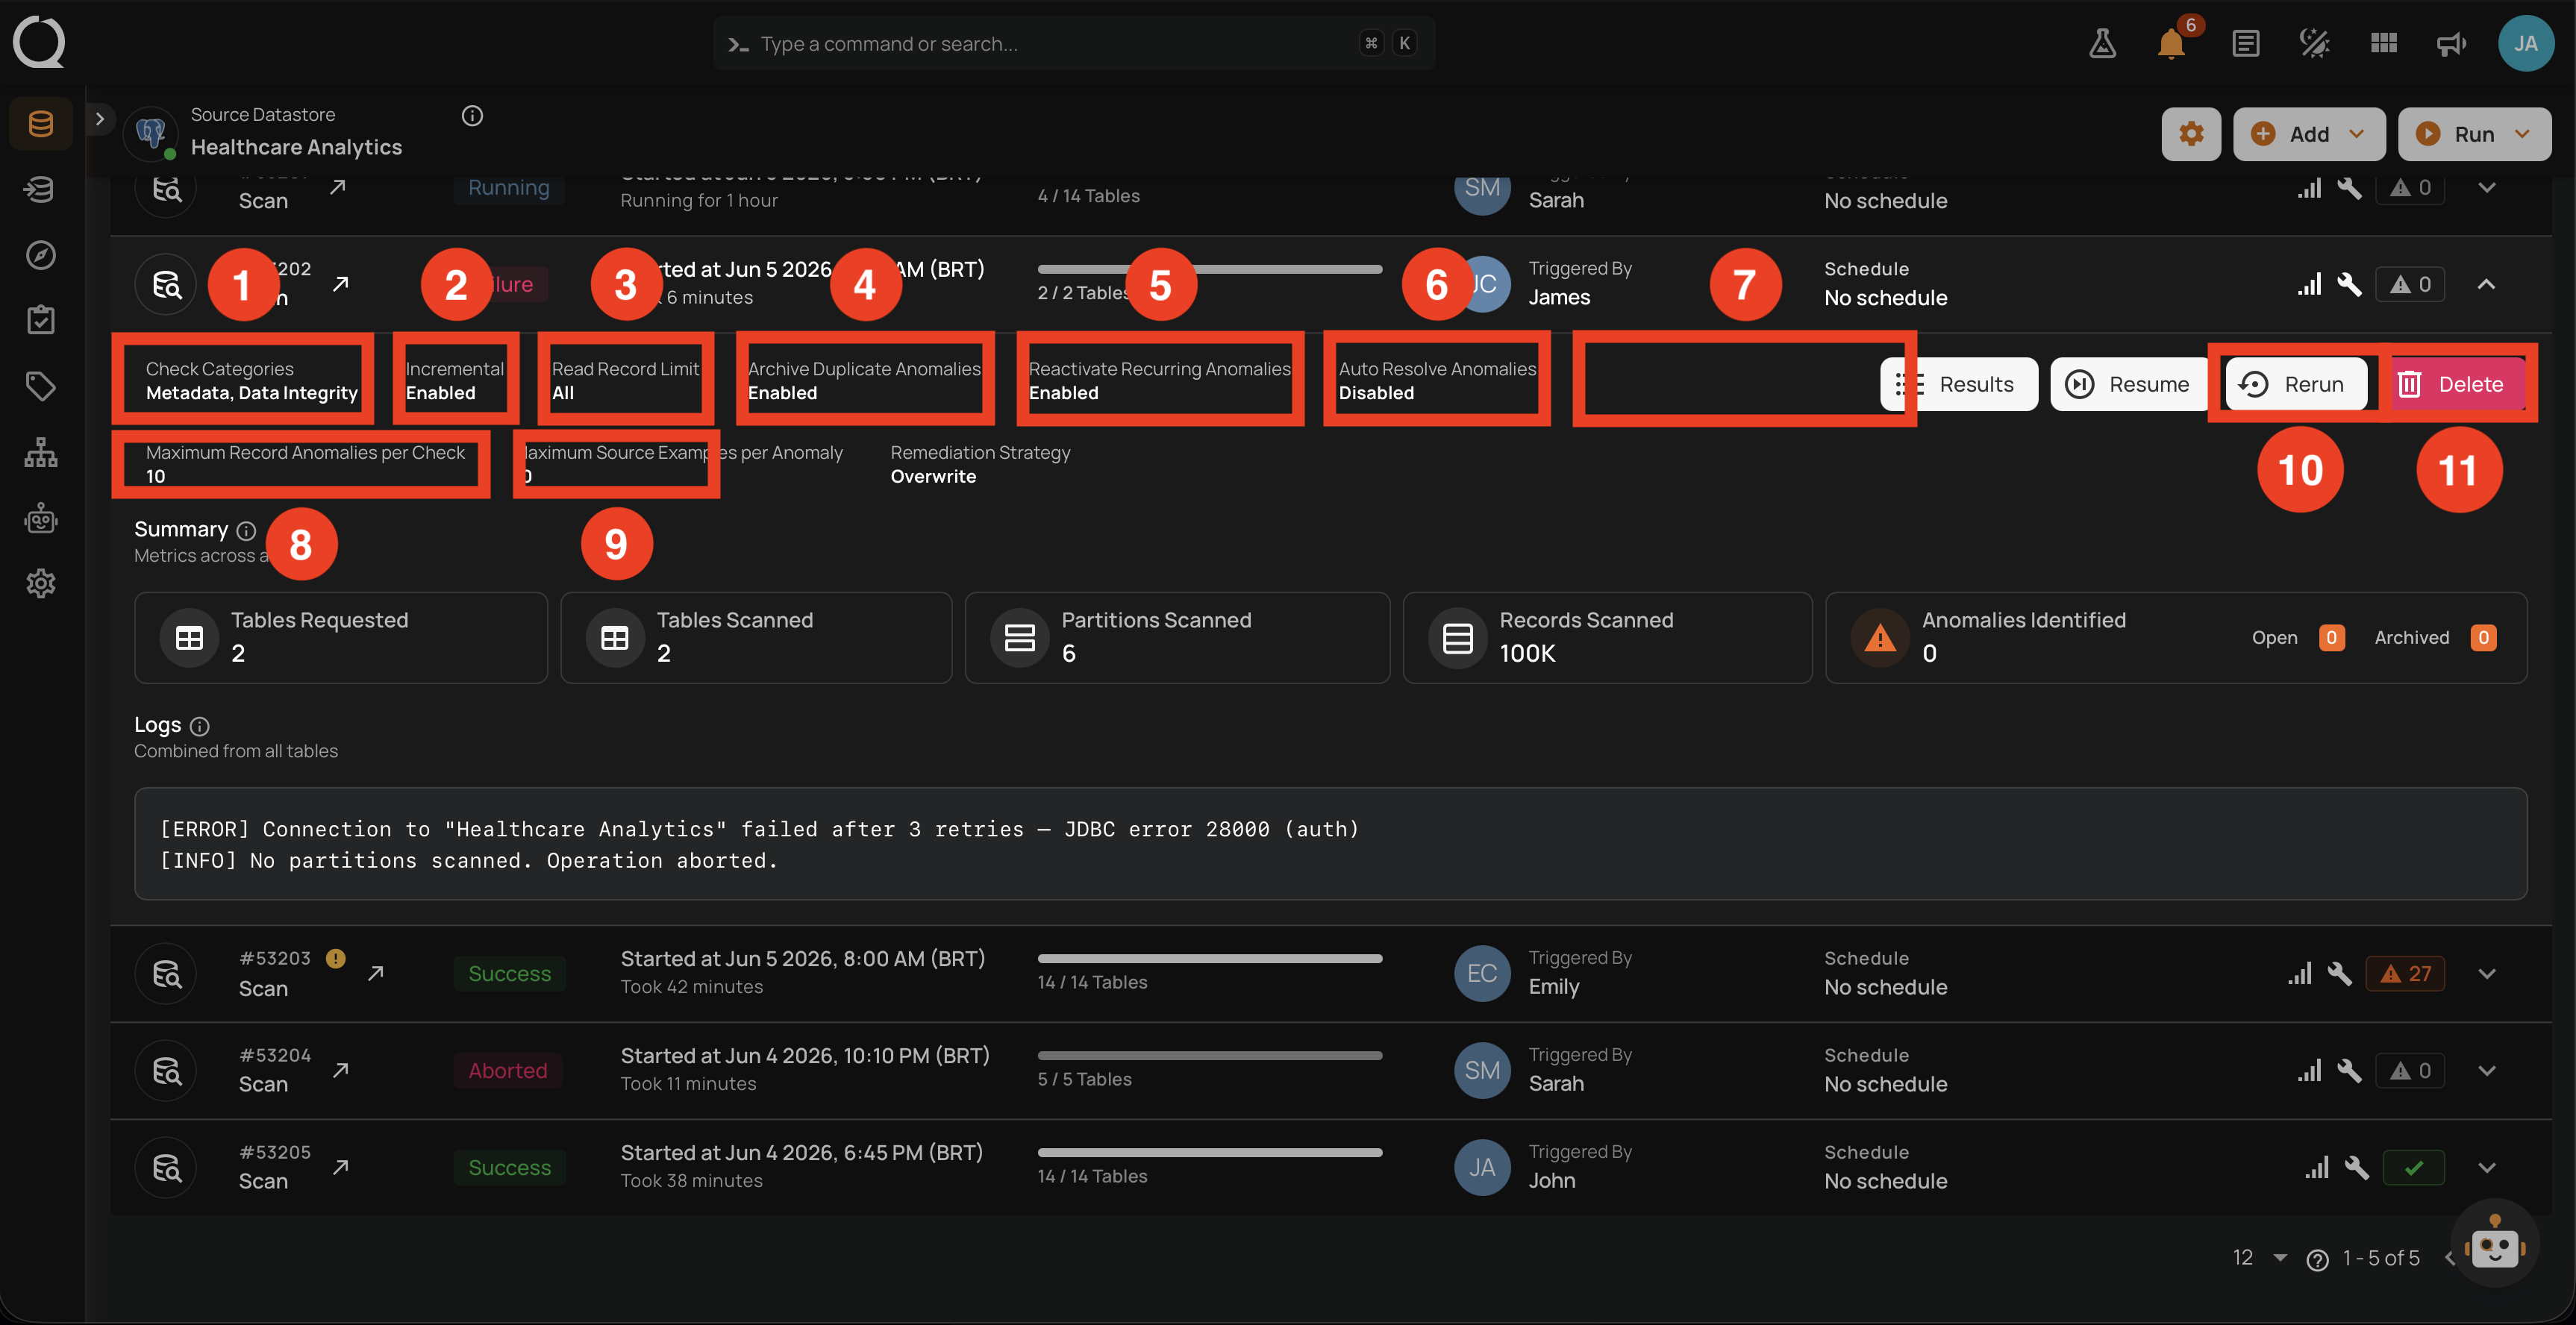
Details of the operation
Expanding the row reveals the Settings used for the run (read-only) and the inline action buttons (Results, Resume (when supported), Rerun, Delete).
| No. | Setting | What it shows |
|---|---|---|
| 1 | Check Categories | Which categories were configured. |
| 2 | Incremental | Read strategy configured (Enabled/Disabled). |
| 3 | Read Record Limit | Per-container record cap (All if uncapped). |
| 4 | Archive Duplicate Anomalies | Setting from Step 4 (Enabled/Disabled). |
| 5 | Reactivate Recurring Anomalies | Setting from Step 4. |
| 6 | Auto Resolve Anomalies | Setting from Step 4 (Full scans only). |
| 7 | Maximum Record Anomalies per Check | The rollup threshold configured. |
| 8 | Maximum Source Examples per Anomaly | Source examples cap configured. |
| 9 | Remediation Strategy | The remediation strategy configured. |
| 10 | Results | Opens the Scan Results modal (often empty for early failures). |
| 11 | Rerun | Replays the operation with the same configuration after the root cause is fixed. |
| 12 | Delete | Removes the operation record from the Activity list. Anomalies and other downstream artifacts produced by the Run are preserved. |
Resume on recoverable failures
When the Run can be picked up from where it stopped (for example, a transient connection error), a Resume button also appears alongside Rerun and Delete. Resume is hidden when the failure is not resumable. See Available Actions for the full rules.
For Failure operations, the typical workflow is: review the Logs (in the Timeline of the detail page), fix the underlying problem (credentials, connectivity, schema), then click Rerun.
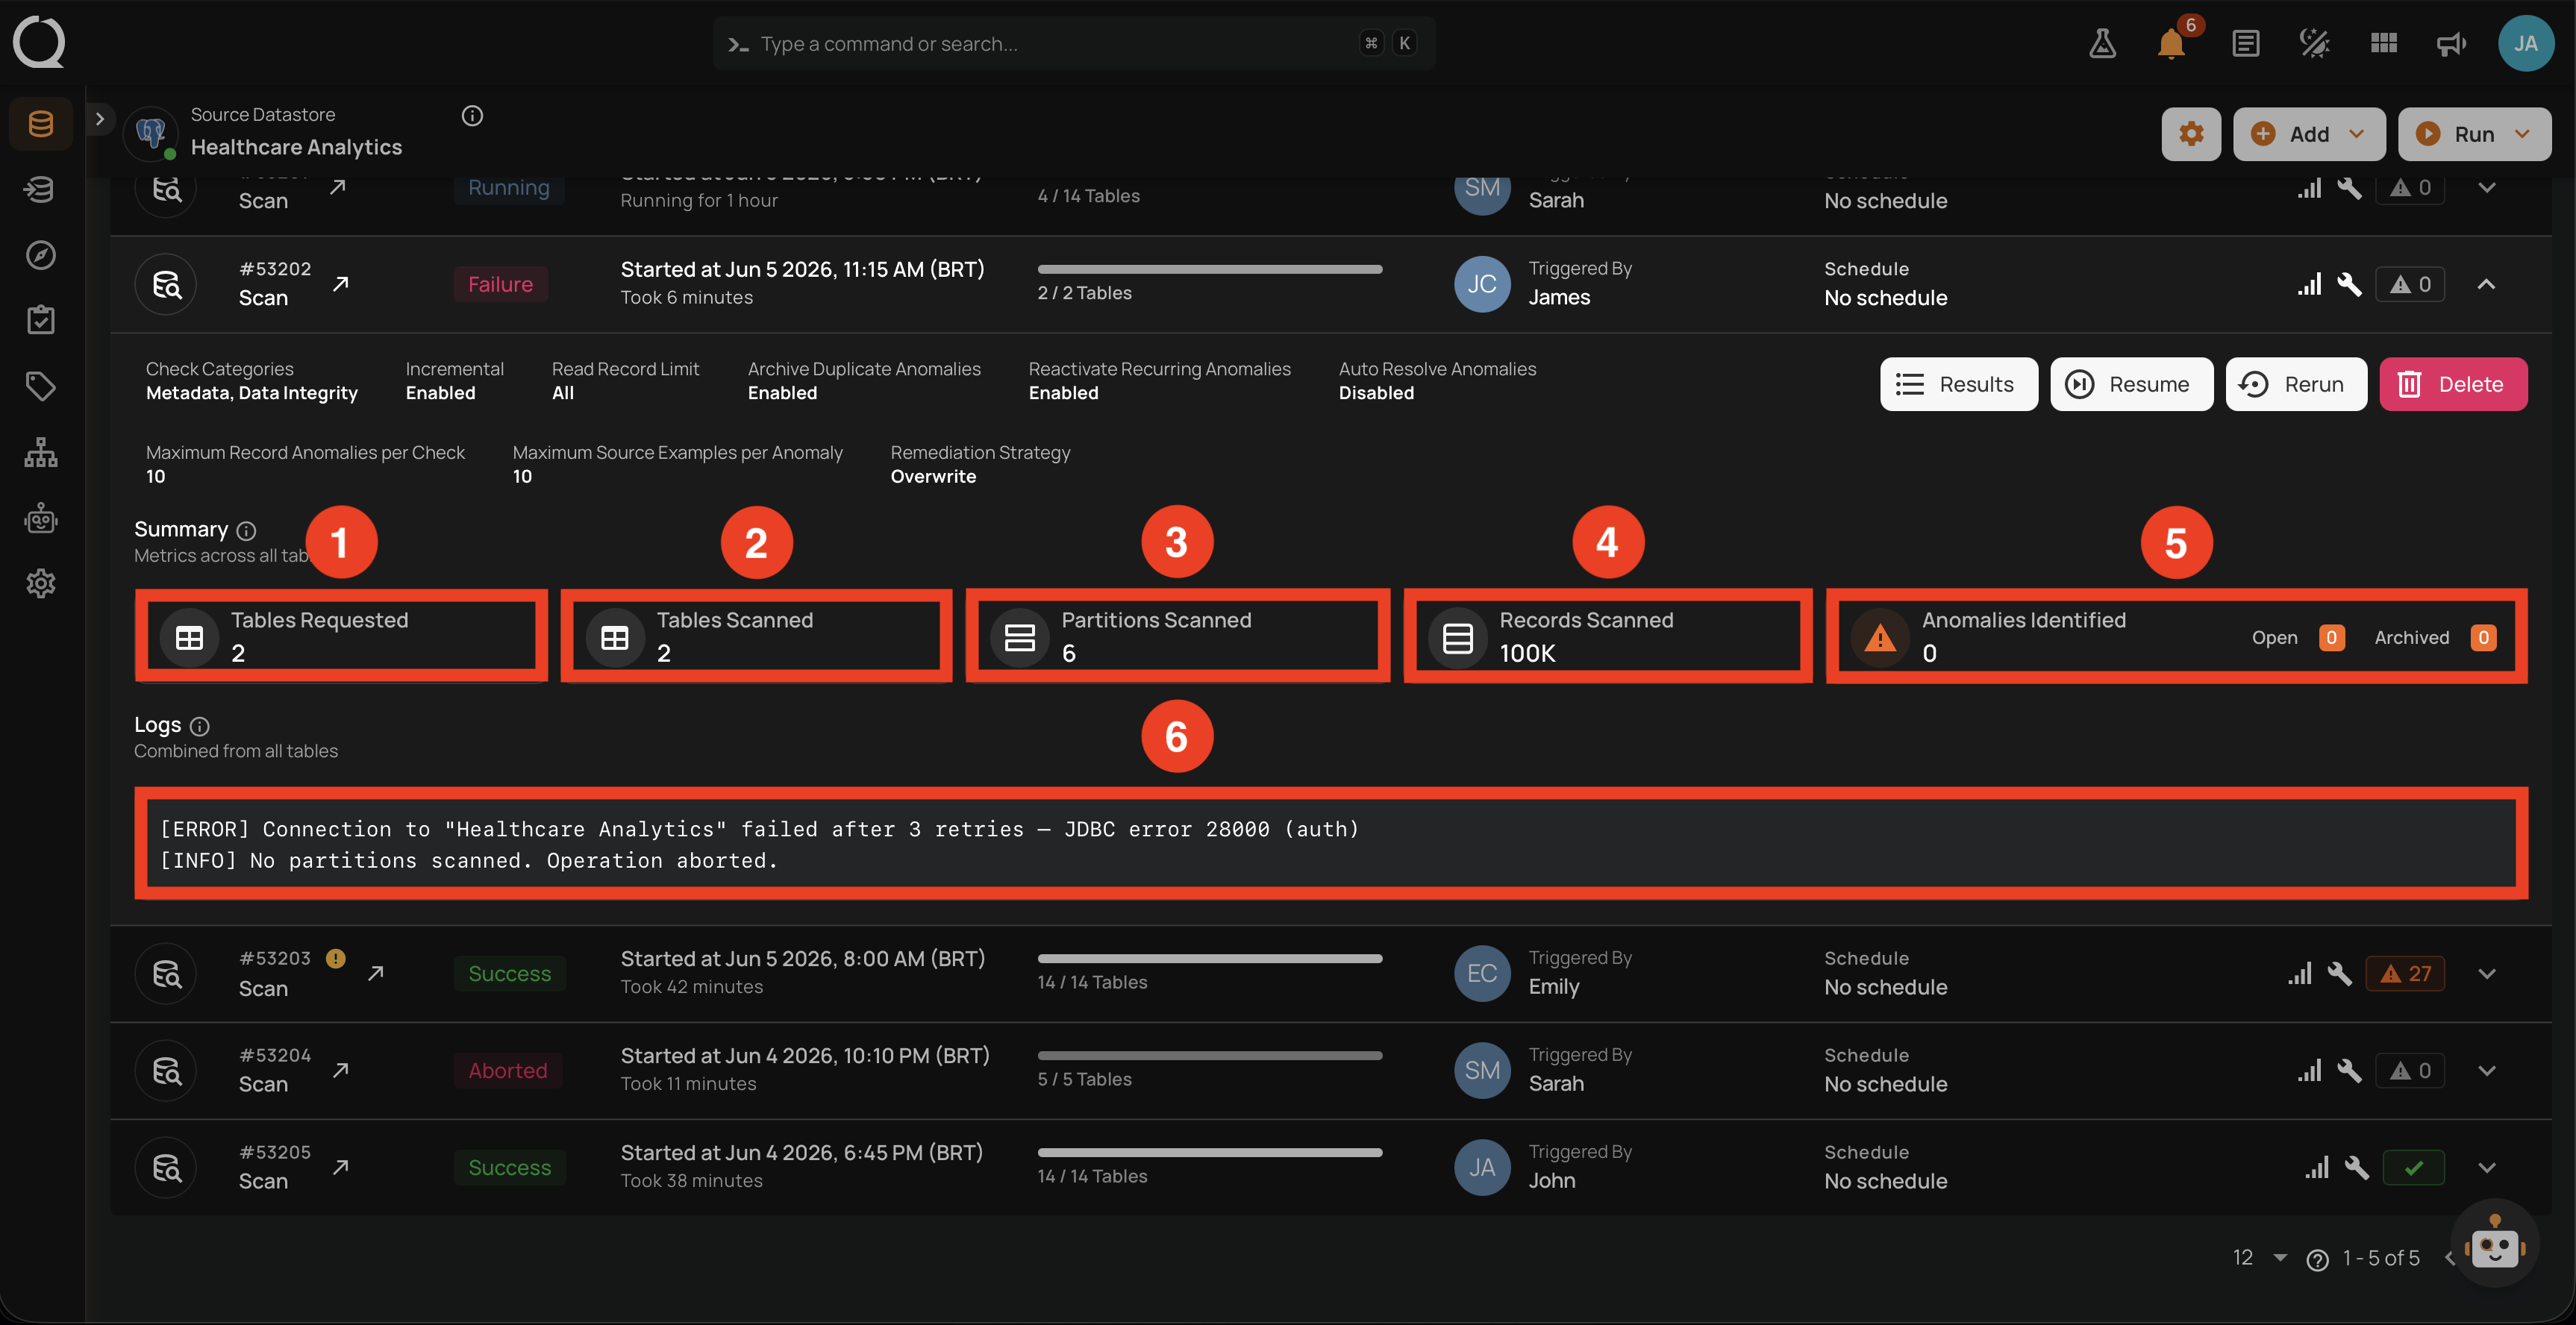
Summary
The Summary section reports the headline metrics for the run.
| No. | Element | What it shows |
|---|---|---|
| 1 | Tables Requested | Total containers targeted (full requested list, unchanged by the failure). |
| 2 | Tables Scanned | How many containers were actually scanned before the failure (often 0 for early failures). |
| 3 | Partitions Scanned | Total partitions read before the failure. |
| 4 | Records Scanned | Total records processed before the failure. |
| 5 | Anomalies Identified | Anomalies detected before the failure (rarely meaningful for fatal failures). |
For Failure scans the counters reflect only what was captured before the fatal error; in many cases the operation failed before reading any records, in which case all counters read 0.
Operation detail page
Clicking the row opens the dedicated operation detail page, which has two top-level tabs: Overview and Results. The Overview tab presents the operation's properties, settings, partial metrics, log entries, and chronological timeline. The Results tab drills into the containers (if any) processed before the fatal error.
Overview tab
The Overview tab opens with a snapshot of the run, organized into five blocks: Operation, Settings, Summary, Logs, and Timeline.
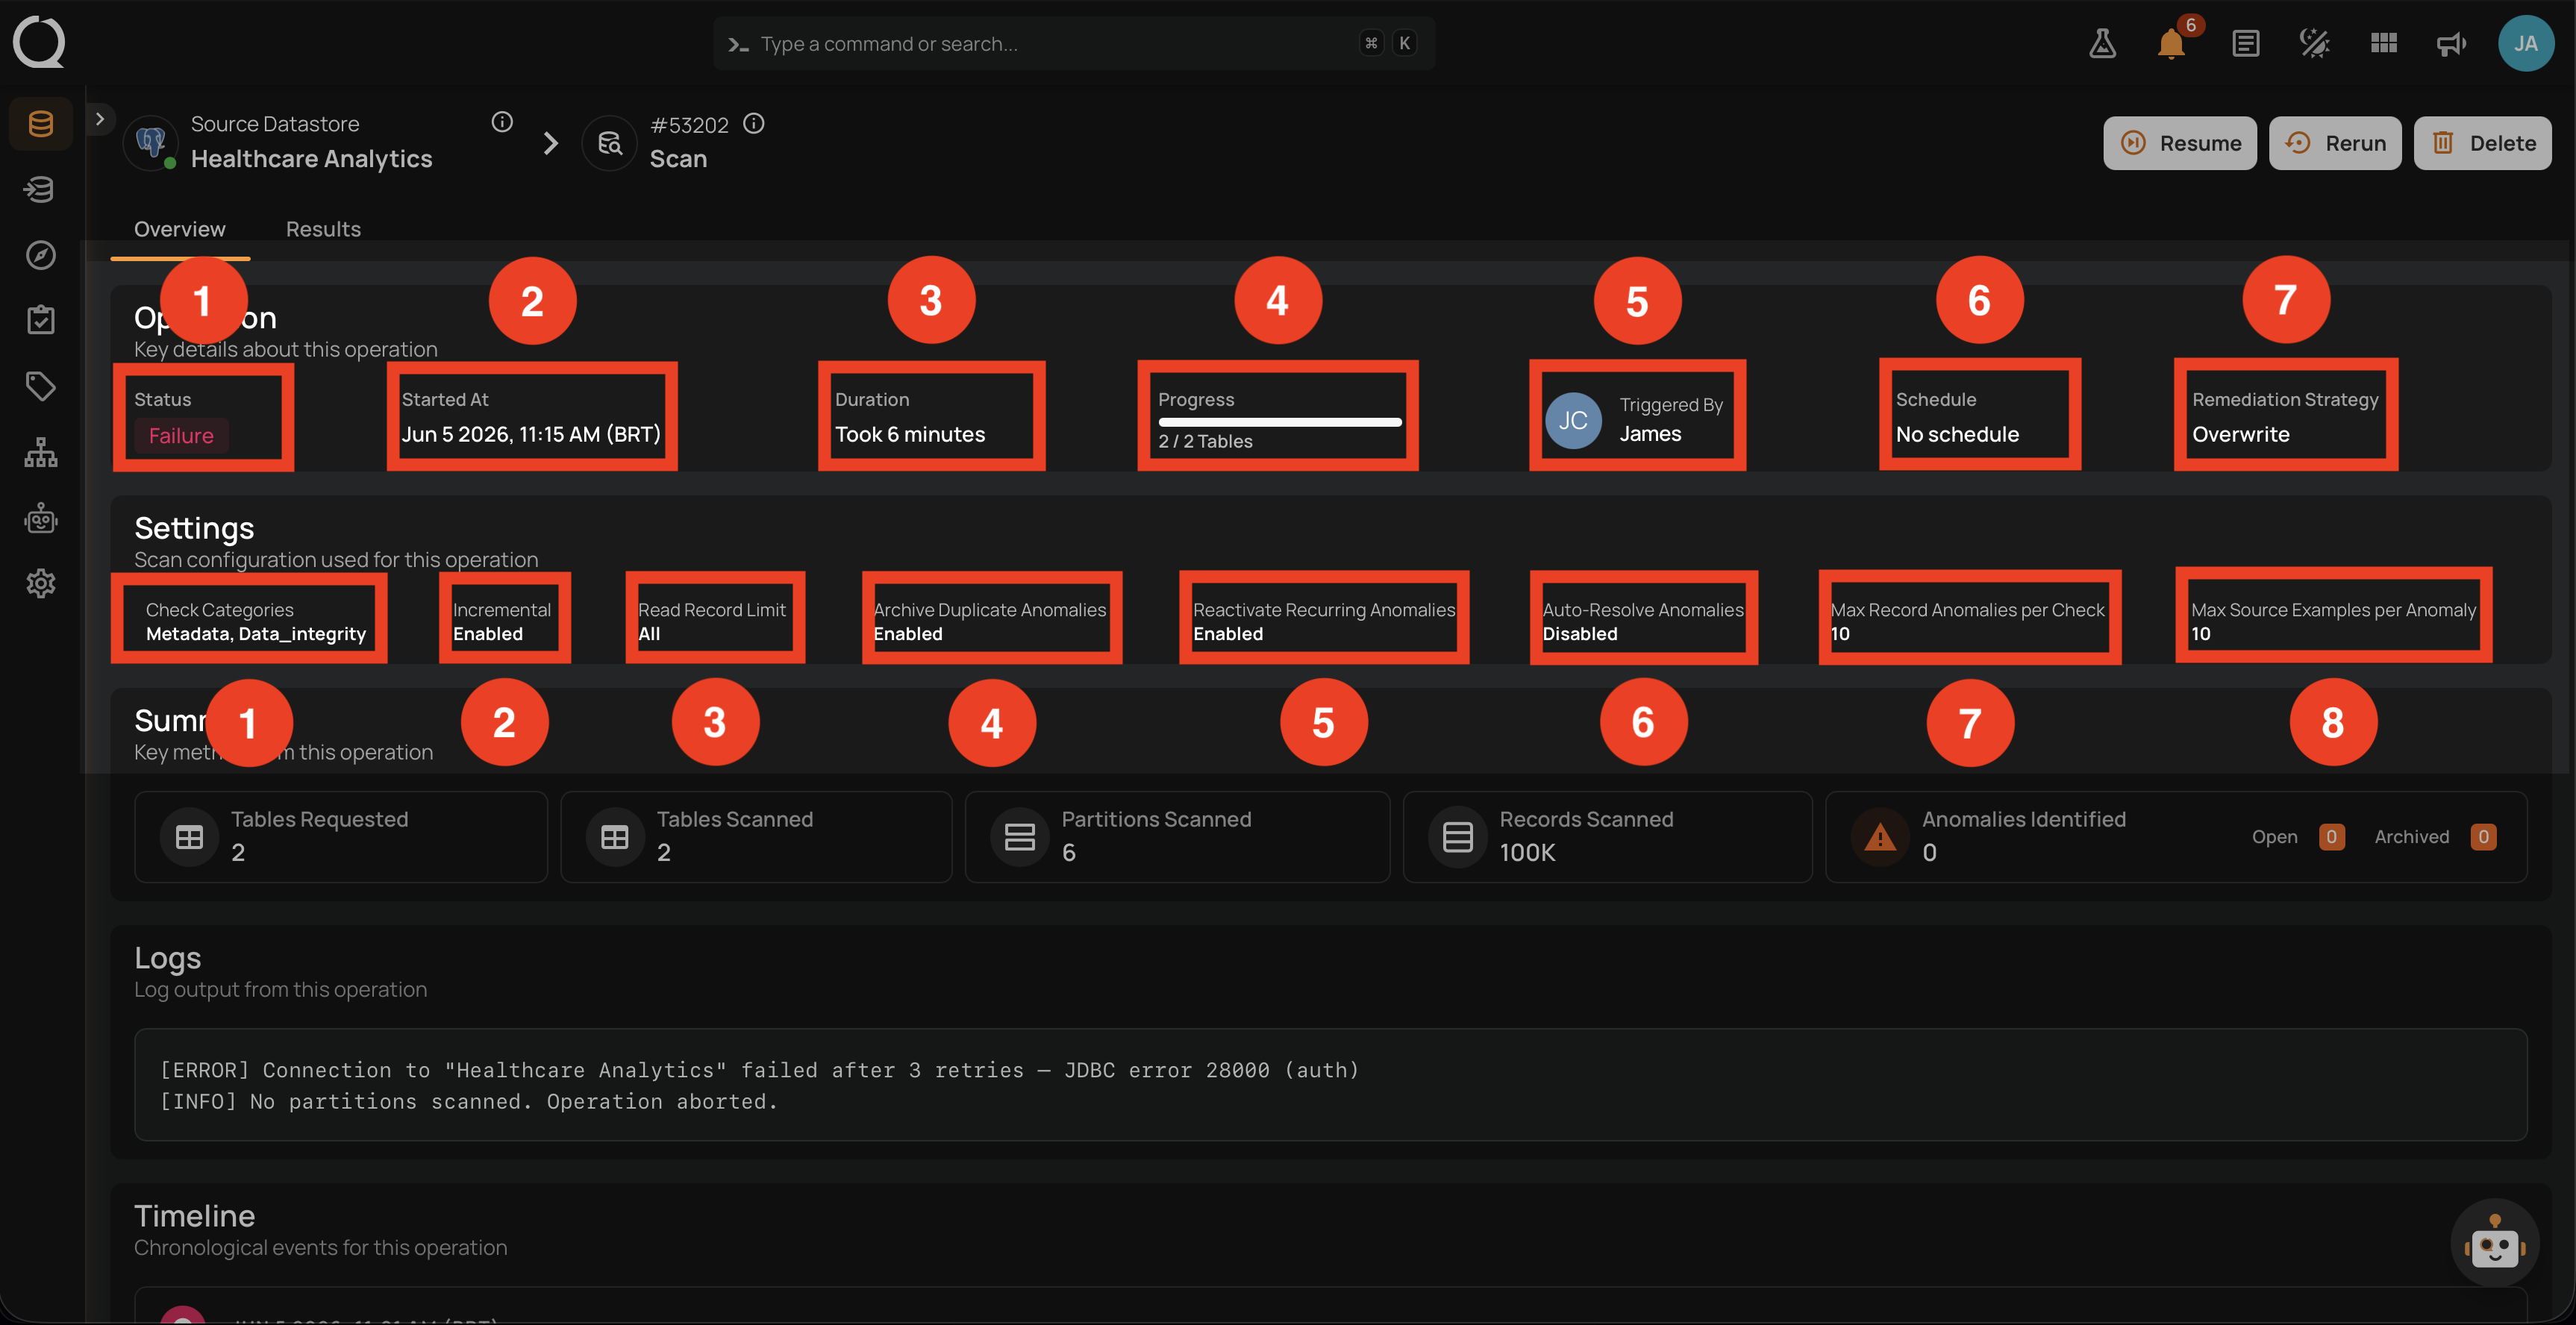
Operation block
The Operation block at the top carries the properties that summarize the run identity and outcome up to the failure.
| No. | Element | What it shows |
|---|---|---|
| 1 | Status | The state badge (Failure, red). |
| 2 | Started At | Exact start timestamp. |
| 3 | Duration | How long the run lasted before the failure. |
| 4 | Progress | Containers processed against total requested (often 0 of N). |
| 5 | Triggered By | User or schedule. |
| 6 | Schedule | The named schedule (or No schedule). |
| 7 | Remediation Strategy | Effective remediation strategy for the run. |
Settings block
The Settings block lists the scan settings used for the run (same fields as the row's Details section, minus the action buttons).
| No. | Setting | What it shows |
|---|---|---|
| 1 | Check Categories | Categories selected in Step 2. |
| 2 | Incremental | Whether Incremental was the read strategy. |
| 3 | Read Record Limit | Per-container record cap. |
| 4 | Archive Duplicate Anomalies | Setting from Step 4. |
| 5 | Reactivate Recurring Anomalies | Setting from Step 4. |
| 6 | Auto-Resolve Anomalies | Setting from Step 4 (Full scans only). |
| 7 | Max Record Anomalies per Check | Rollup threshold configured. |
| 8 | Max Source Examples per Anomaly | Source examples cap configured. |
Together, the Operation and Settings blocks act as the canonical "what happened" snapshot of the run. If the operation looks wrong, this is the first place to check the inputs.
Summary block
Scrolling down on the Overview tab shows the Summary block, which repeats the row's metrics. The screenshot below covers Summary, Logs, and Timeline in a single view.
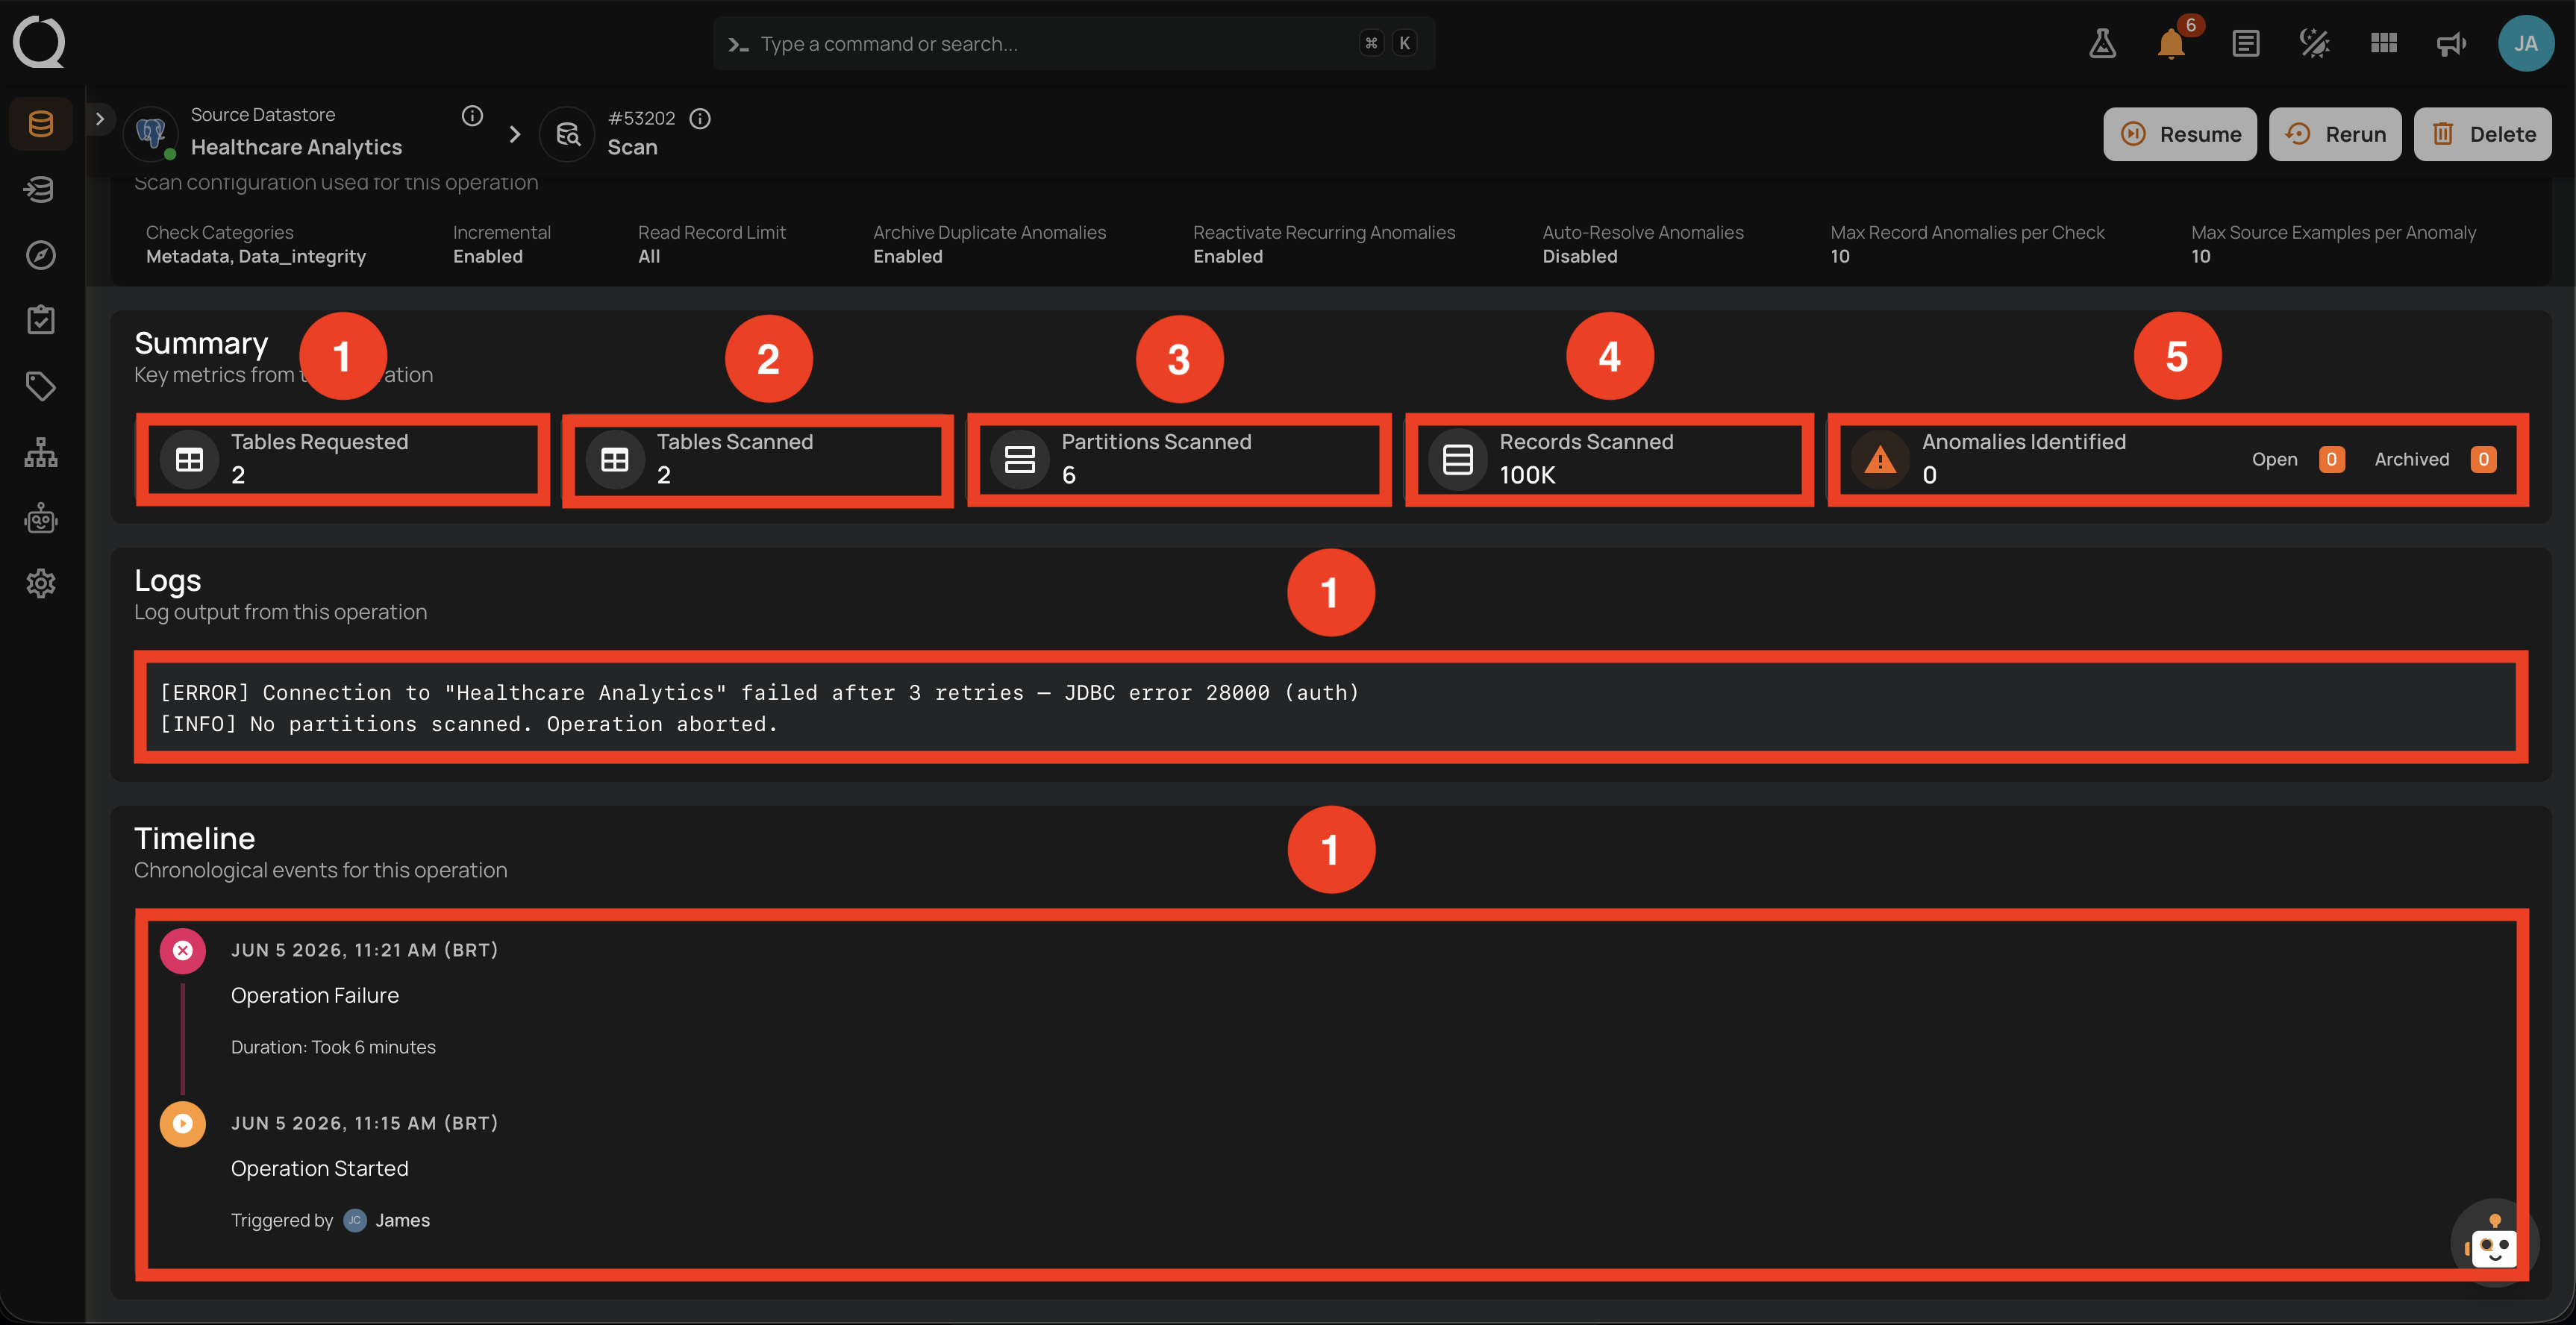
| No. | Element | What it shows |
|---|---|---|
| 1 | Tables Requested | Total containers targeted. |
| 2 | Tables Scanned | Containers scanned before the failure. |
| 3 | Partitions Scanned | Partitions read before the failure. |
| 4 | Records Scanned | Records processed before the failure. |
| 5 | Anomalies Identified | Anomalies detected before the failure. |
Logs block
The Logs block surfaces every [ERROR] and [INFO] line emitted during the run, in a wider full-screen-friendly view. For Failure operations, this is where the root-cause messages live. Each log line has the following structure.
| Part | Element | What it shows |
|---|---|---|
| Severity tag | [ERROR], [INFO], or [WARN] |
Severity of the log line. Failure operations typically emit [ERROR] for the fatal condition that stopped the run (connection failures, schema mismatches, permission denials) and [INFO] for status confirmations such as "Operation aborted." |
| Message | Human-readable text | The narrative explaining what the platform encountered. Examples: "Connection to Healthcare Analytics failed after 3 retries, JDBC error 28000 (auth)", "Schema mismatch: column salary not found in source", "No partitions scanned. Operation aborted." |
| Order | Position in the block | Lines are listed in chronological order from top (earliest) to bottom (most recent), mirroring the event sequence visible on the Timeline. |
Message format
The message body on [ERROR] lines is cleaned up before display; [INFO] and [WARN] lines are shown as-is. Verbose technical traces are stripped from [ERROR] lines, while the meaningful chain of causes stays intact (root cause, error codes such as [FAILED_READ_FILE.PARQUET_COLUMN_DATA_TYPE_MISMATCH], SQLSTATE codes, and offending column names). Very long [ERROR] messages are also capped, so you see a readable summary rather than a wall of low-level detail.
Timeline block
The Timeline is critical for Failure: it records every event up to the failure point. Each entry follows the same structure.
| Part | Element | What it shows |
|---|---|---|
| Status icon | Marker on the left | A marker colored by event type. See the legend below. |
| Timestamp | Date and time | When the event was recorded, in the viewer's timezone. Sorted from most recent at the top to oldest at the bottom. |
| Event title | Short label | The event identity (for example, Operation Started, Operation Failed, Container scan completed). |
| Event detail | Context line | Additional information specific to the event: duration, the user who triggered the operation, container name, or other event-specific data. |
Timeline icon legend:
- Operation Success terminal entry.
- Operation Failure terminal entry.
- Operation Aborted terminal entry.
- Operation In Progress (Queued or Running, animated in the UI).
- Operation Started.
- Per-container entries inherit the same icon and color based on each container's own outcome (Success/Failure/Aborted/Running).
For a Failure scan, the typical events are:
Operation Failedat the top, with the failure timestamp.Operation Startedat the bottom, withTriggered by <user>.
Error messages appear in the Logs block (above the Timeline), not in the Timeline itself.
Results tab
The Results tab is typically empty for early failures. For failures that occurred mid-scan, it lists only the containers processed before the fatal error.
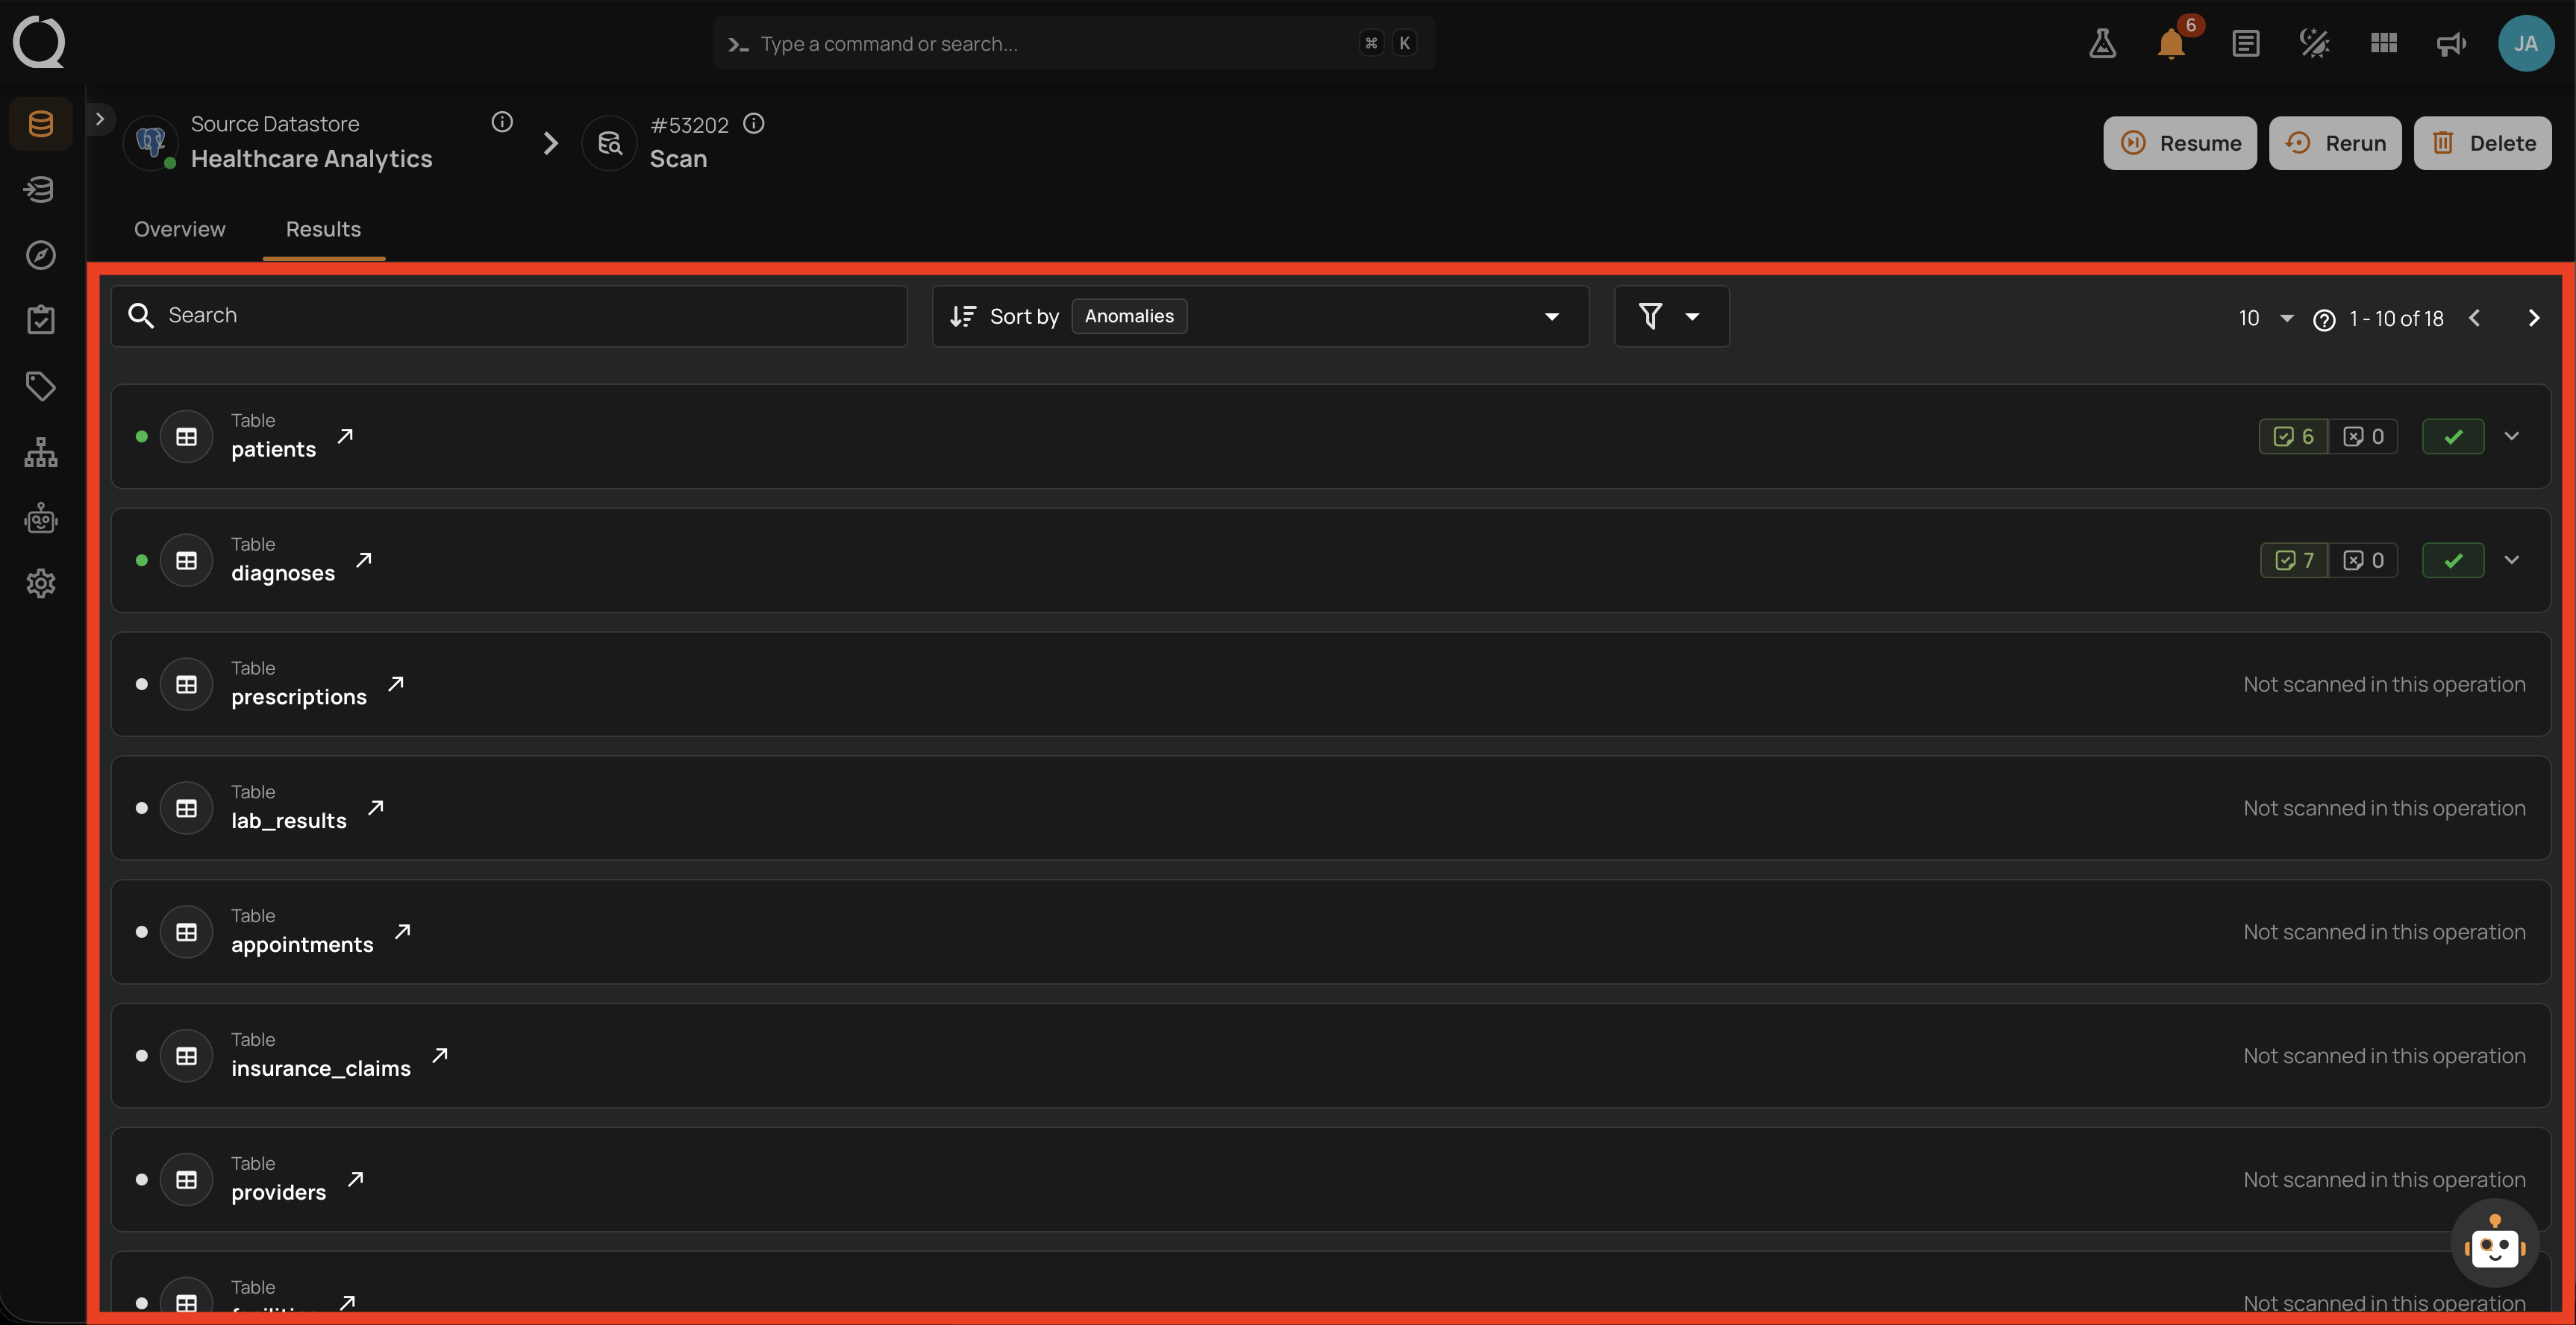
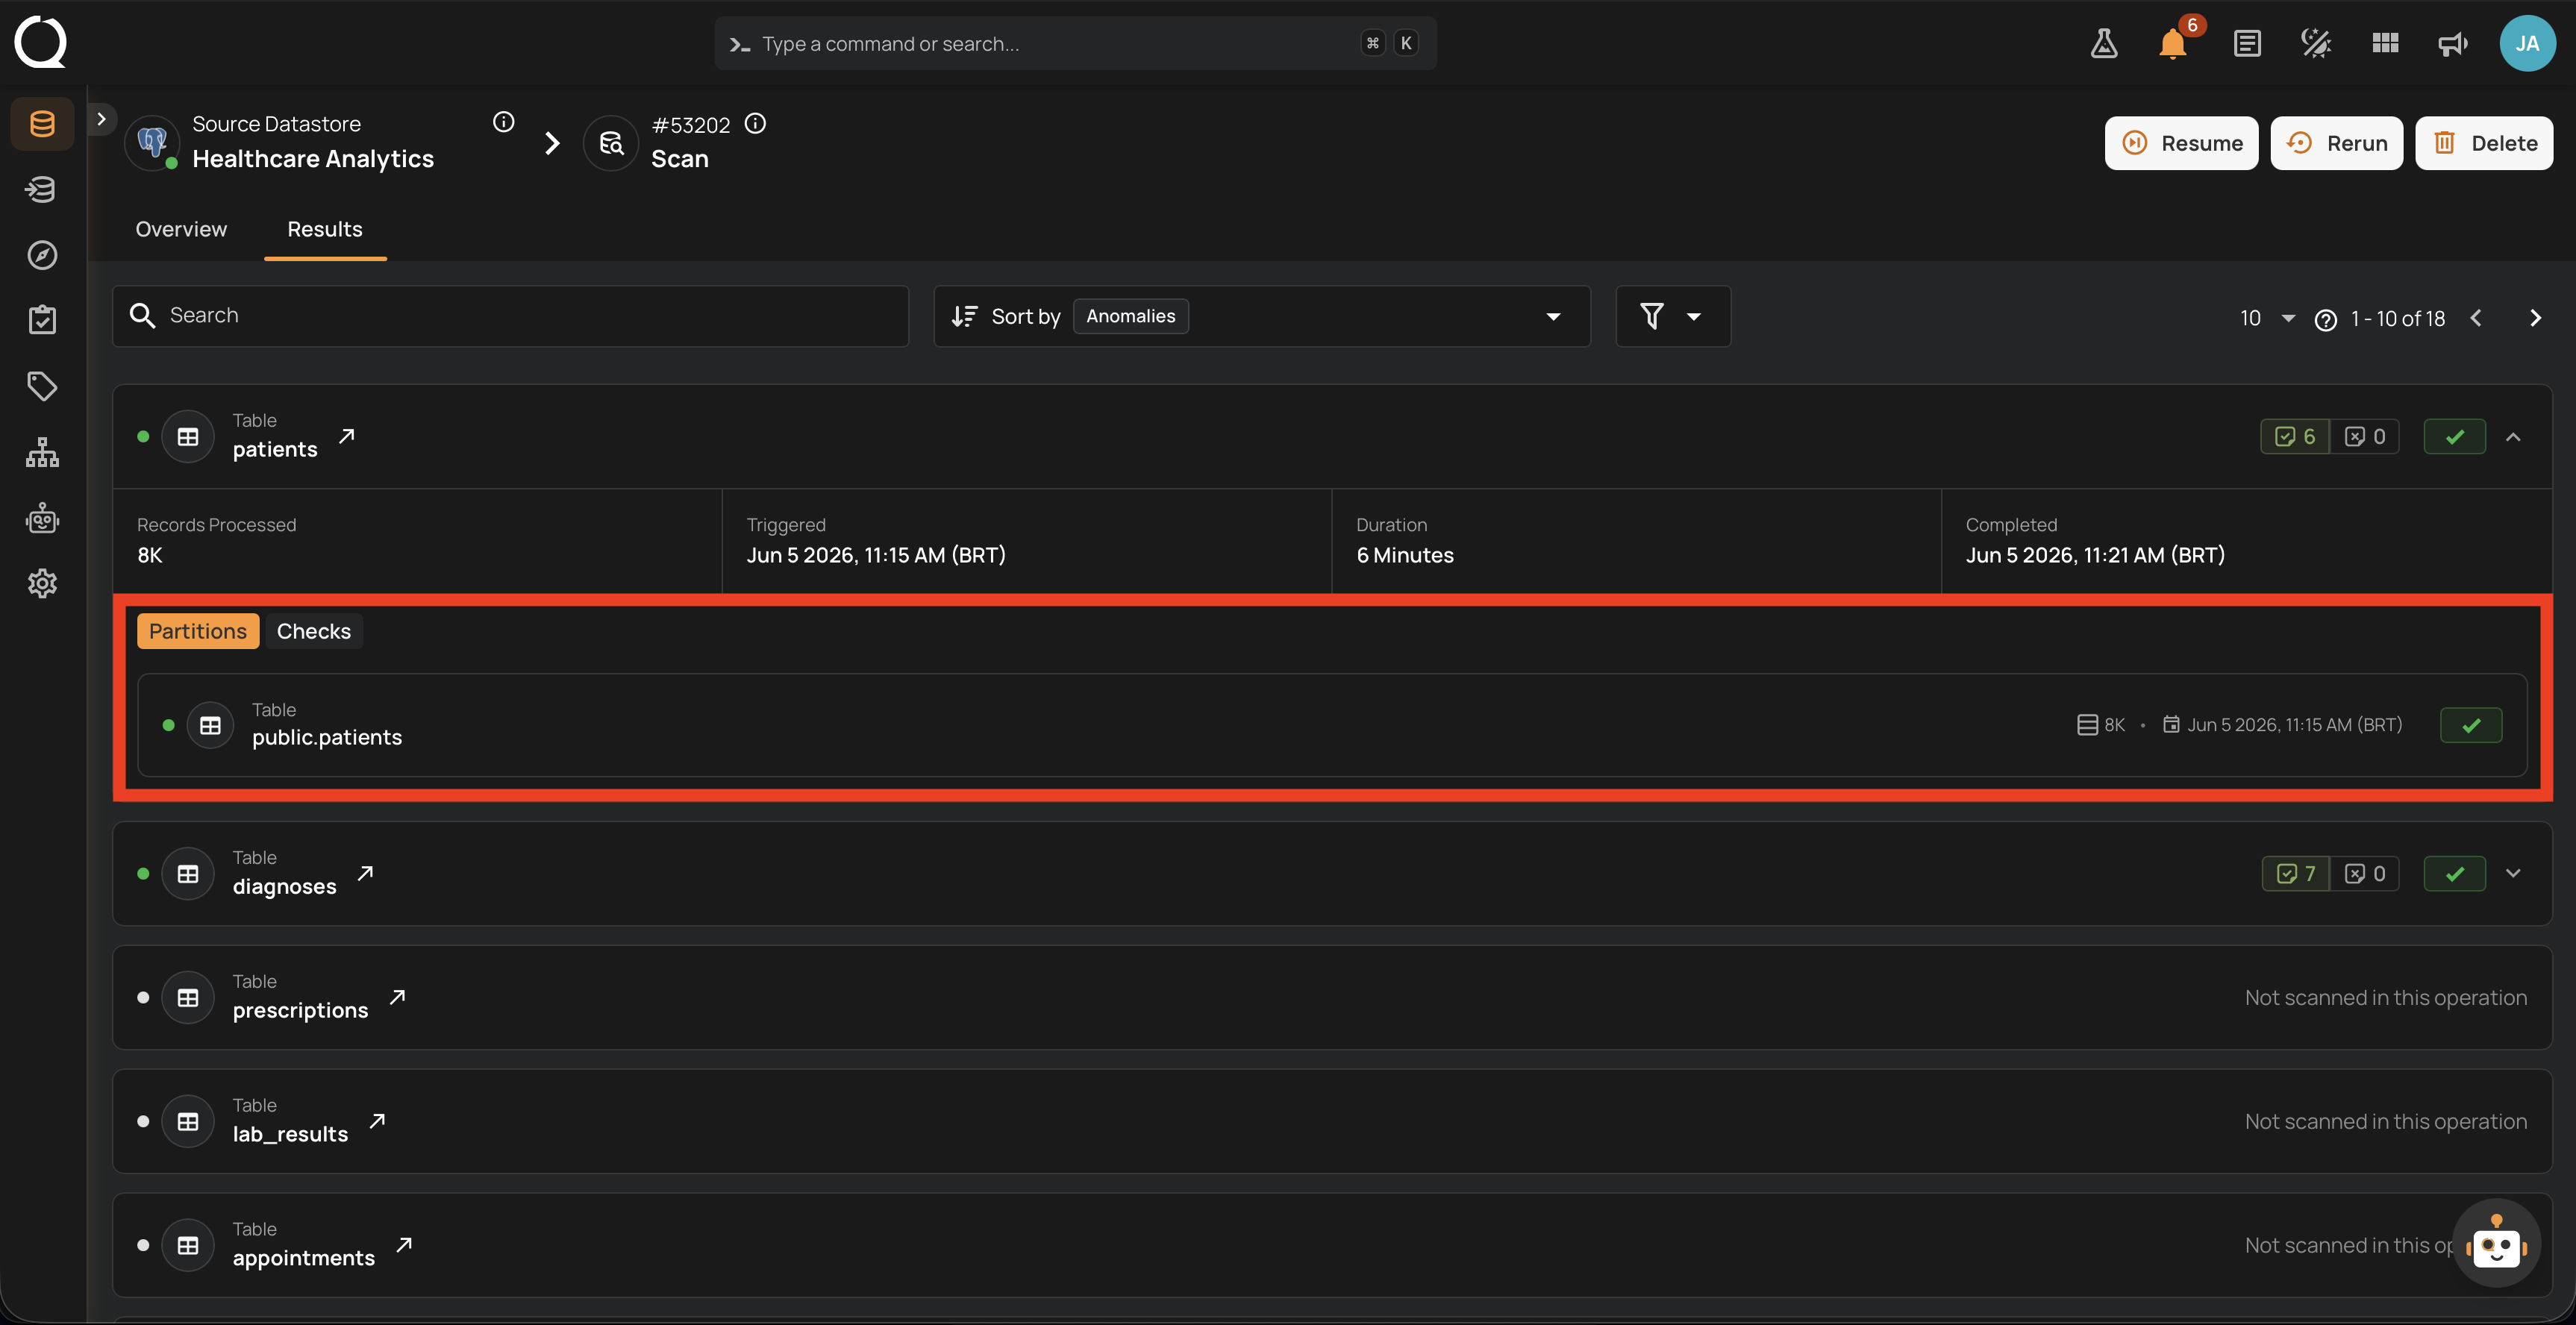
Container sub-tabs
Expanding a container row reveals two sub-tabs that drill into the per-container results captured before the failure. A Source Records sub-tab is not exposed for Failure operations.
Partitions
Lists every partition read for this container before the failure.
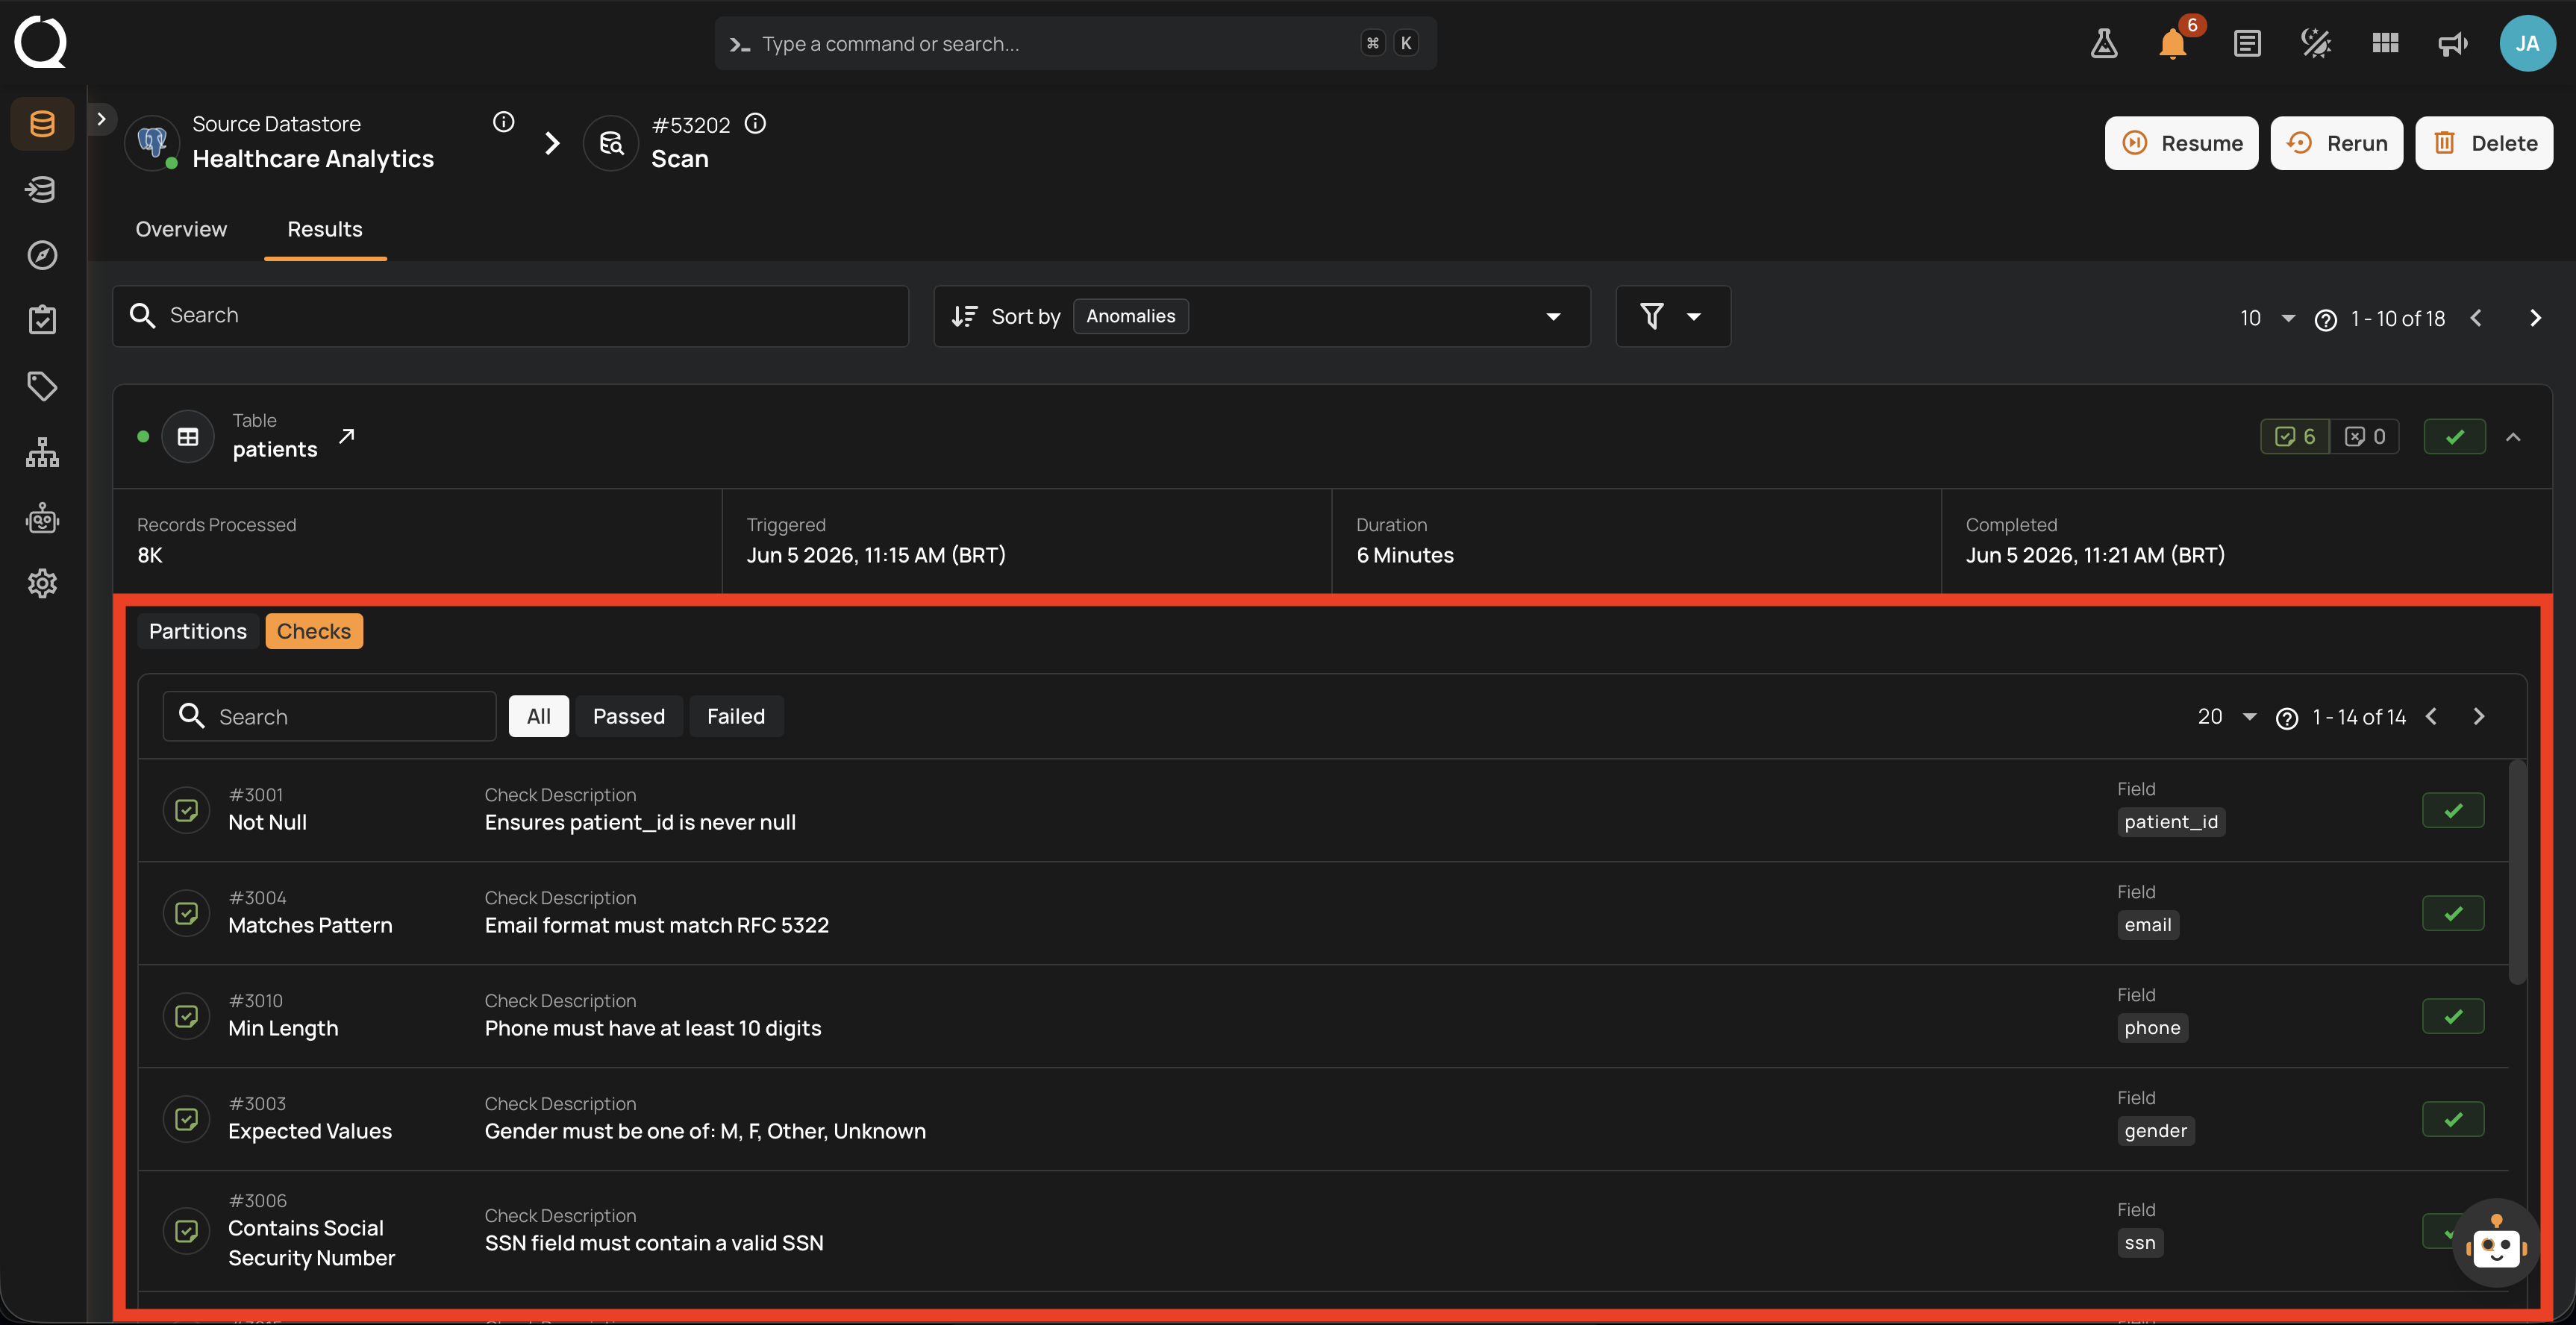
Checks
Lists every check that was asserted against this container, with pass/fail status. For Failure scans, this is often empty if no records were read.
See also
-
Success
The Run finished cleanly with full results.
-
Success with Warning
The Run finished cleanly but the worker recorded log entries during execution.
-
Aborted
A user or the system stopped the Run before completion.
-
Running
A worker is actively processing the Run; counters update live.
-
Queued
The Run is registered but no worker has picked it up yet.
-
Lifecycle
State diagram, transitions, and per-operation-type lifecycle.
-
Available Actions
Abort, Resume, Rerun, and Delete: when each one is shown.