Anomaly Insights
Anomaly Insights provides key insights into a specific data anomaly, including its status, anomalous record count, failed checks, Severity, and the users assigned to it. It also shows when the anomaly was detected, the triggering scan, and the related datastore, table, and location. If every failed check behind the anomaly is AI Managed, an AI badge is shown alongside these attributes. This view helps users quickly understand the scope and source of the anomaly for easier investigation and resolution.
Let's get started 🚀
Step 1: Click on the anomaly that you want to see the details of.
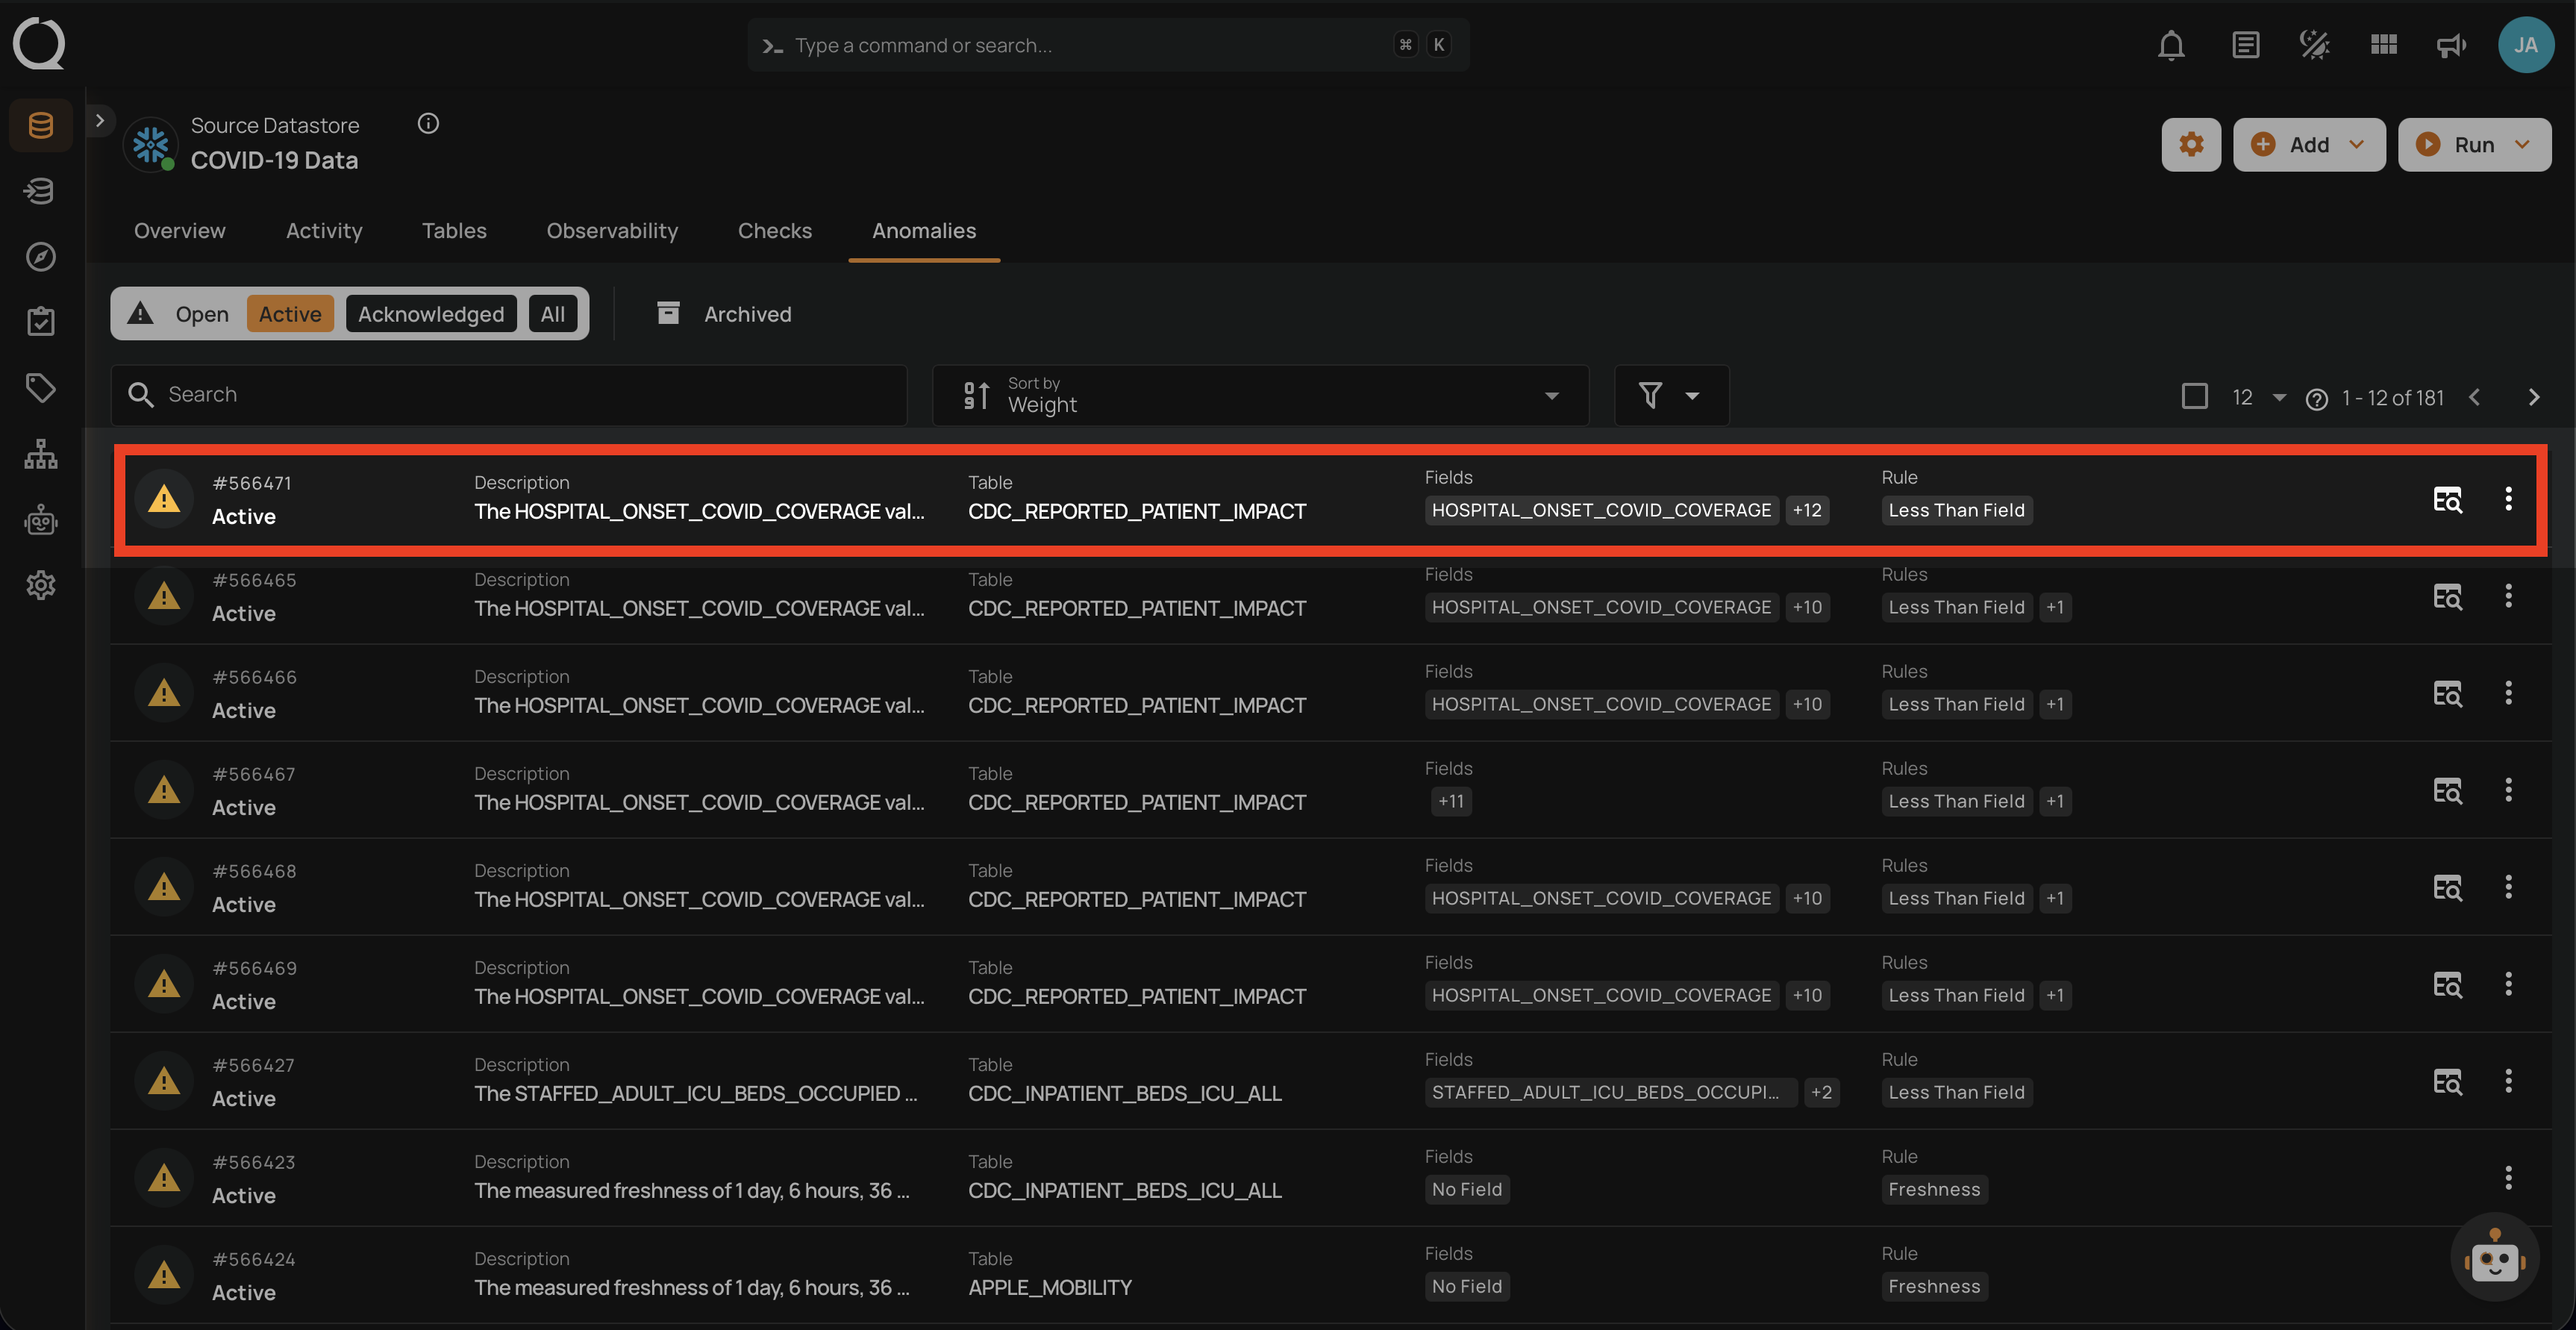
You will be navigated to the details section, where you can view the Summary, Description, Failed Checks, Source Records, Tickets and Timeline information.
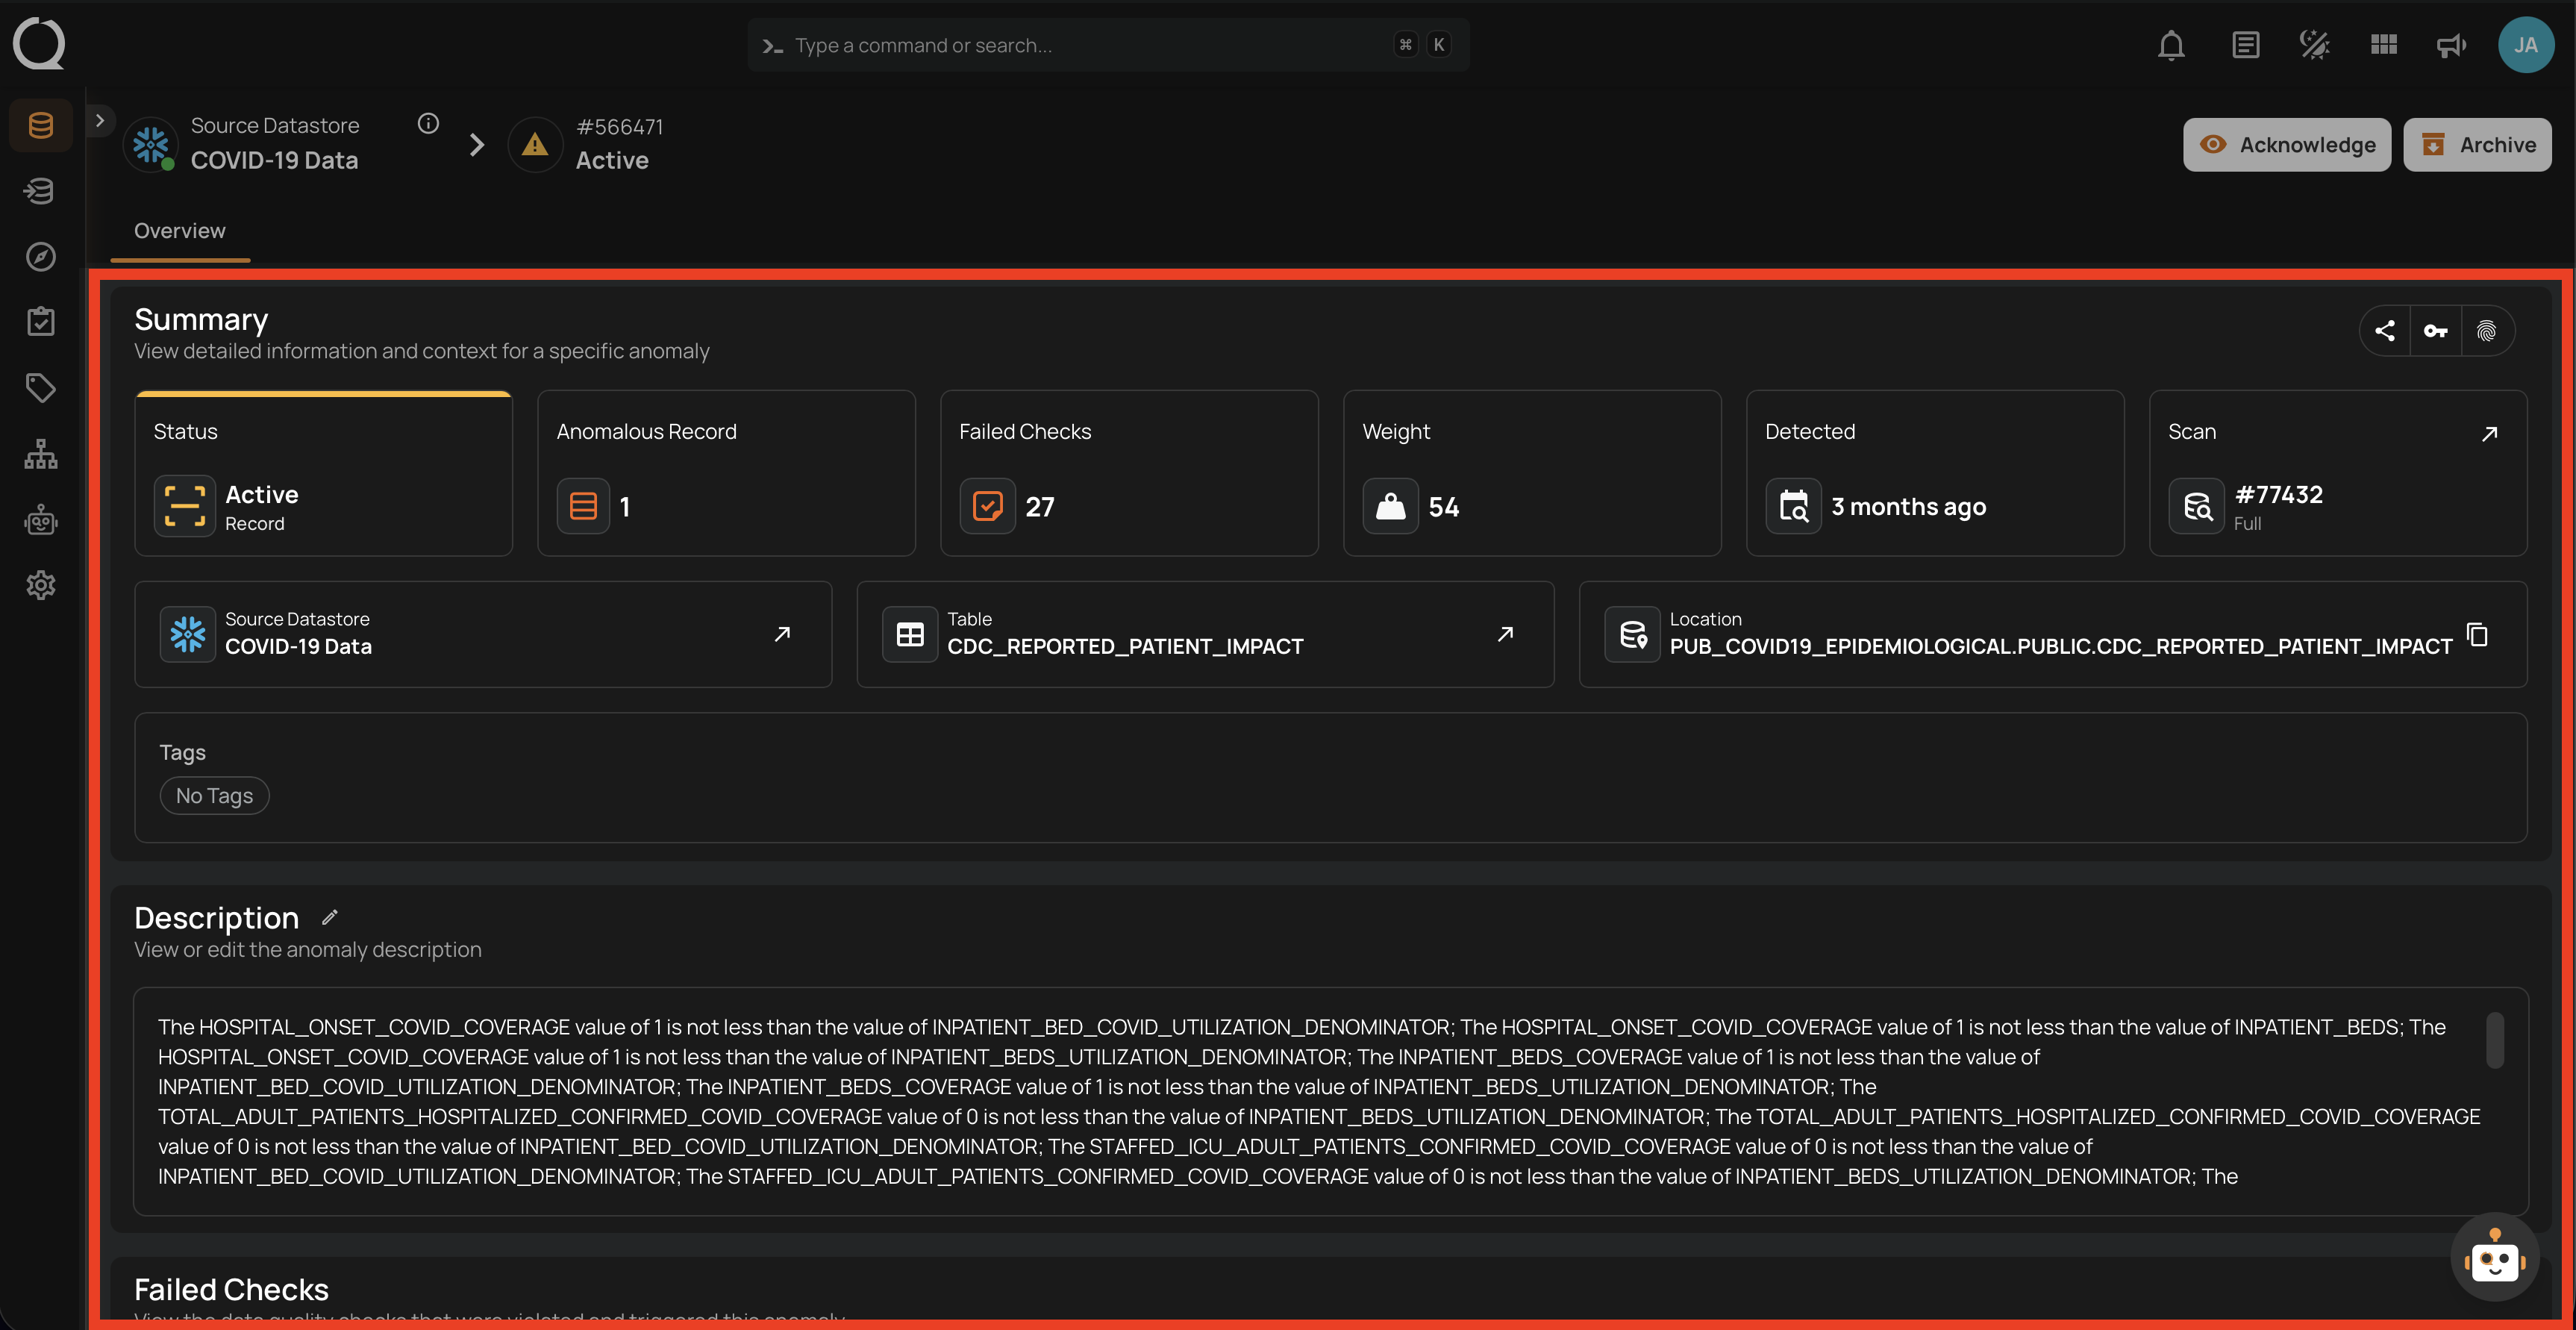
Summary
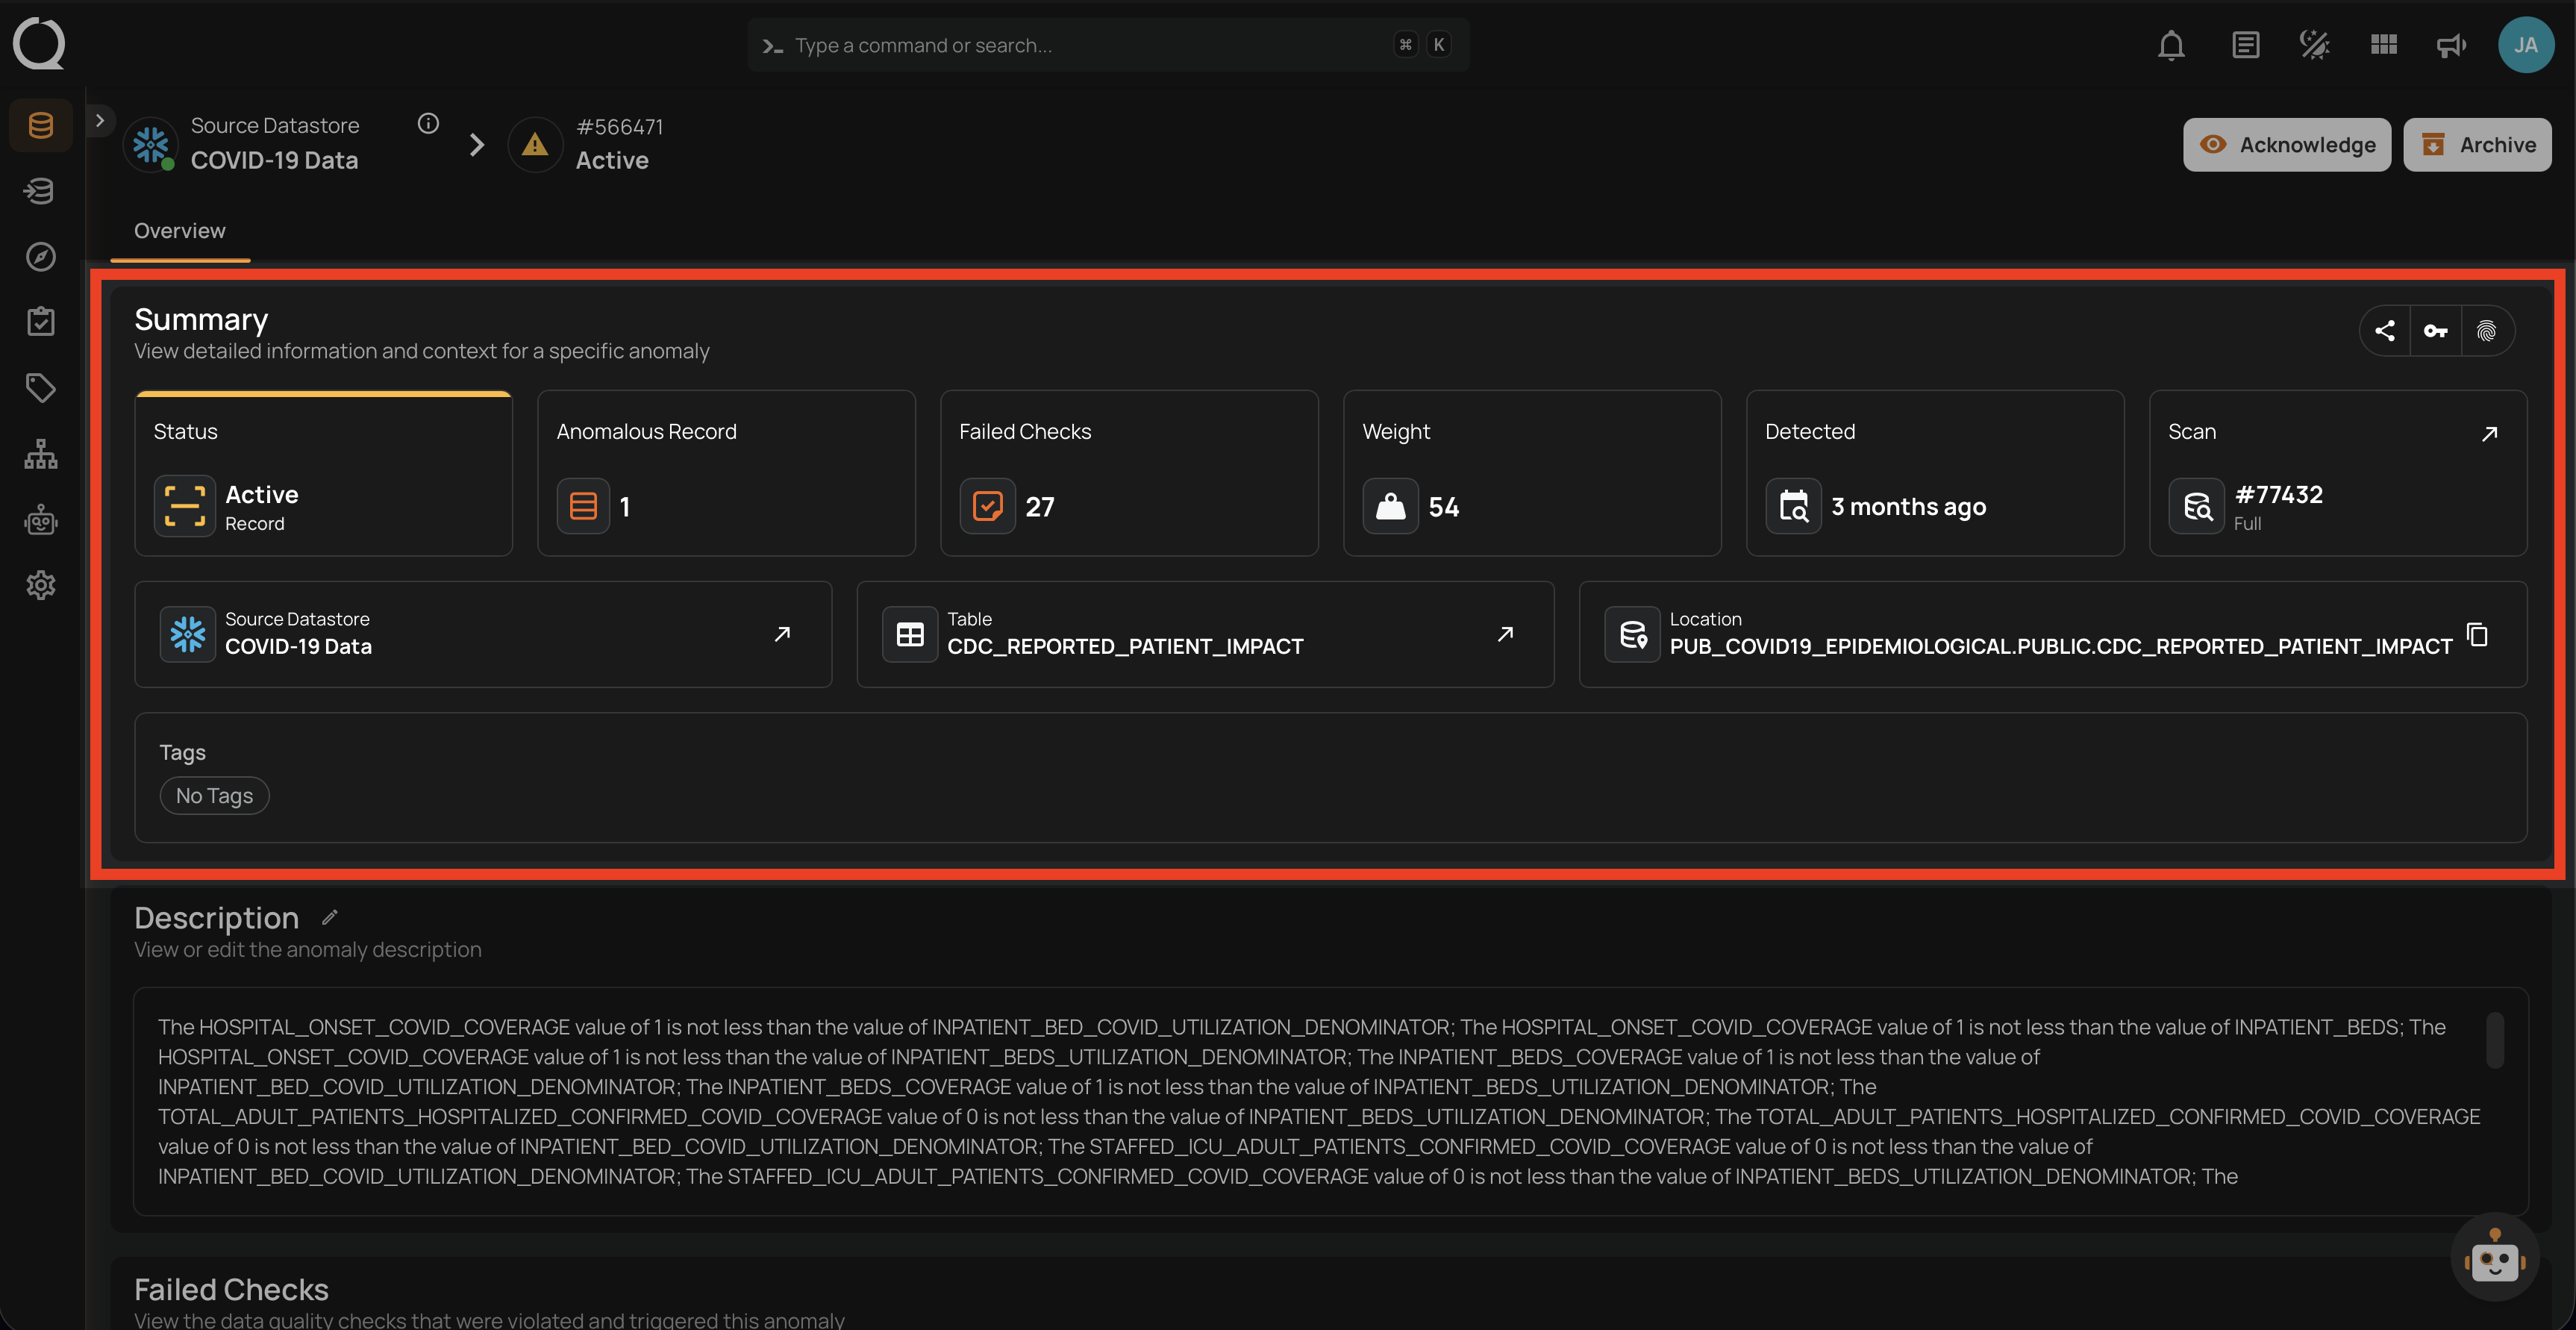
The Summary section provides a quick overview of the anomaly's key attributes. It includes the anomaly's status, total anomalous records, failed checks, Severity, detection time, scan information, and the corresponding datastore and table. If every failed check is AI Managed, an AI badge is displayed in this section. This section helps users quickly understand where the anomaly occurred and its potential impact.
| No. | Field | Description |
|---|---|---|
| 1 | Status and Type | Shows the current state and category of the anomaly. In this case, the anomaly is Active and of type Record, indicating it relates to individual data records. |
| 2 | Anomalous Records | Indicates the total number of records affected by the anomaly. Here, 1 record was identified as anomalous. |
| 3 | Failed Check | Displays the number of data quality checks that were violated and triggered this anomaly. In this instance, 27 checks failed. |
| 4 | Severity | Represents the significance or impact of the anomaly. A higher Severity value implies a more critical issue. This anomaly has a Severity of 54. |
| 5 | Detected | Shows how long ago the anomaly was first detected. When you hover over the time the anomaly was detected, a pop-up appears displaying the complete date and time. |
| 6 | Scan | Indicates the scan operation that detected the anomaly. Scan ID #77432 is shown here, and it was an incremental scan. When you click on the expand icon, you will be directed to the Scan Results page where you can view the specific scan that detected the anomaly. |
| 7 | Source Datastore | Identifies the dataset that contains the anomaly. This anomaly occurred in the "COVID-19 Data" datastore. Clicking the expand icon opens a detailed view and navigates to the dataset's page for more information about the source datastore. |
| 8 | Table | Points to the specific table involved in the anomaly. The affected table is CDC_REPORTED_PATIENT_IMPACT. Clicking on the expand icon navigates to the table's page, providing more in-depth information about the table structure and contents. |
| 9 | Location | Displays the full path of the table in the datastore. This helps users trace the exact location of the anomaly within the data pipeline. You can click on the copy icon to copy the full location path of the table where the anomaly was detected. |
| 10 | Tags | Highlights the severity or categorization of the anomaly. The tag High indicates a high-priority issue. You can add or remove tags from the anomaly by clicking on the tag badge. |
| 11 | Assignees | Lists the users responsible for reviewing and resolving the anomaly. Each assignee is shown as an avatar; when more than one user is assigned, a +N badge appears next to the first avatar and hovering it reveals the remaining users. Click the Edit button (or Plus when empty) next to the Assignees label to open the user picker. For the full behavior, see Deep Dive · Anomaly Assignees; for the step-by-step tutorial, see Add Anomaly Assignees. |
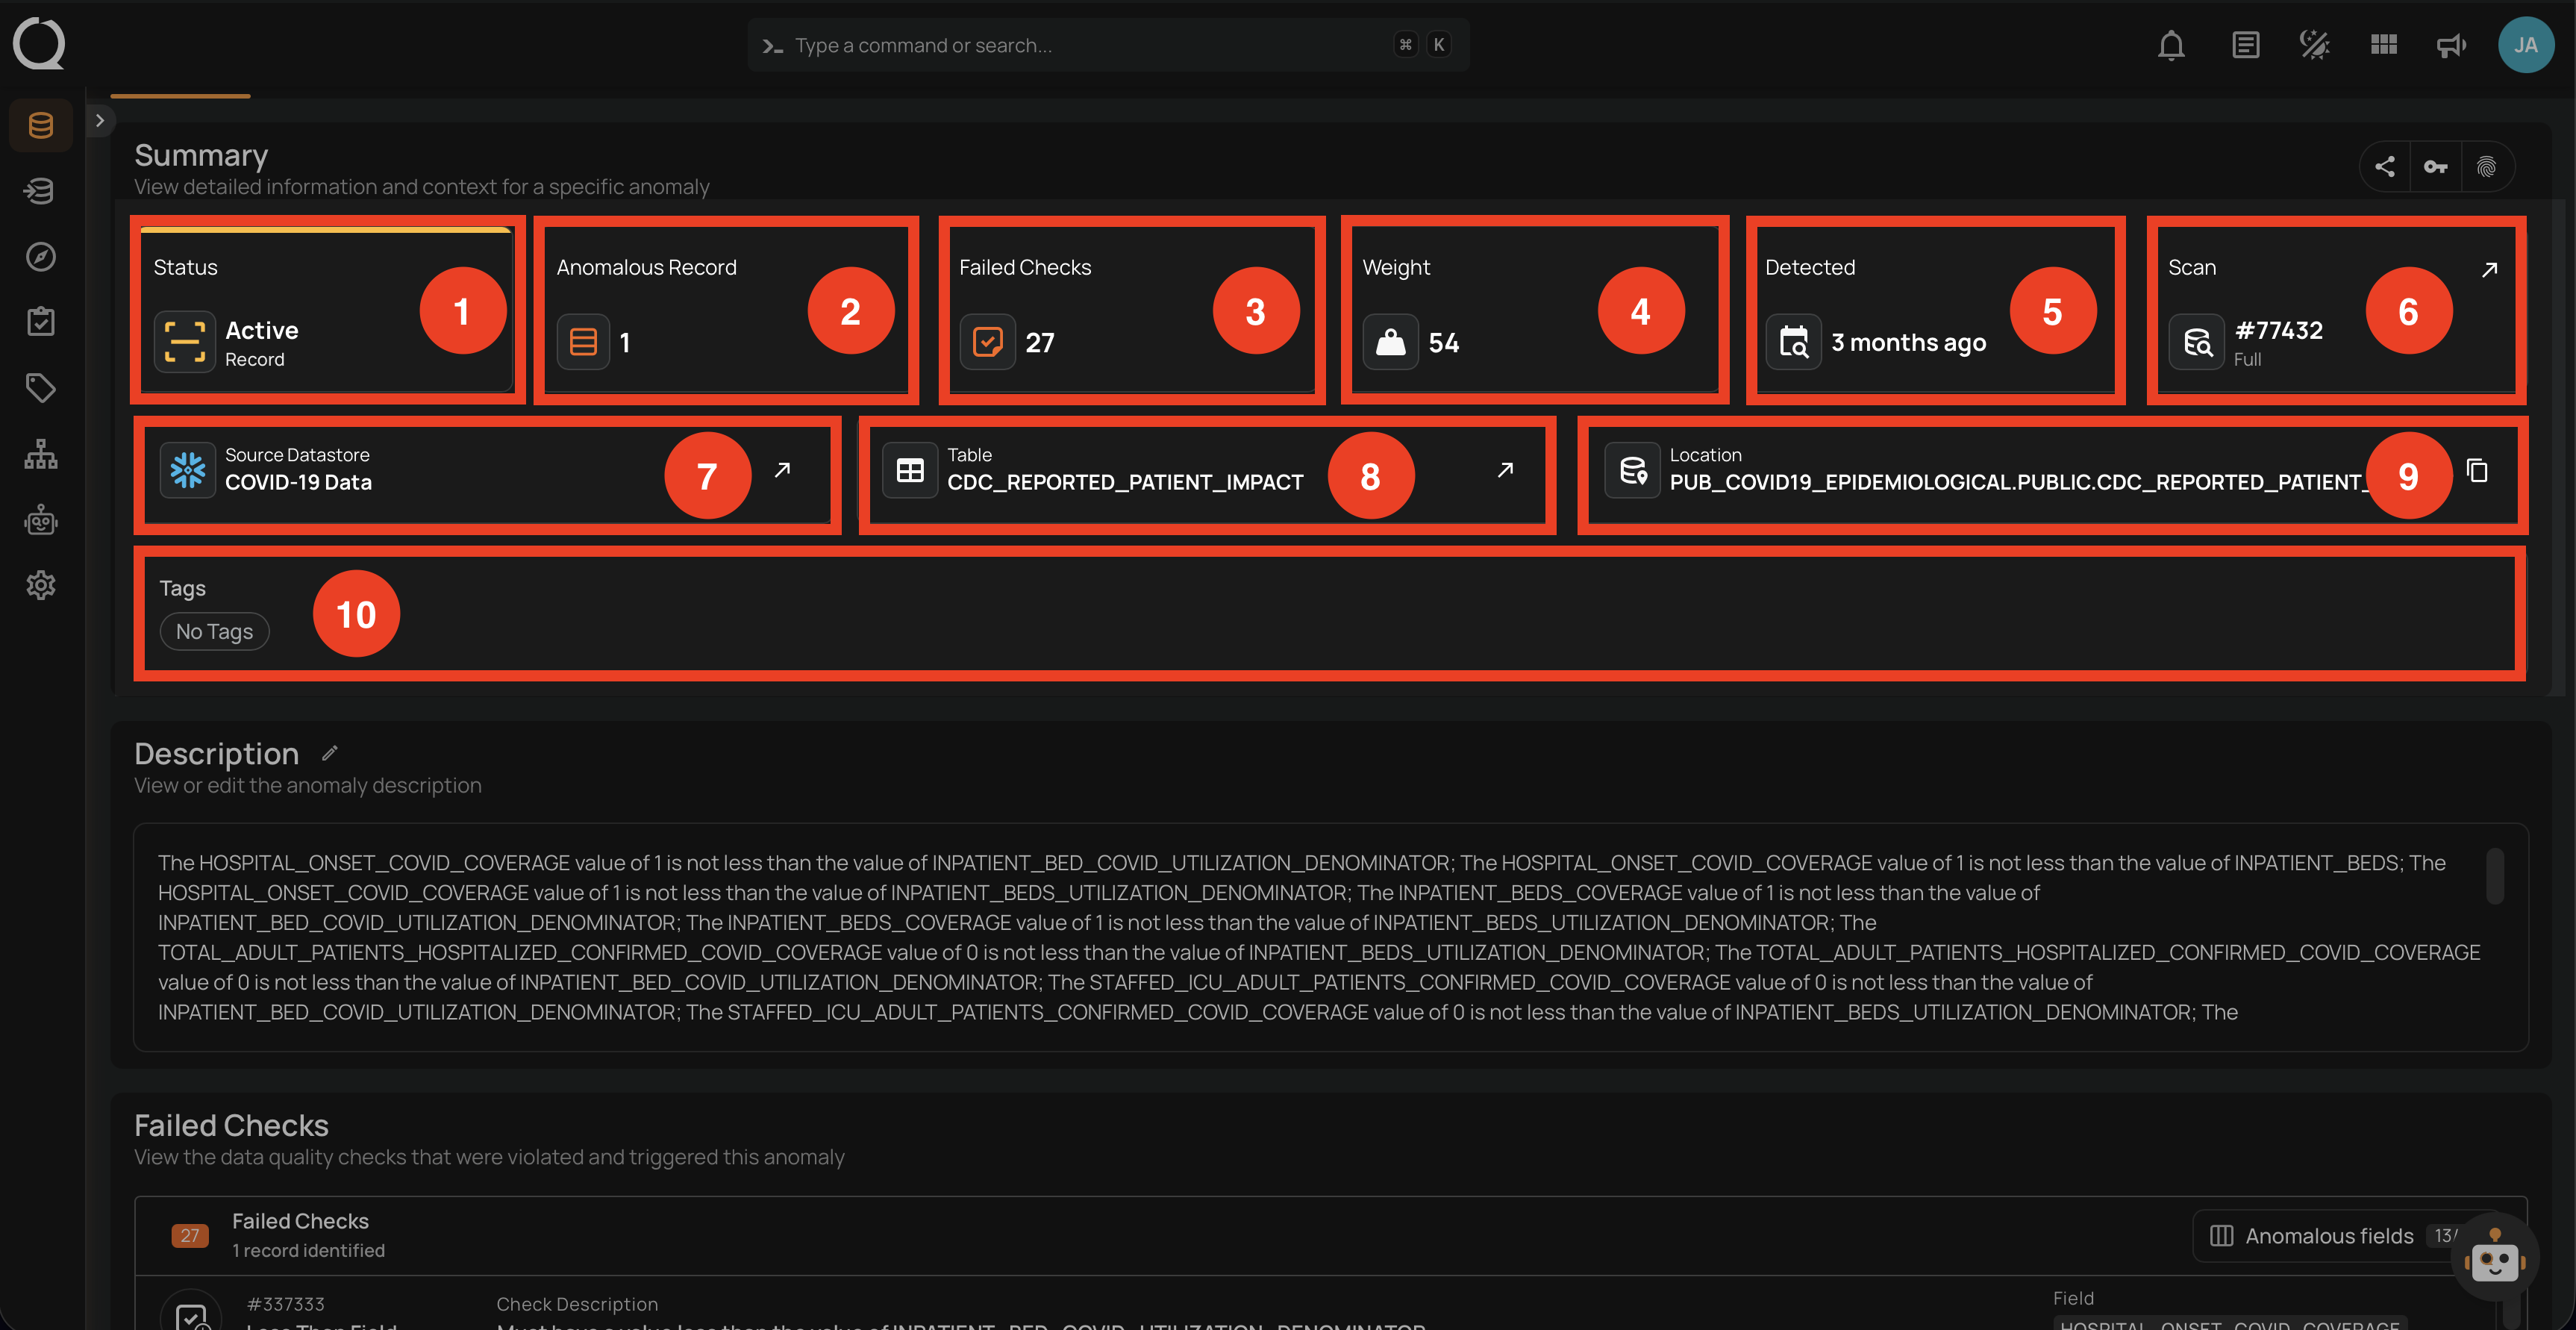
Description
The Description section shows a business-friendly explanation of the anomaly. For how the default text is generated, who can edit it, AI suggestions, Markdown support, and how the field interacts with masked data, see Anomaly Description.
Failed Checks
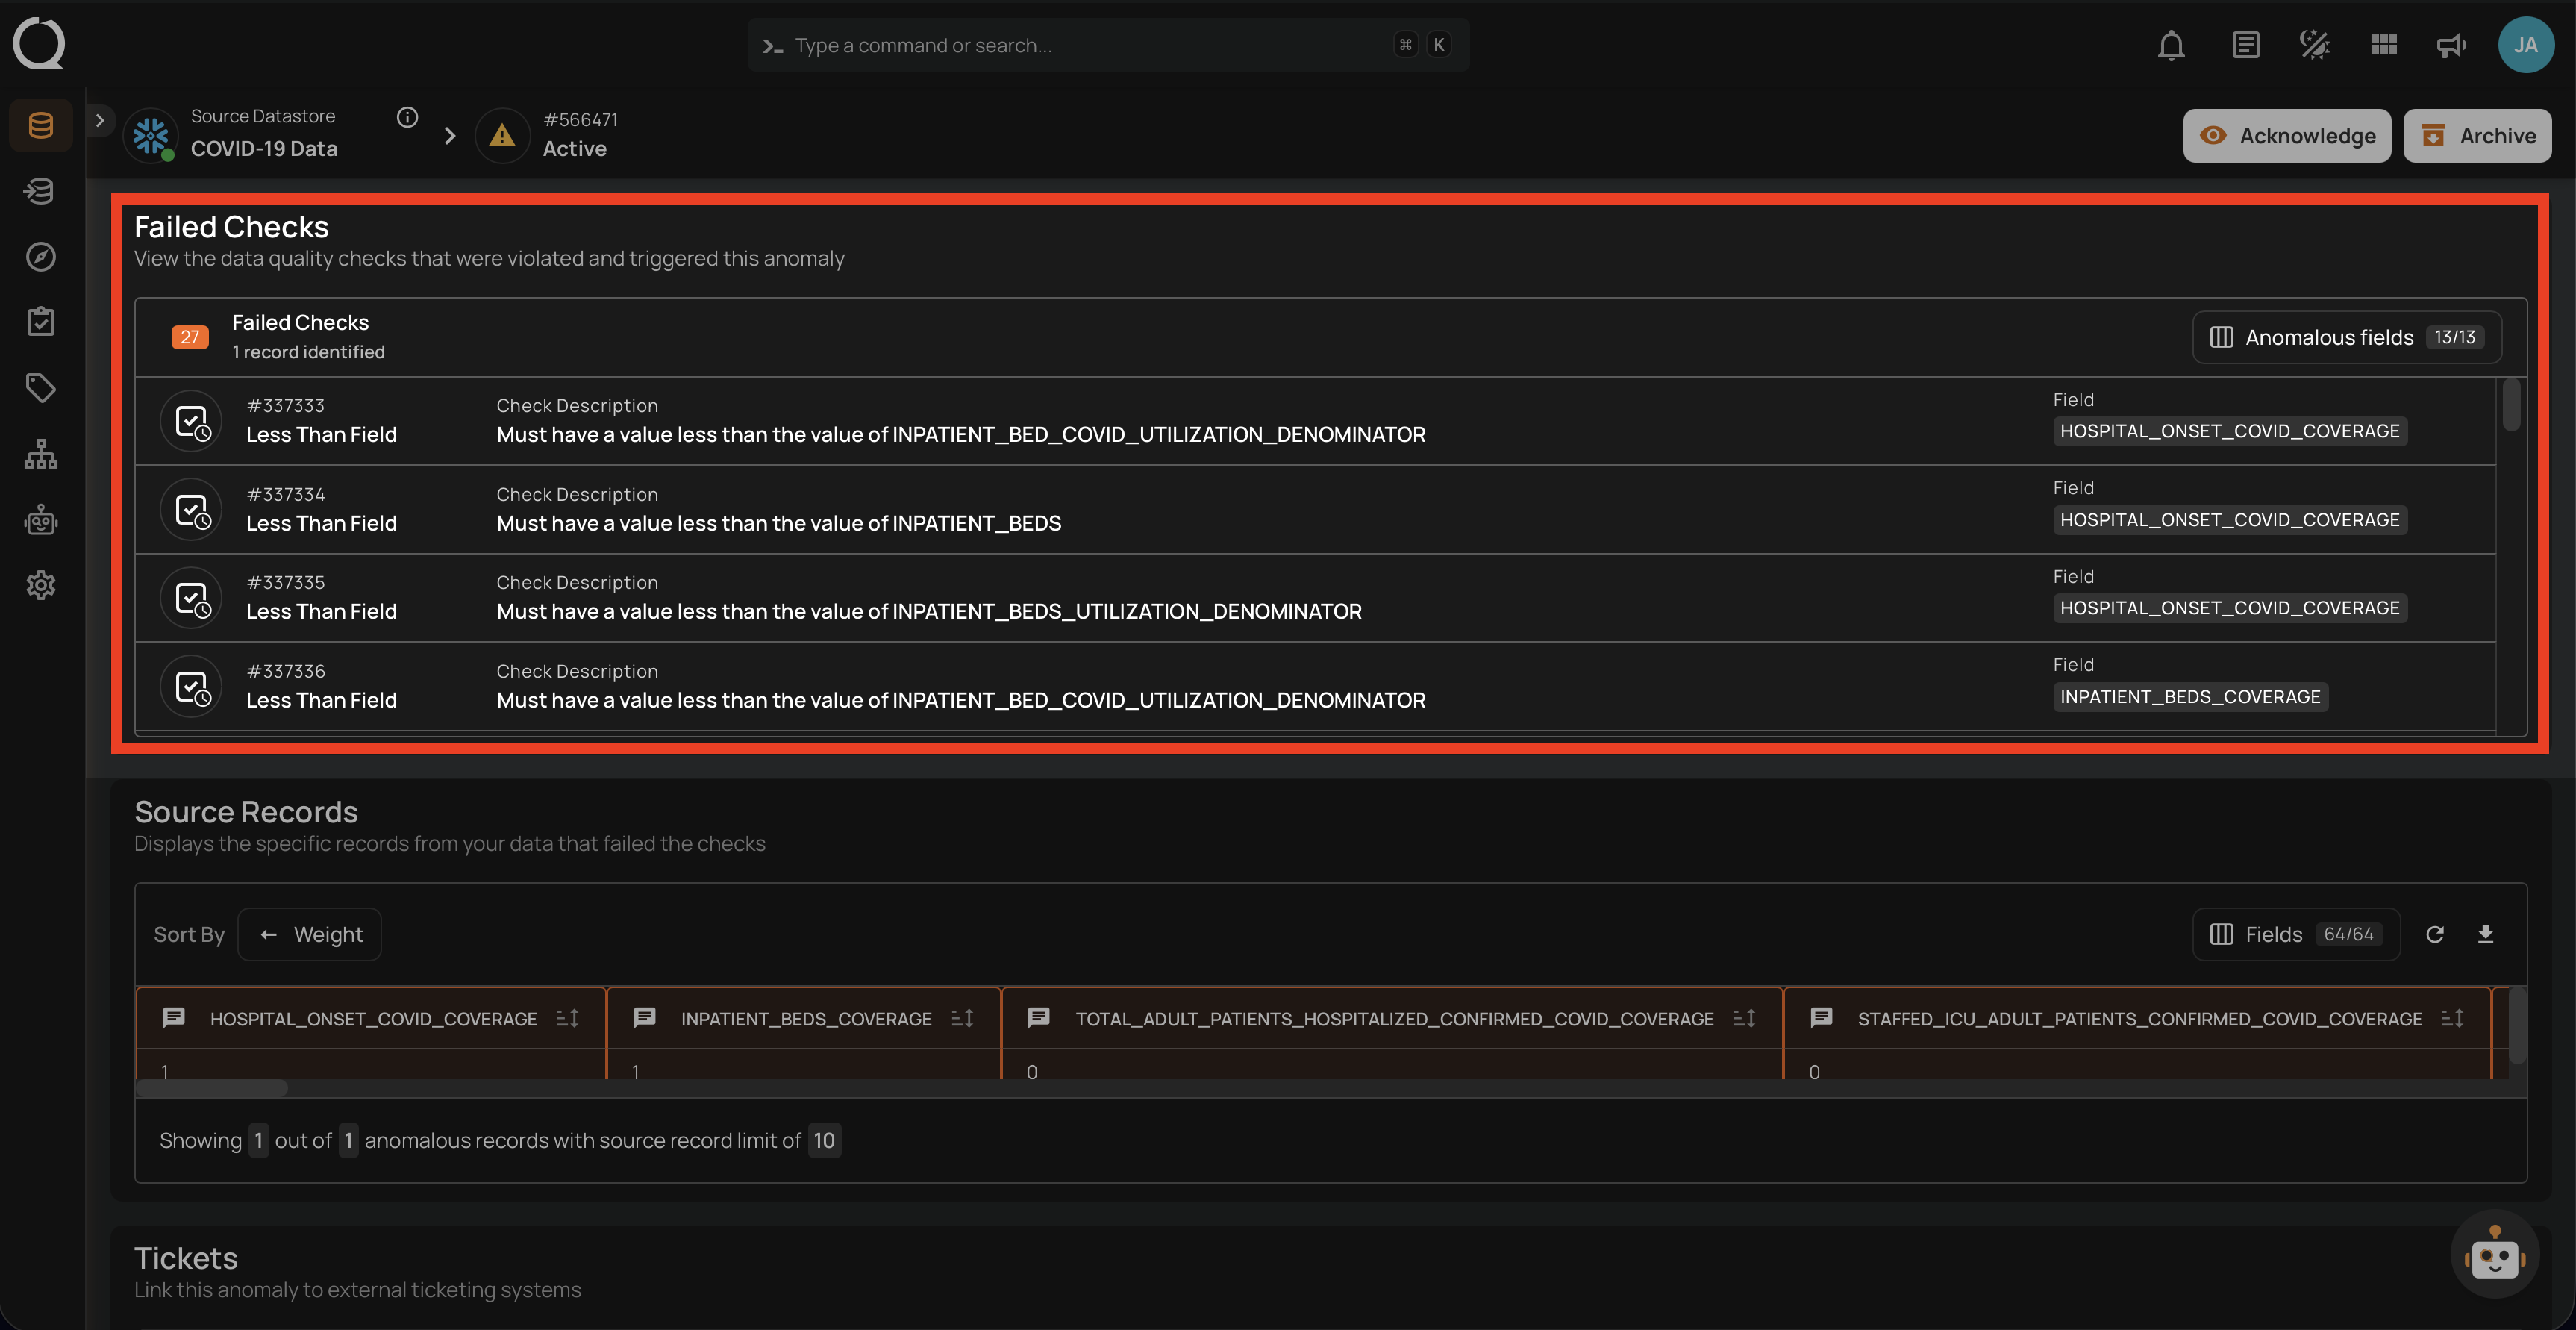
The Failed Checks section lists the data quality checks that were violated and subsequently triggered the anomaly. Each listed item displays the check ID, type of violation, and a summarized description of the failure condition.
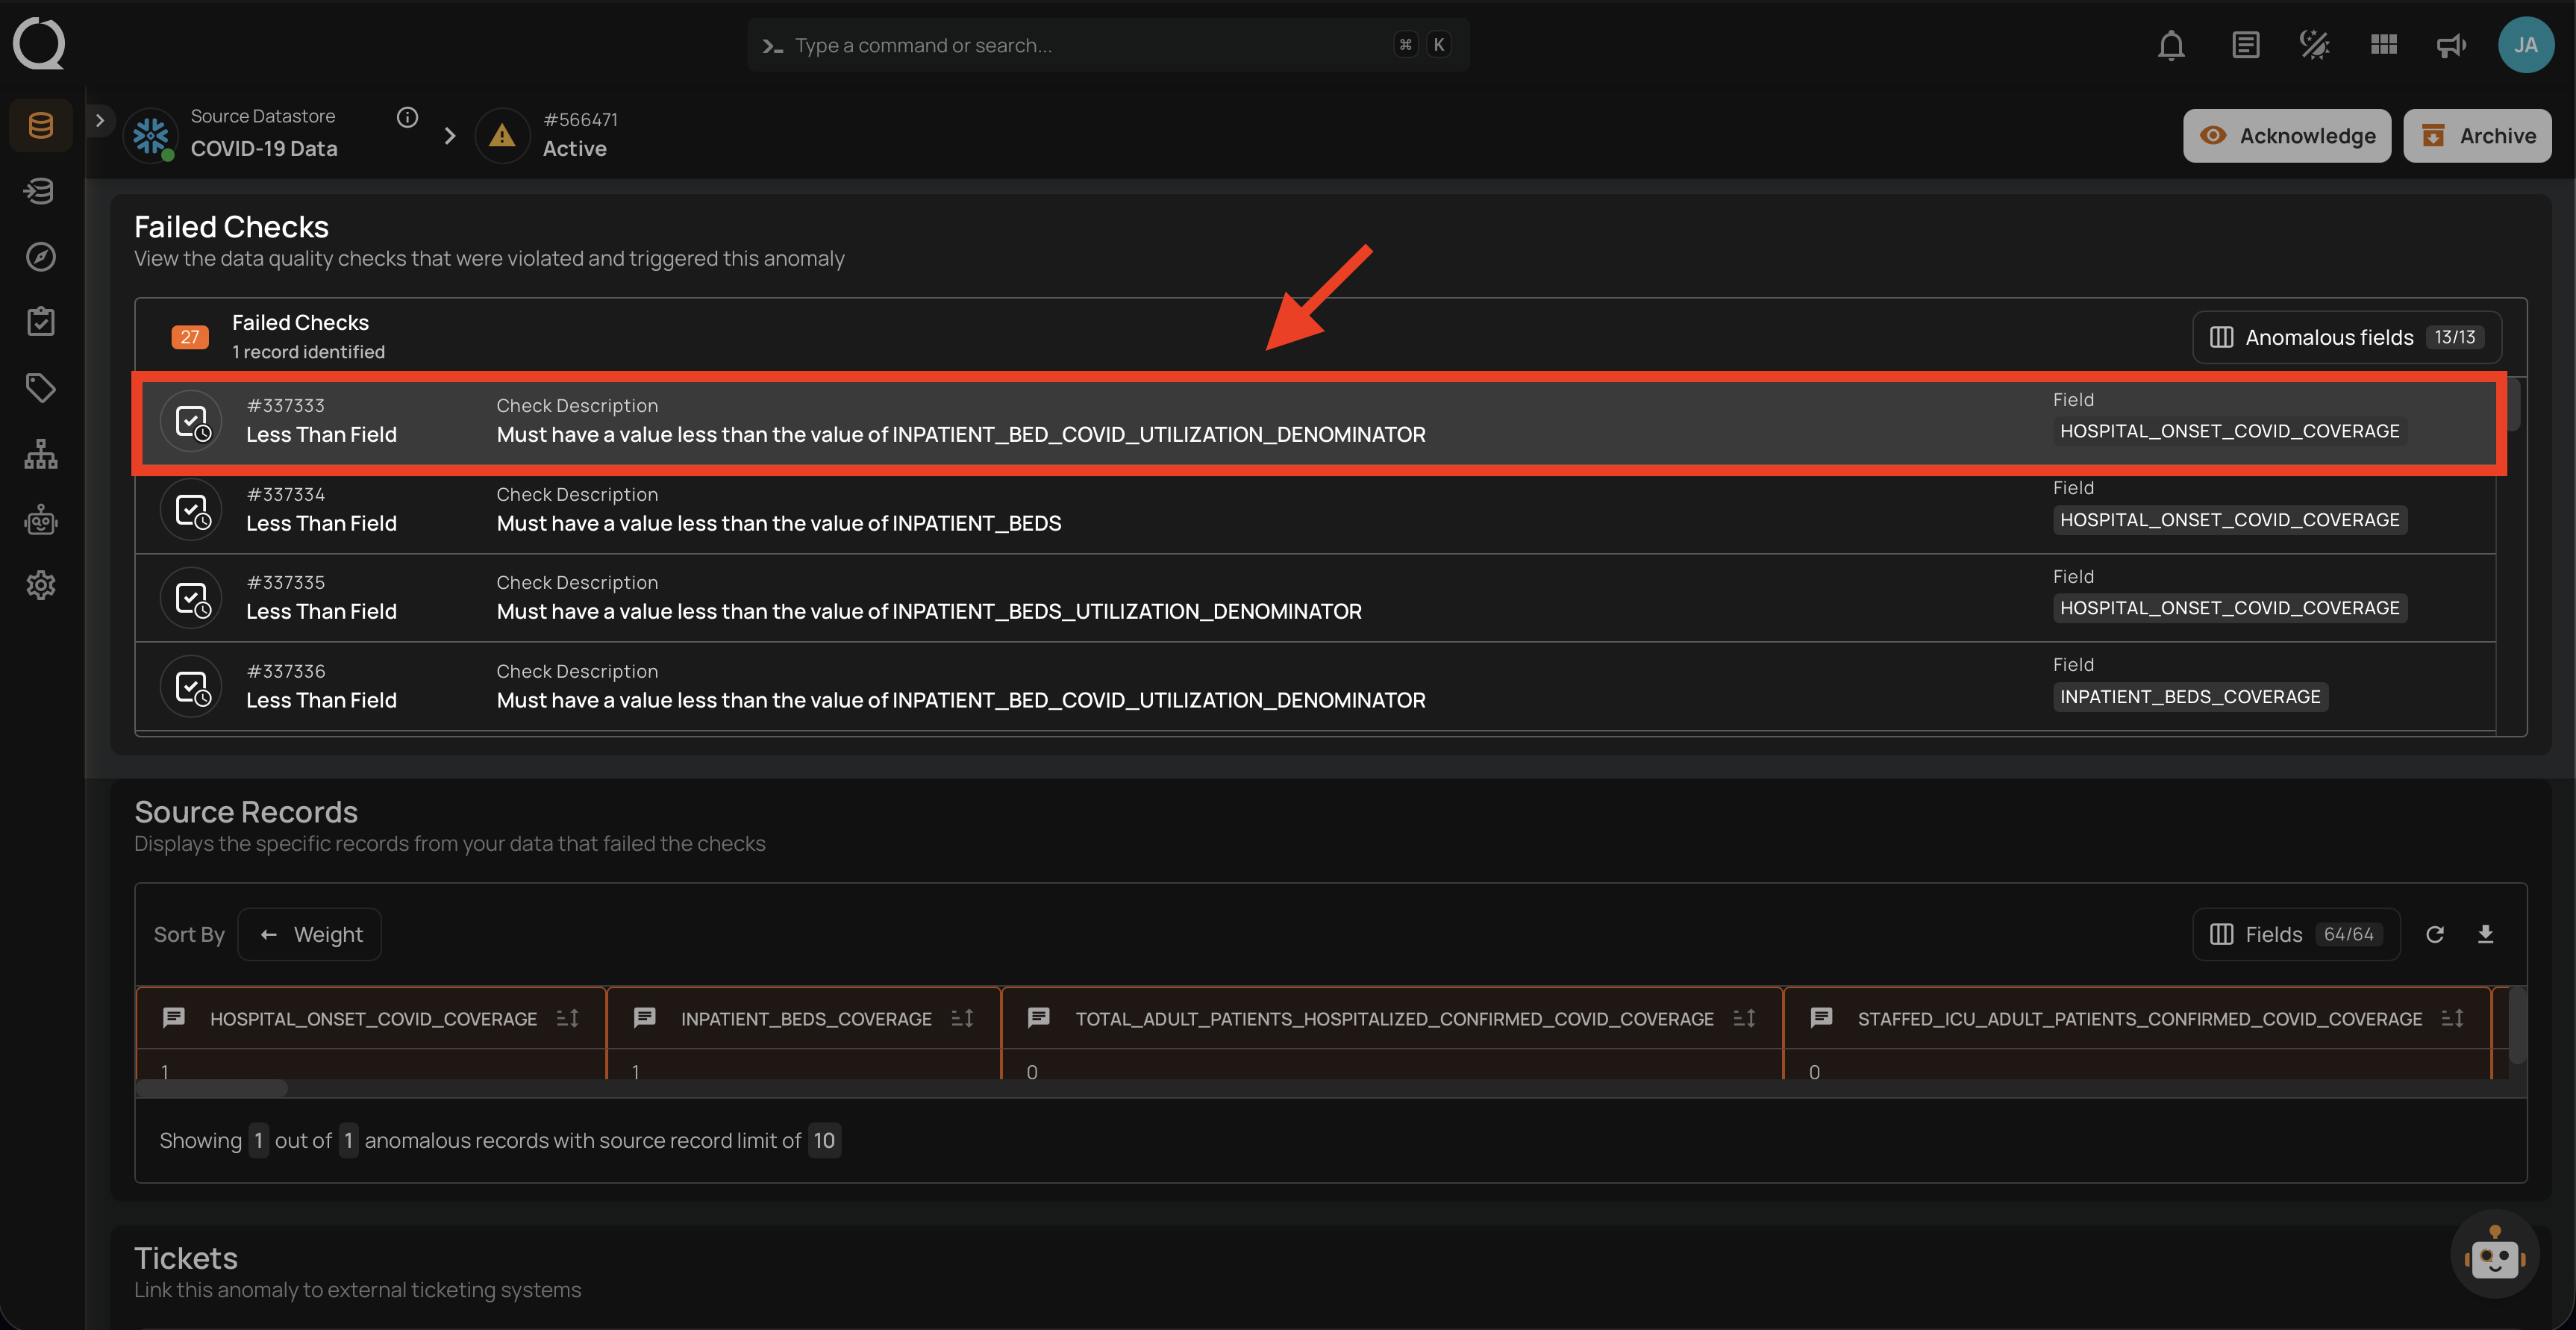
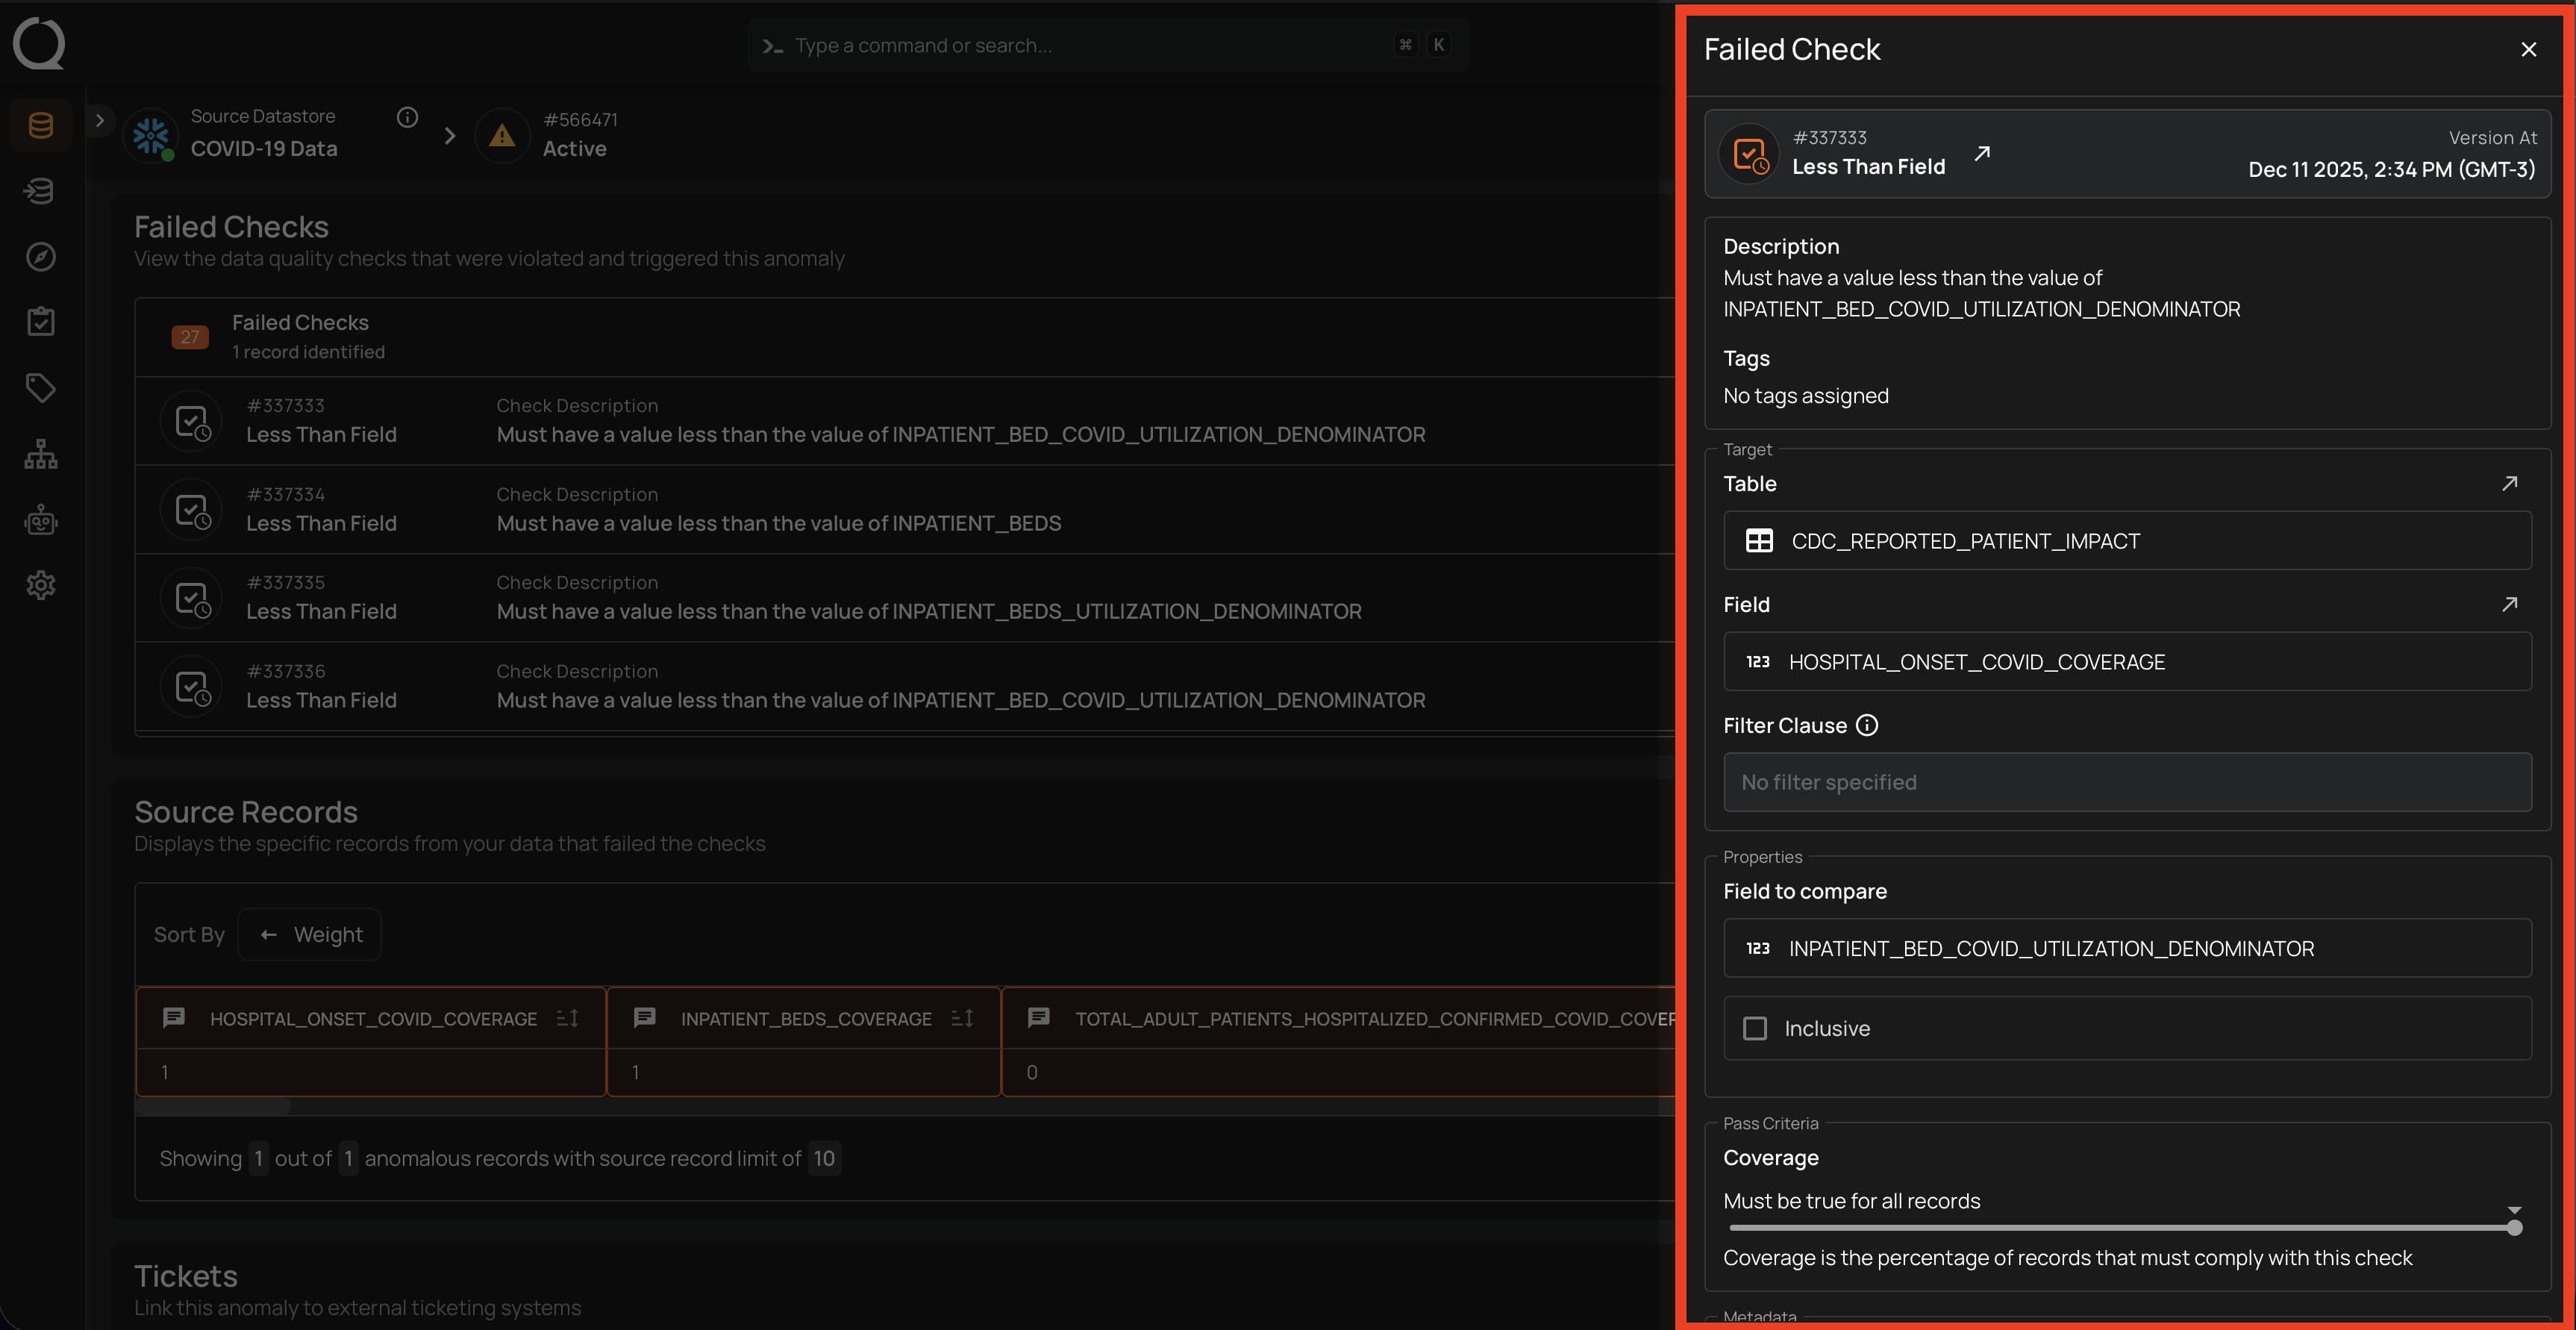
Click on a failed check to view the corresponding quality check information. A right-side panel will open, allowing you to view the details without navigating to a different page.
Anomalous Fields
The Anomalous Fields button allows you to filter the failed checks list by the specific fields that triggered the anomaly. The button displays a badge with the count of selected fields out of the total anomalous fields (e.g., 13/13).
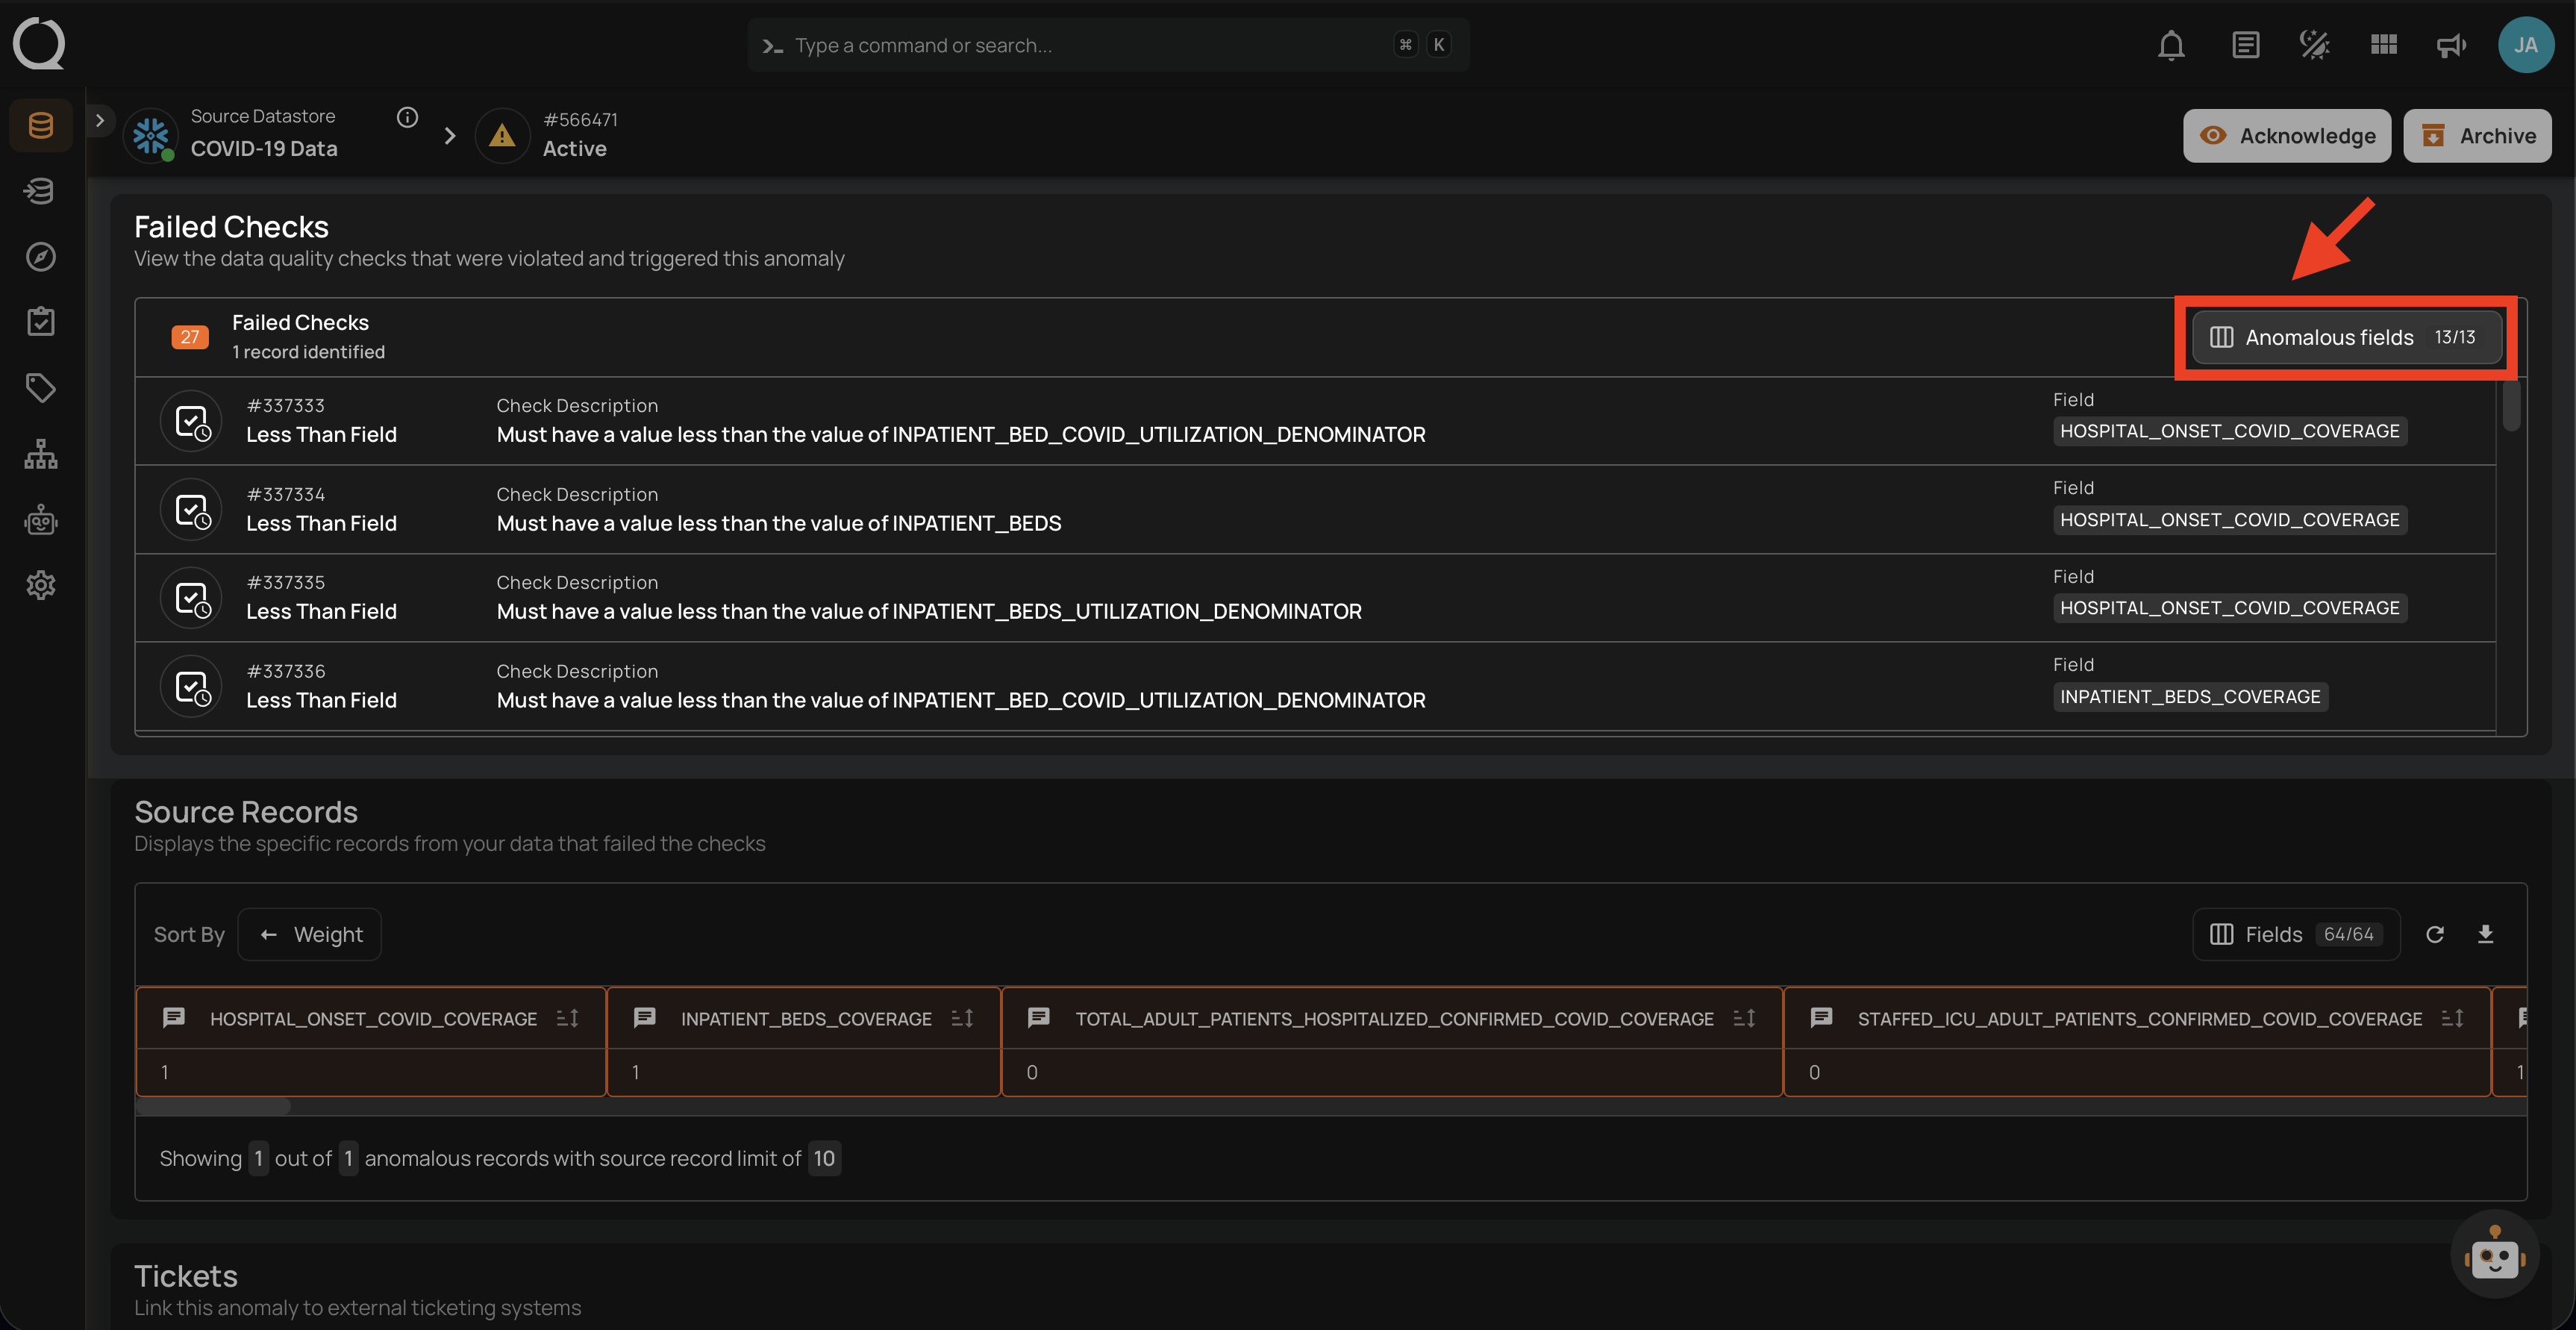
Click the Anomalous Fields button to open a dropdown with a searchable list of all fields involved in the failed checks. Each field has a toggle to show or hide its related failed checks.
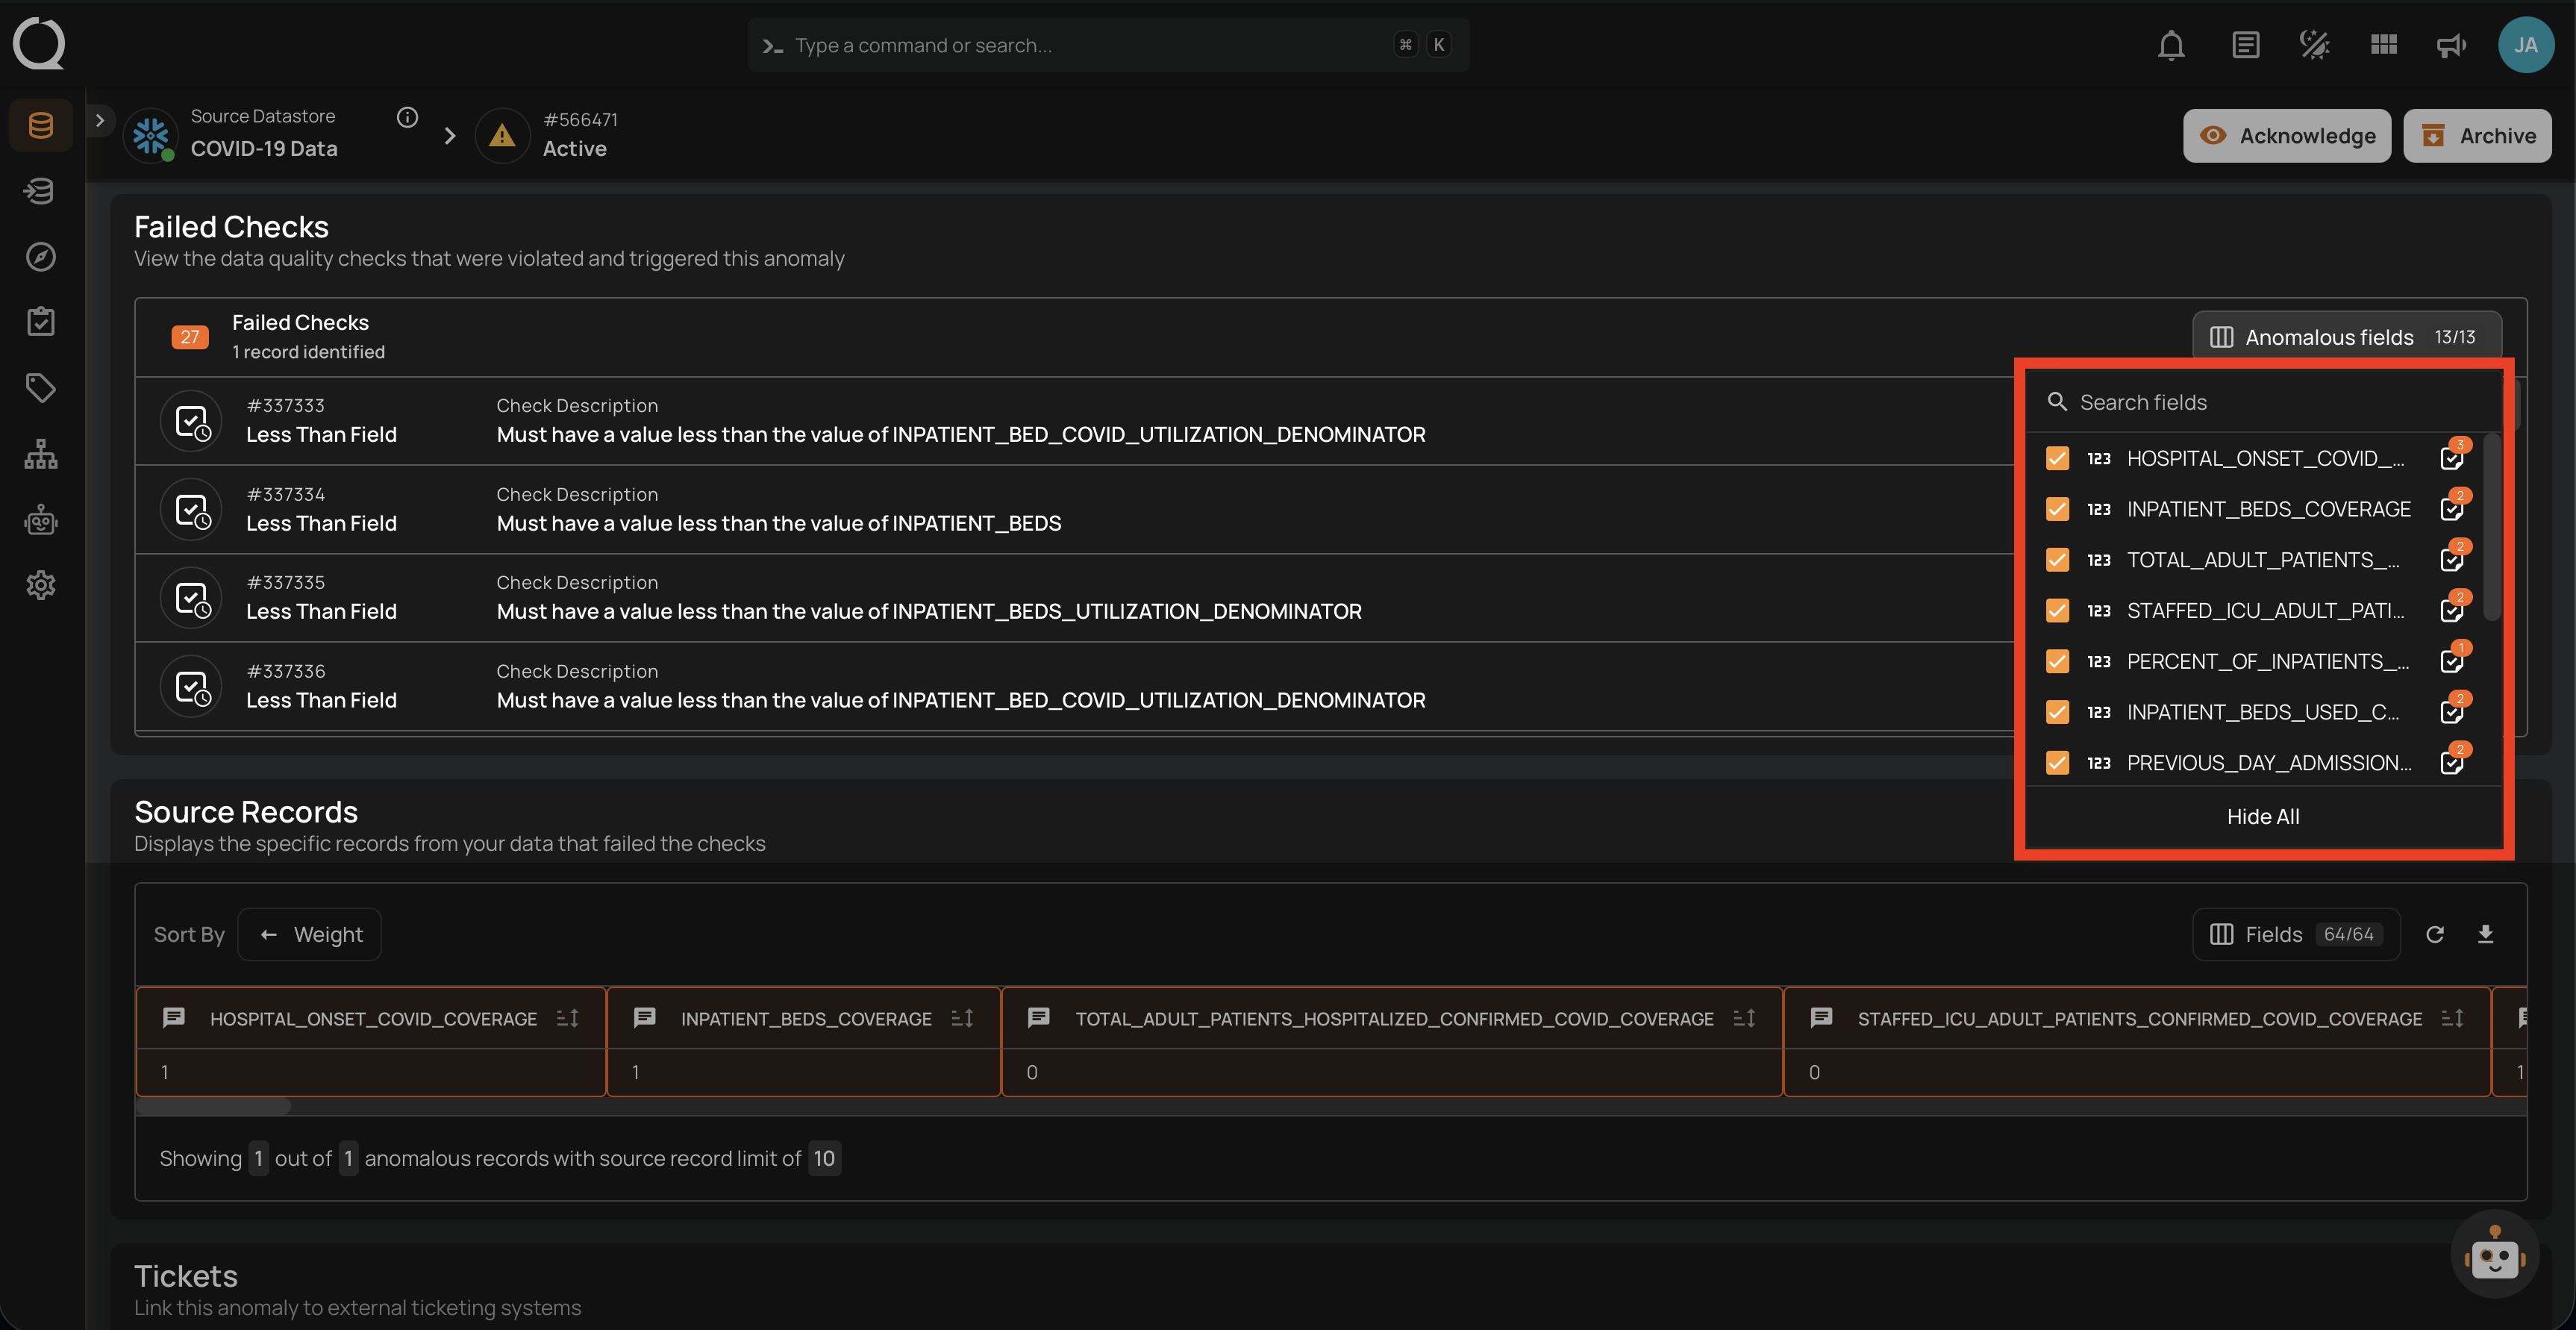
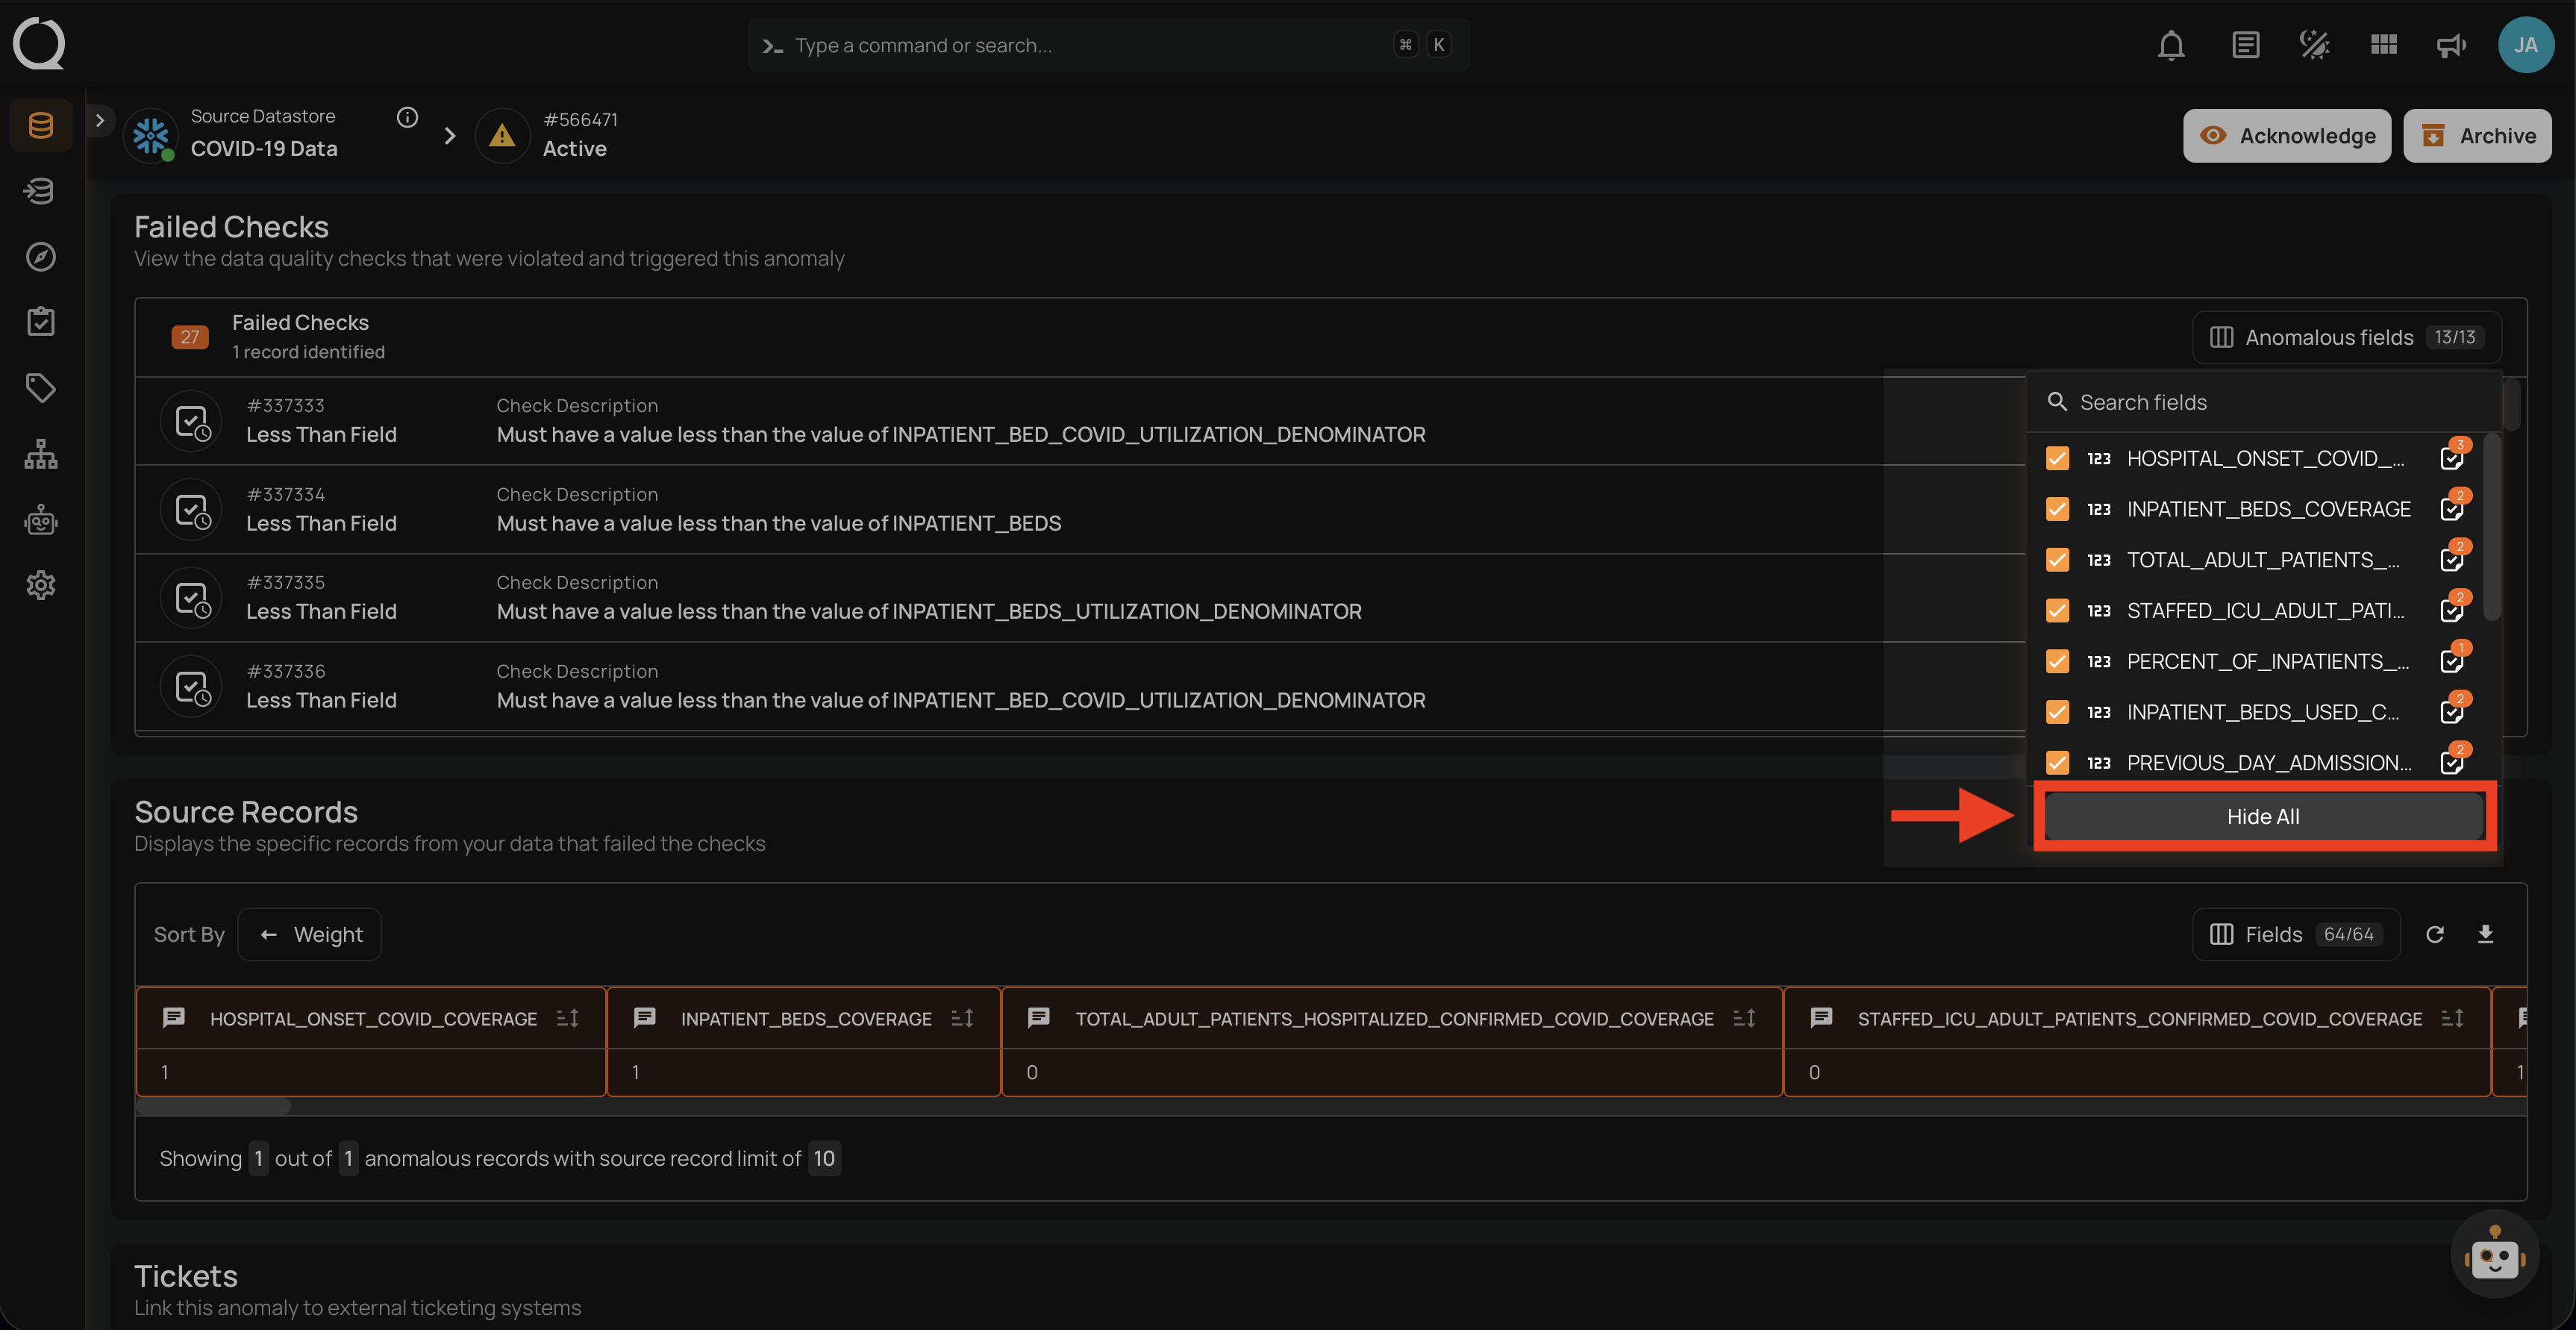
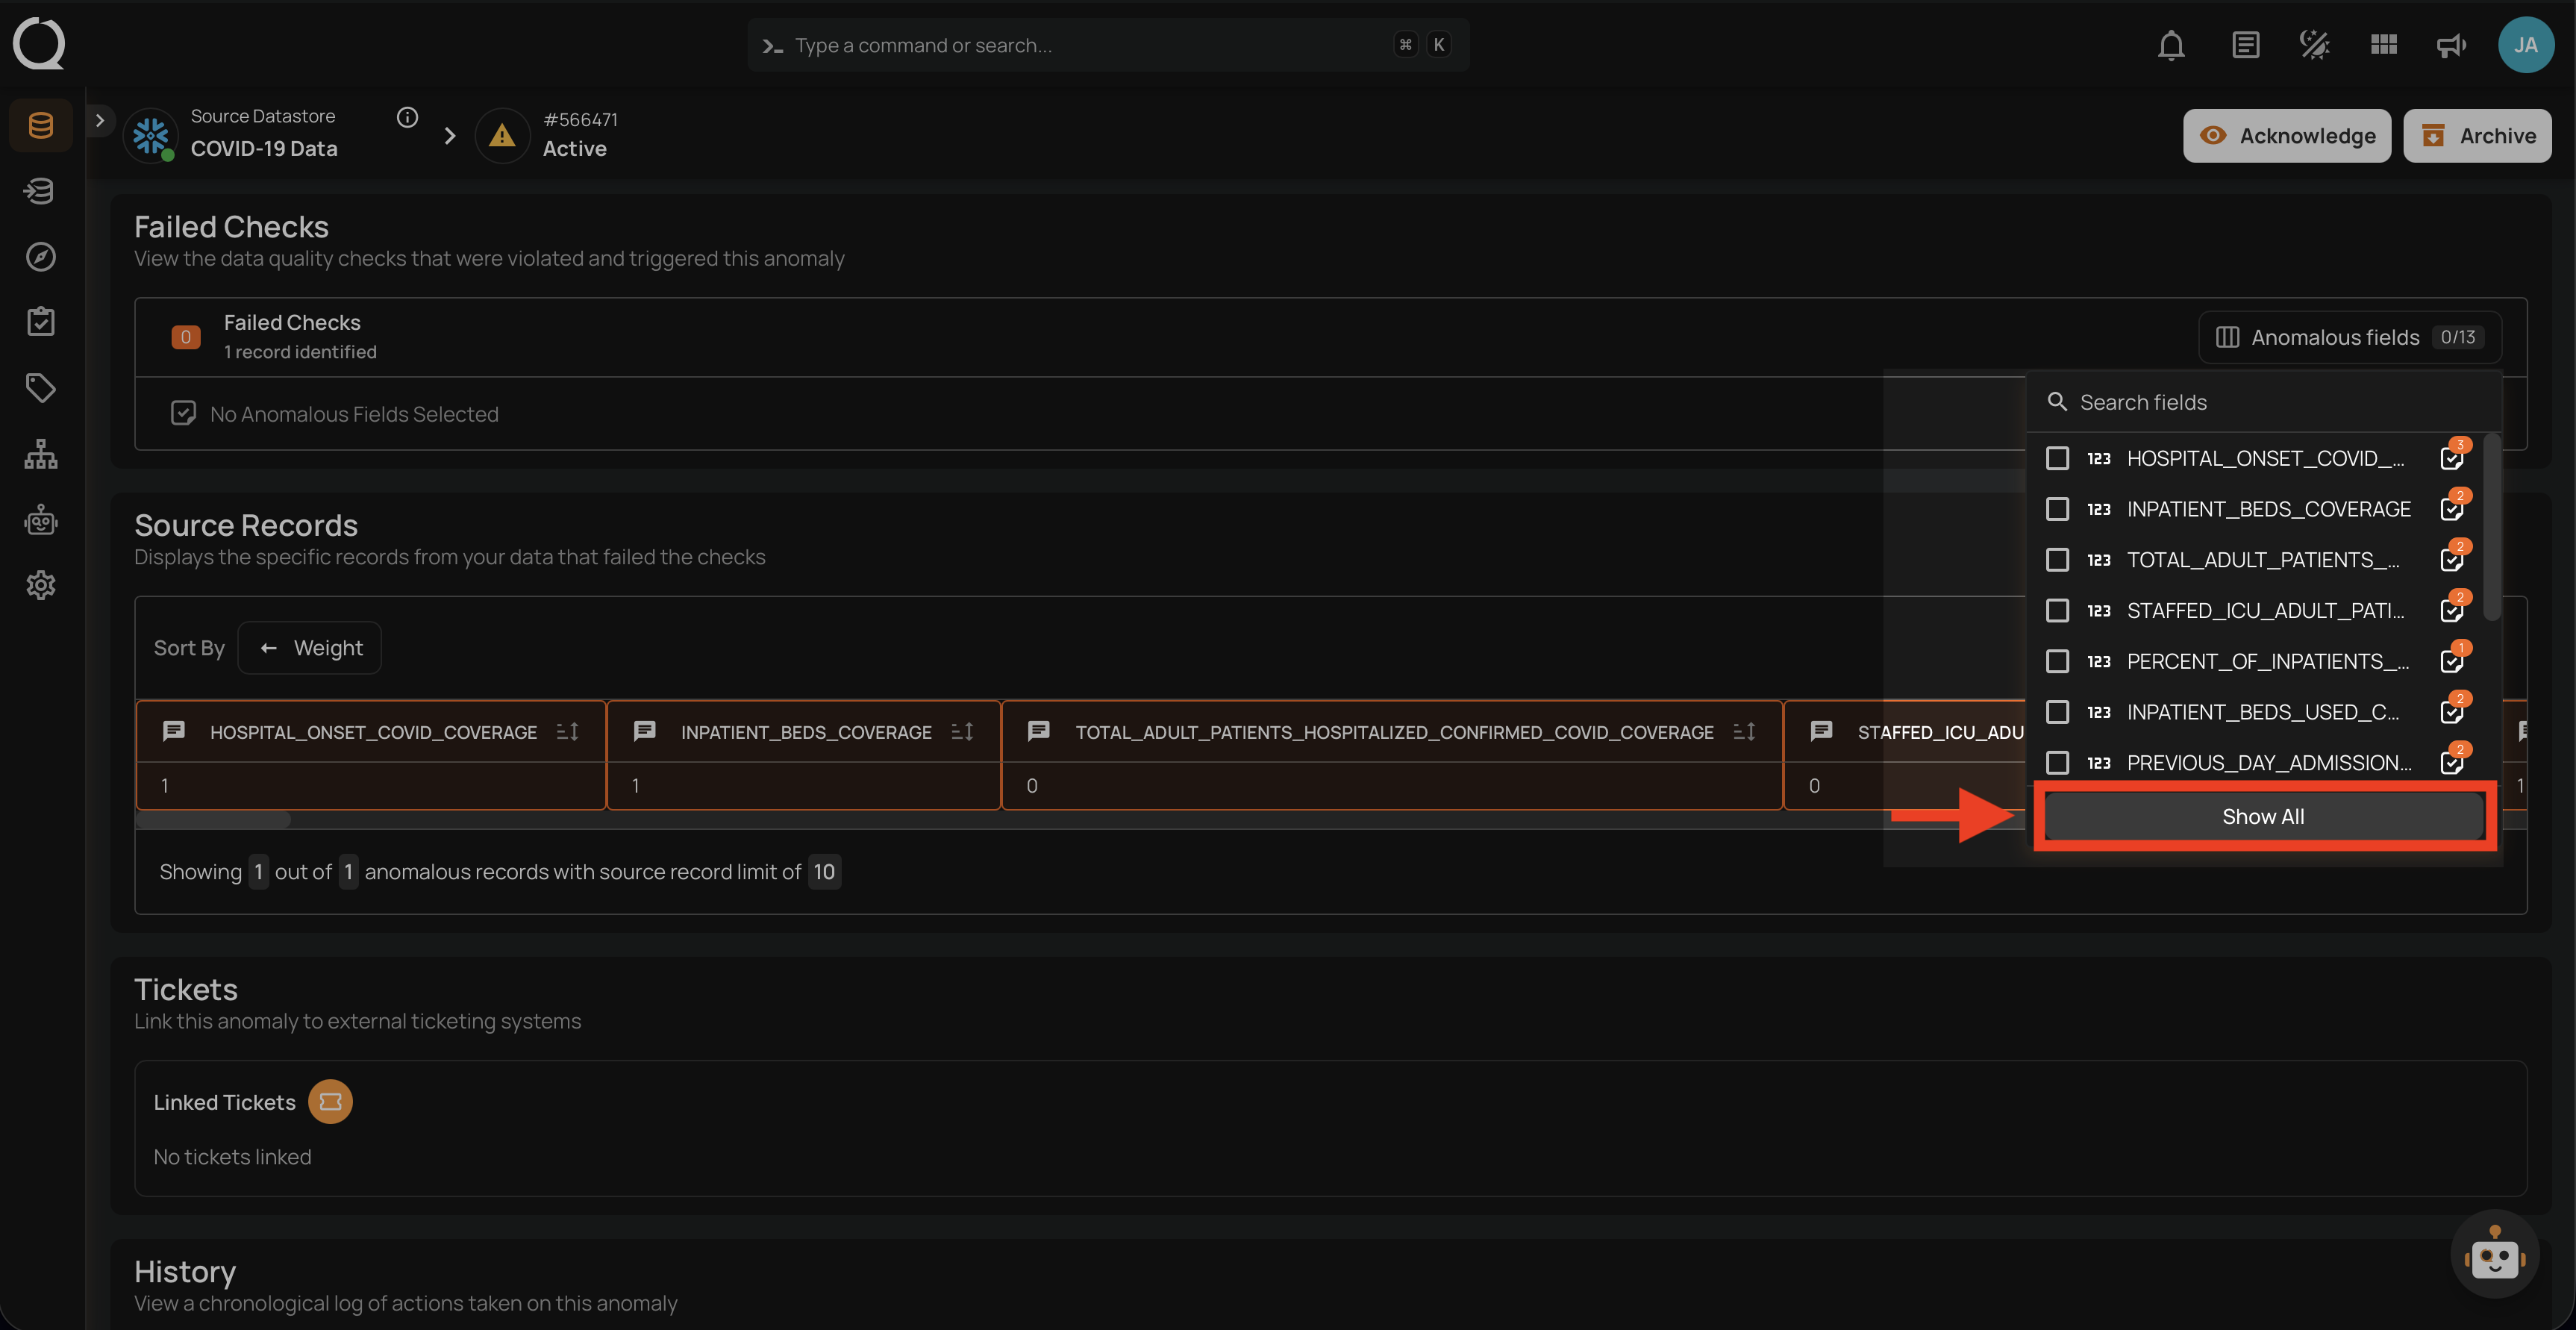
Use the Hide All option at the bottom of the dropdown to deselect all fields at once. When all fields are hidden, the option changes to Show All, allowing you to re-enable them.
Source Records
The Source Records section displays the rows and fields tied to the detected anomaly, sourced from the linked Enrichment Destination. For visualization, sorting, field selection, refresh, download, masked-field handling, and comparison records, see Source Records.
Tickets
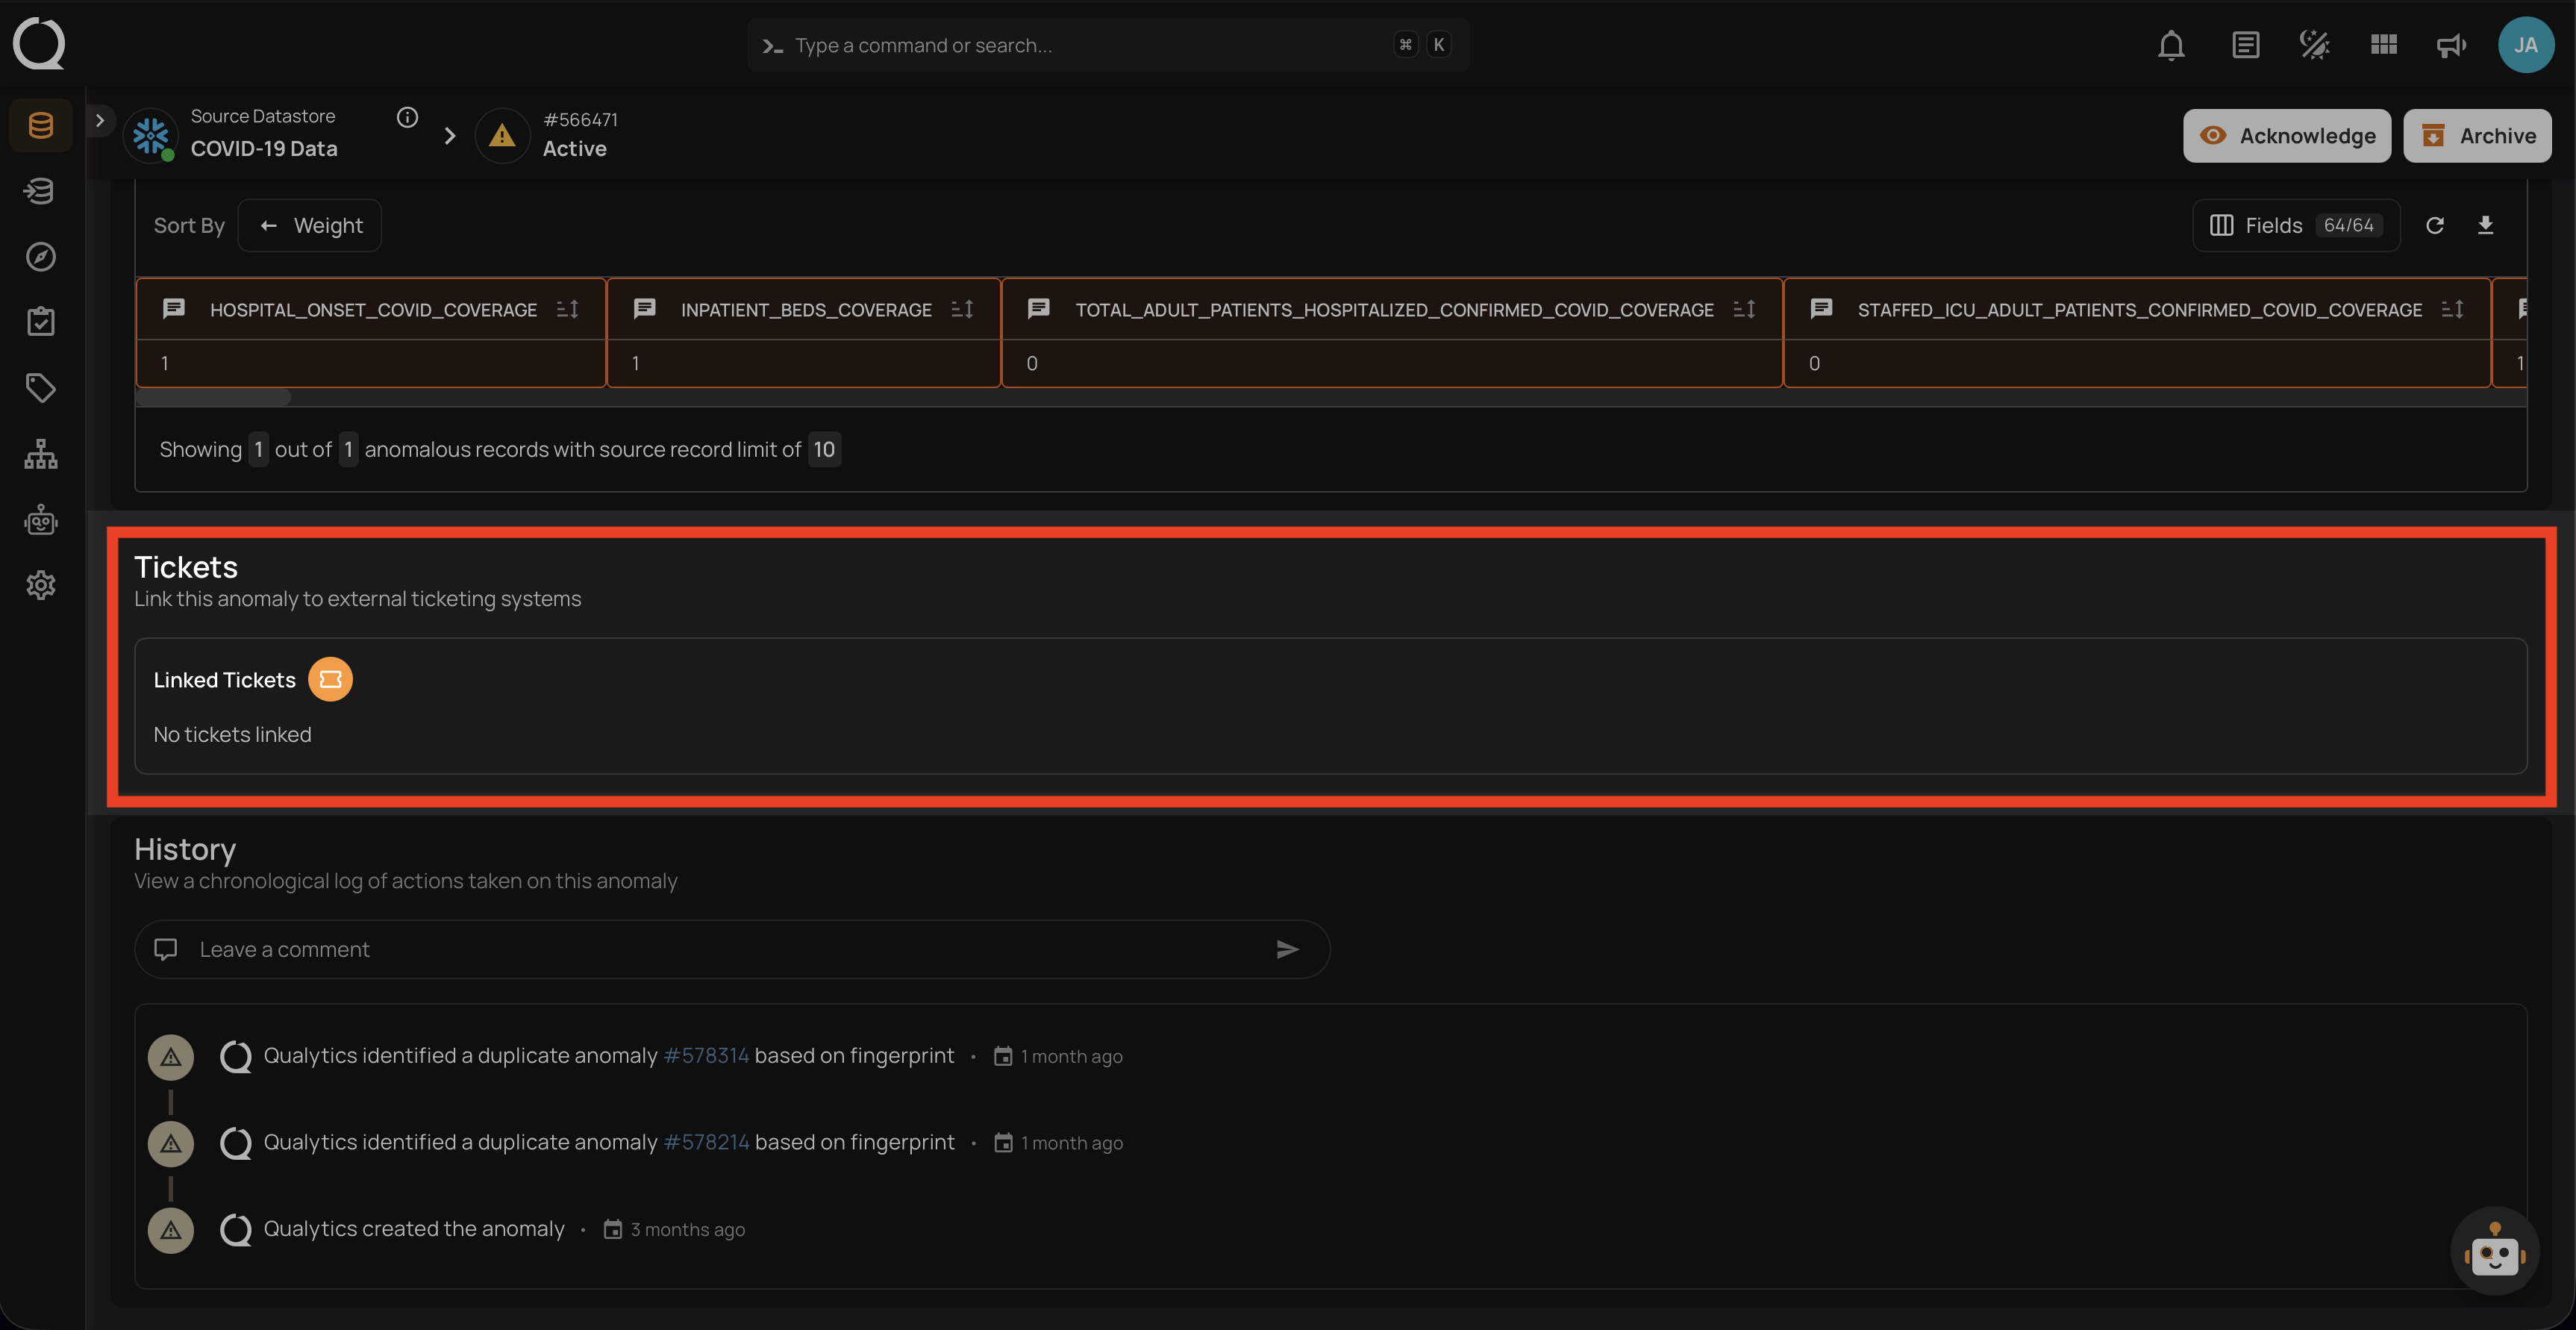
The Tickets section allows you to link the anomaly to external ticketing systems for tracking and resolution workflows. This integration helps bridge data quality issues with your team's existing project management tools. Qualytics currently supports ServiceNow and Jira Cloud integrations. Each ticket card shows the ticket's current status and title as read back from the external system, and the last synced timestamp shows when that read-back last happened. The anomaly's own status changes only when the integration's Anomaly status sync mapping says so.
Warning
Before using the Tickets feature, you must first configure a ticketing integration (ServiceNow or Jira) in the platform settings. For setup instructions, see the Ticketing Integrations page.
Info
Linking, creating, and unlinking tickets requires at least the Author team permission on the respective datastore, plus the platform-wide Manager user role (or higher). For more details, see the Team Permissions page.
Linking an Existing Ticket
You can link an existing ticket from your external ticketing system to an anomaly for tracking purposes.
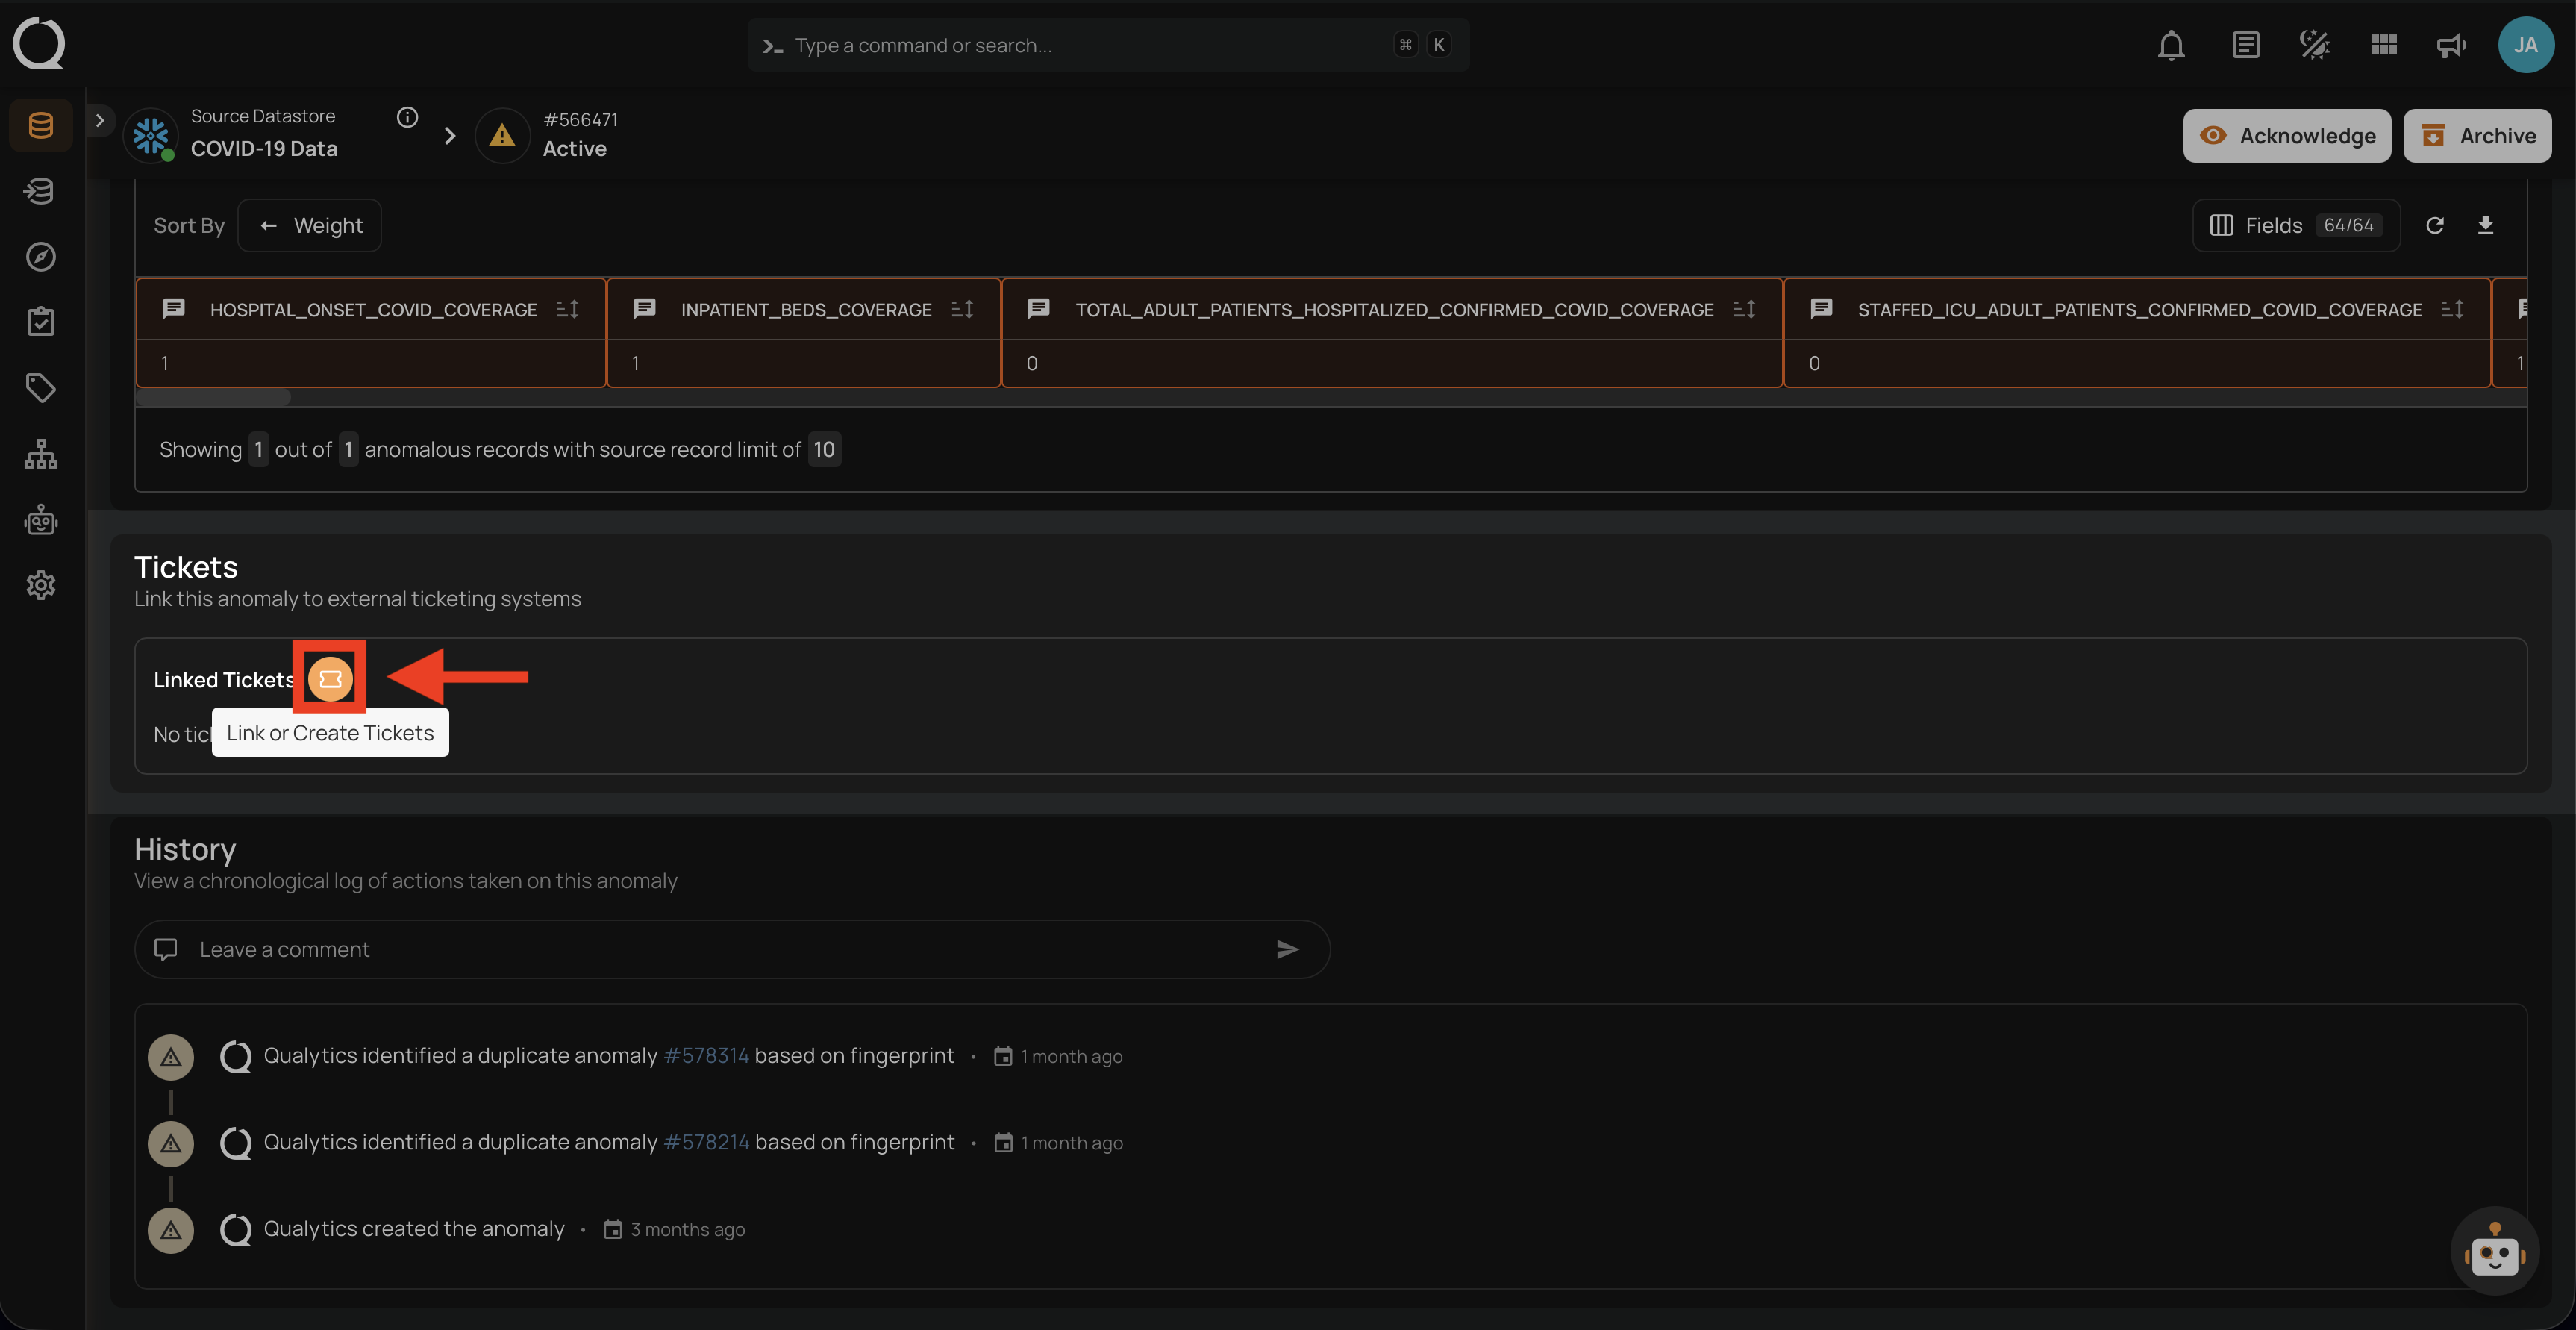
Step 1: Click the Link or create ticket button in the Tickets section header to open the Link Ticket dialog.
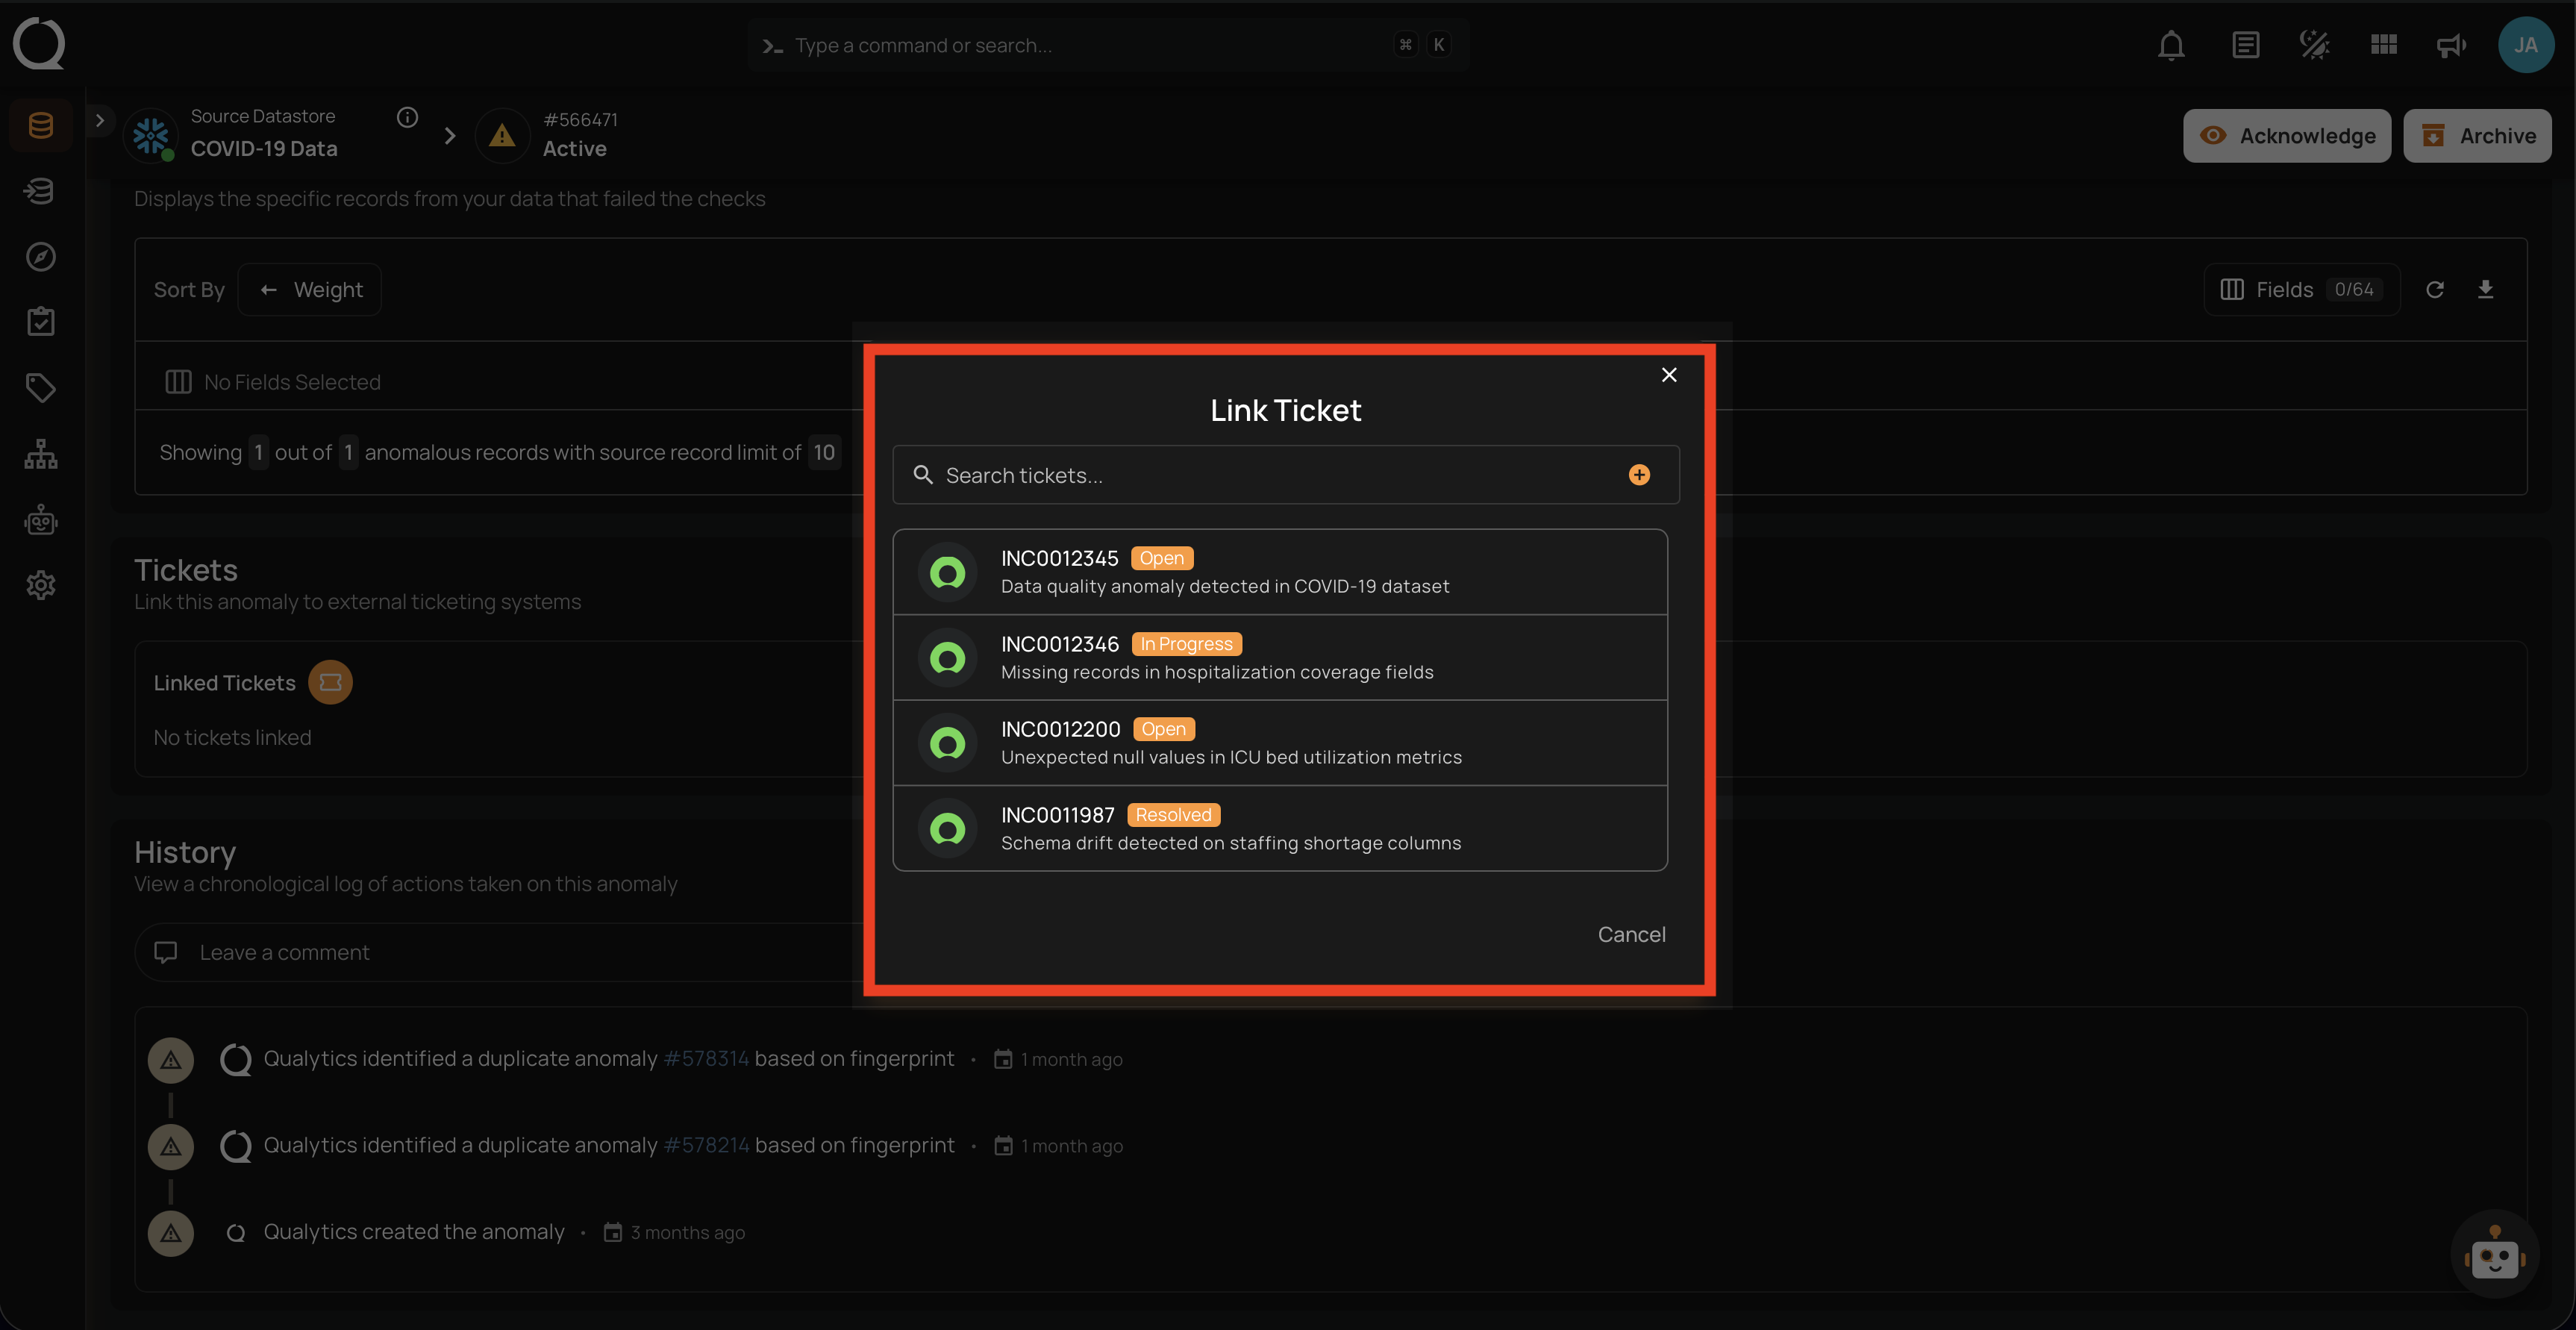
Step 2: The Link Ticket dialog lists the most recently updated tickets by default. Use the search field to find another ticket, then select the one you want to link. Jira integrations with more than one allowed project also show a Project selector to narrow the list.
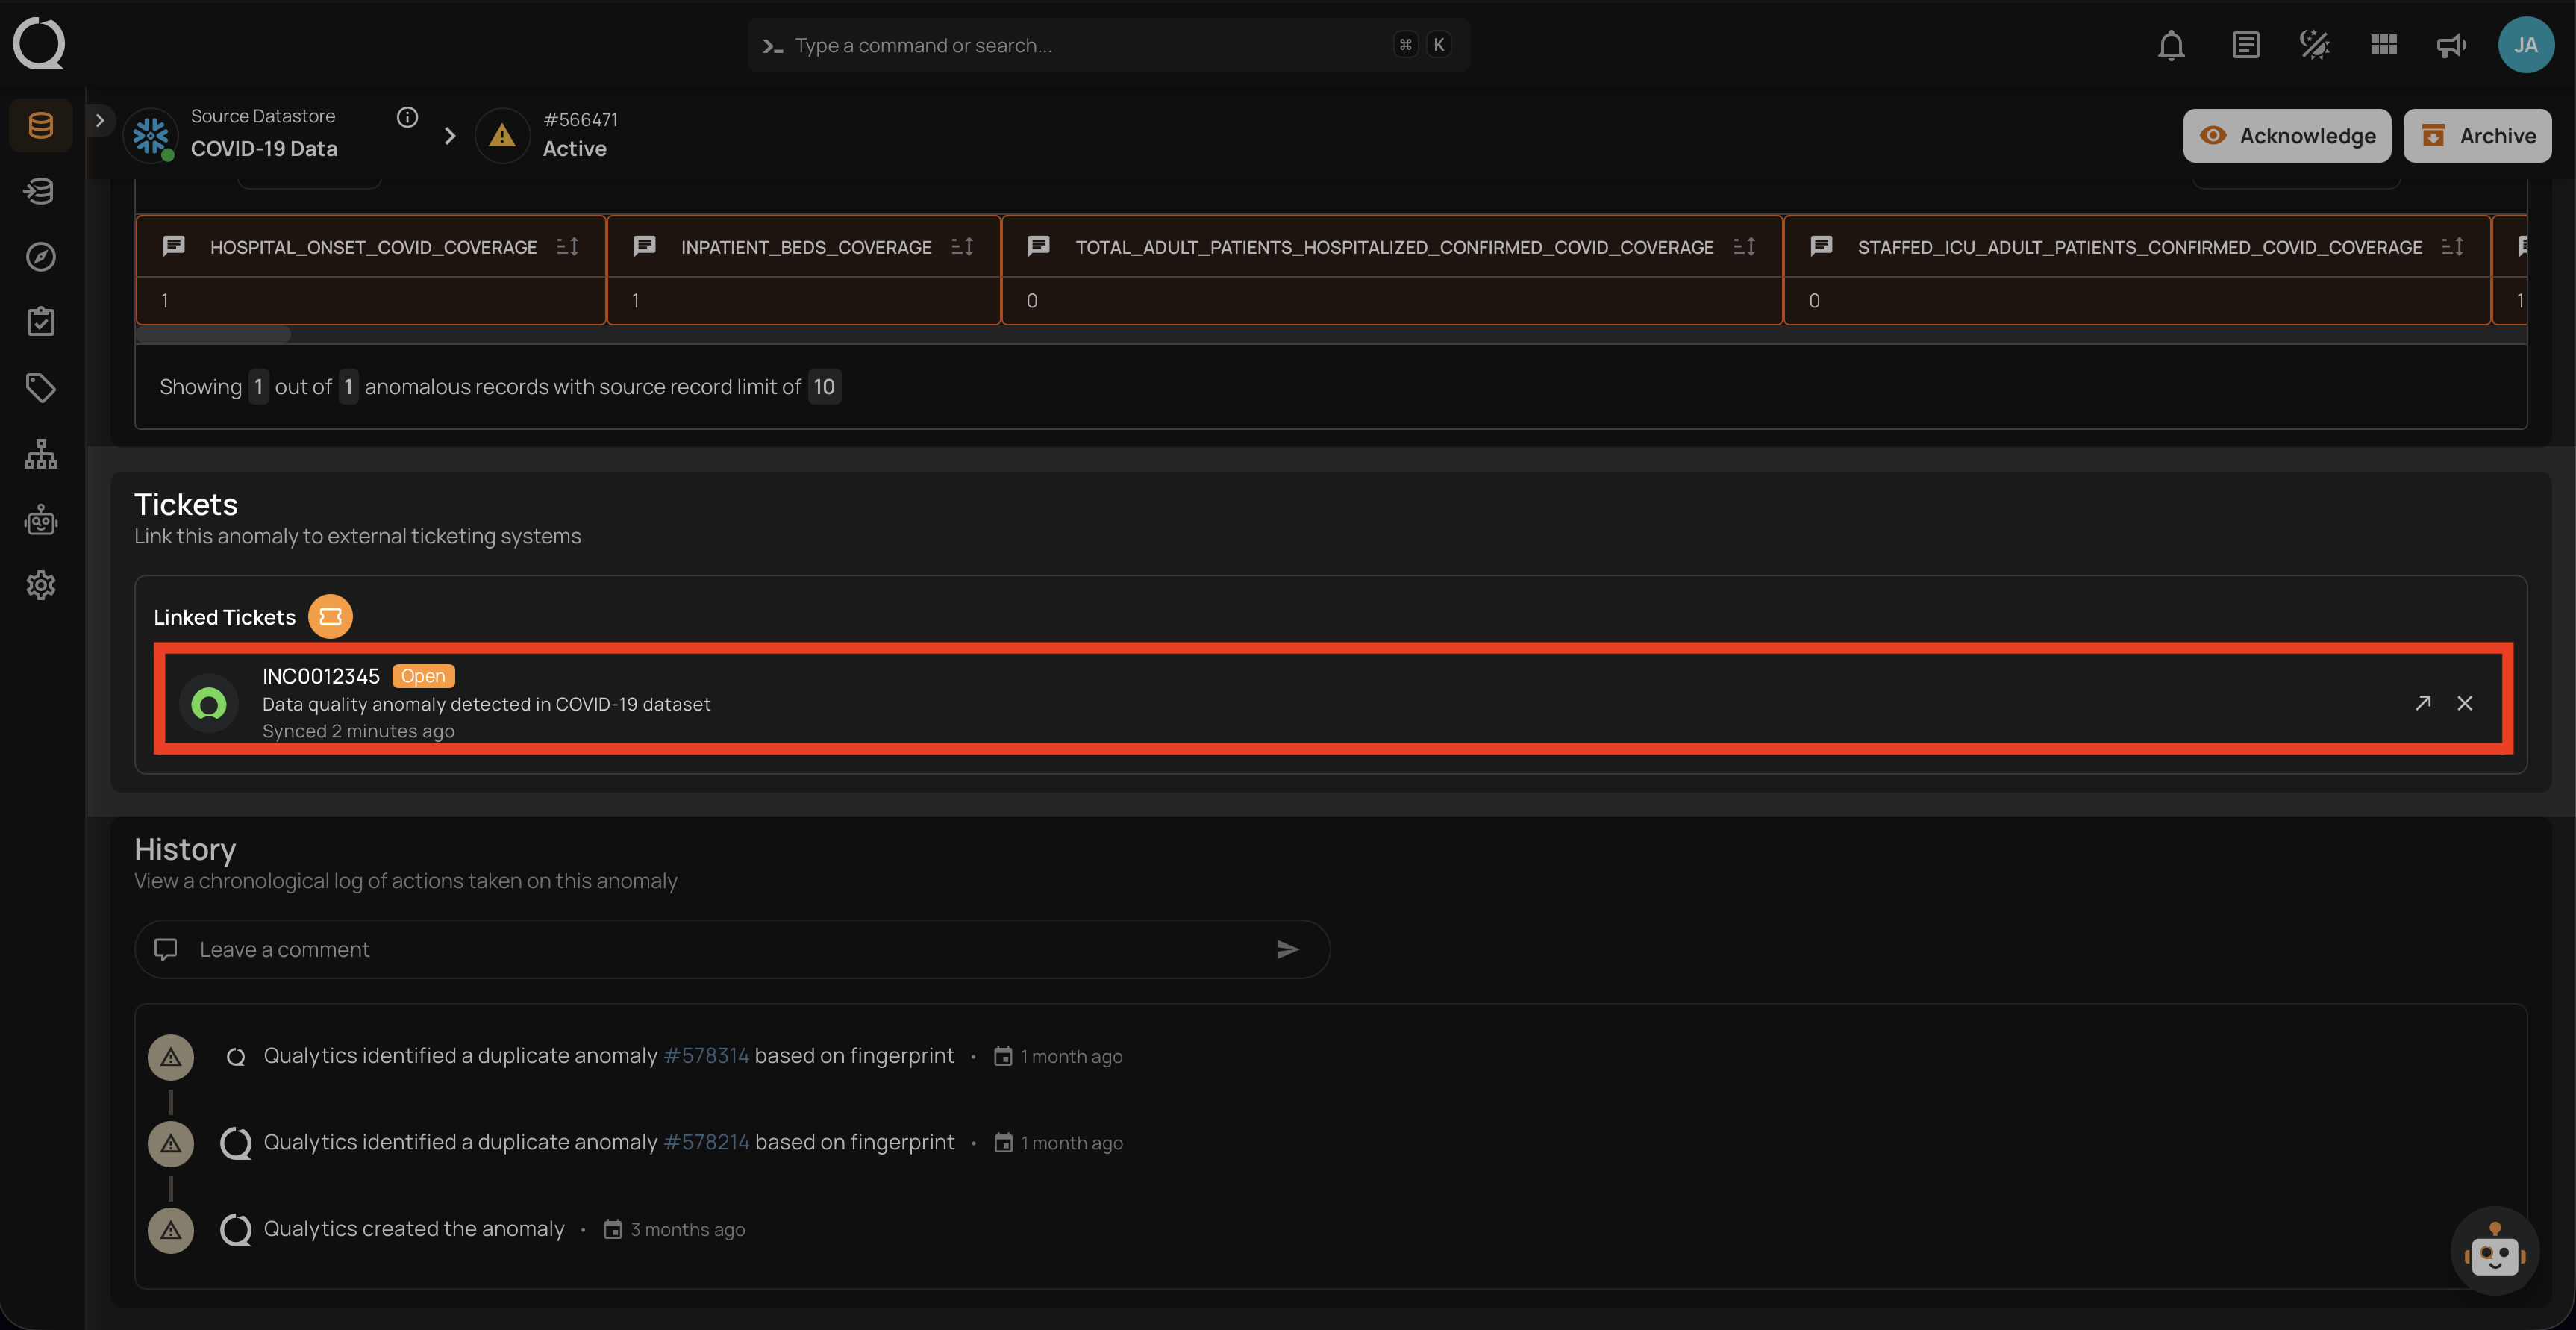
Step 3: The ticket will appear in the Tickets section as a linked card, displaying the ticket number, status badge, description, and the last synced timestamp.
Creating a New Ticket
If no existing ticket matches the anomaly, you can create a new one directly from the anomaly details.
Note
There is no limit to the number of tickets that can be linked to a single anomaly. However, the same ticket cannot be linked to the same anomaly more than once.
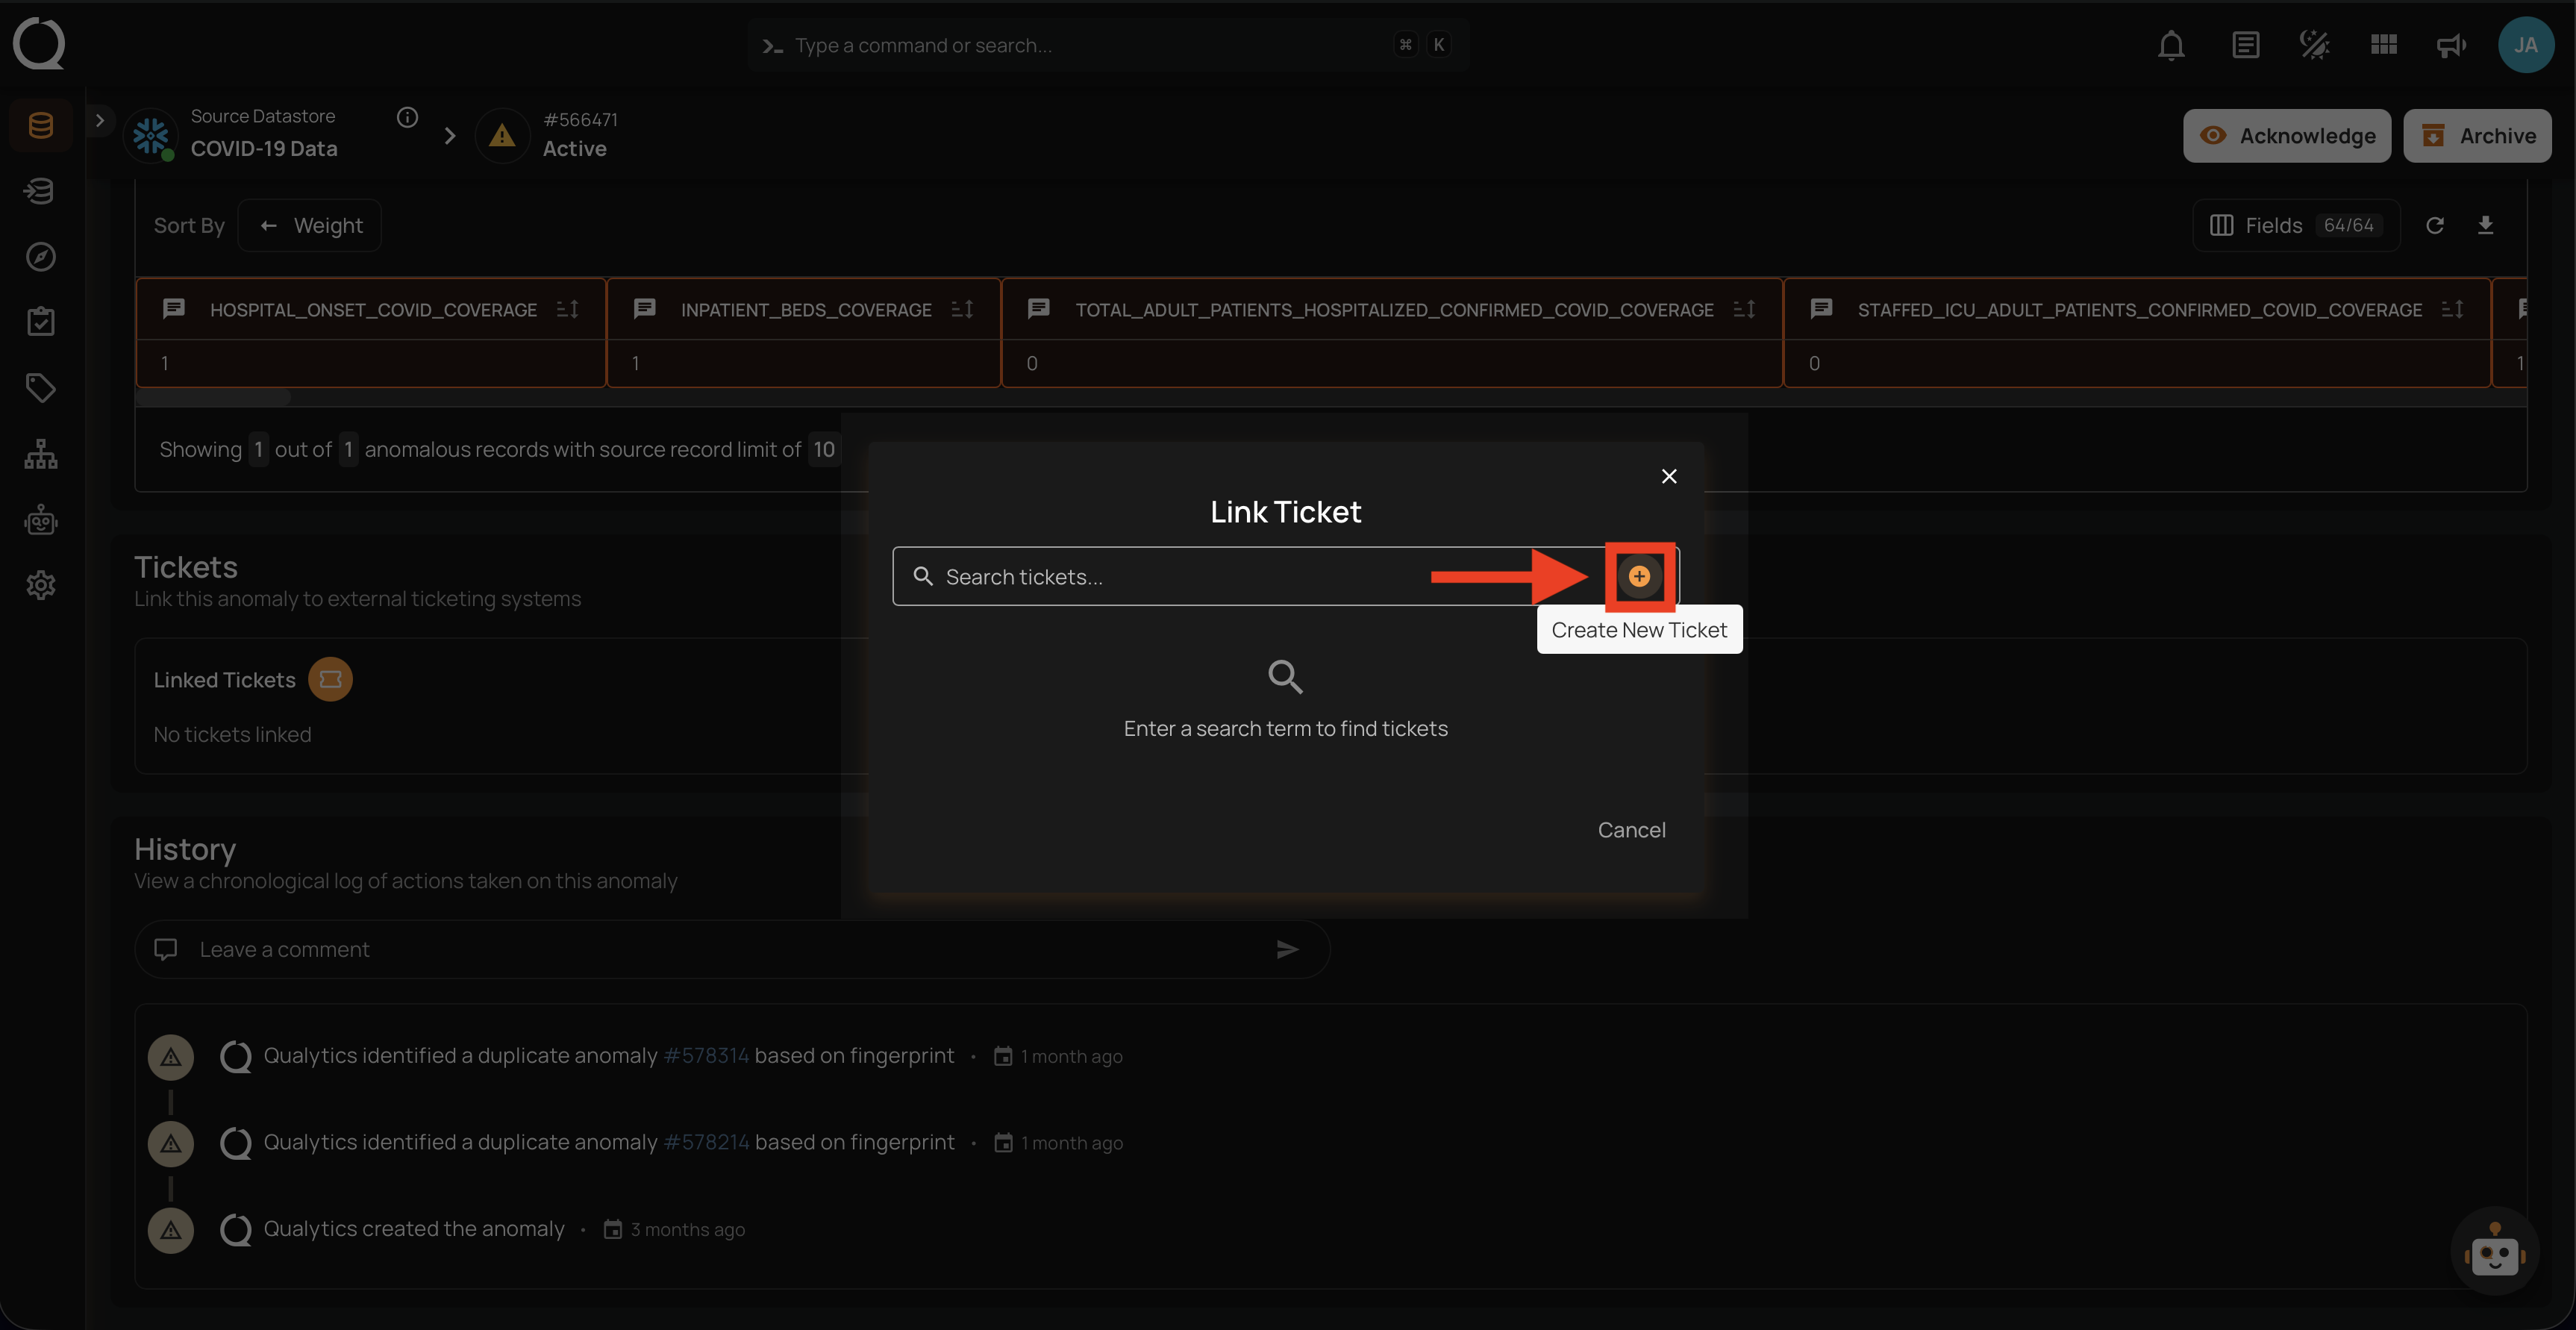
Step 1: Click the Link or create ticket button to open the Link Ticket dialog, then click the Create New Ticket button in the dialog footer.
Step 2: Fill in the ticket form fields. The available fields depend on the configured ticketing system.
ServiceNow
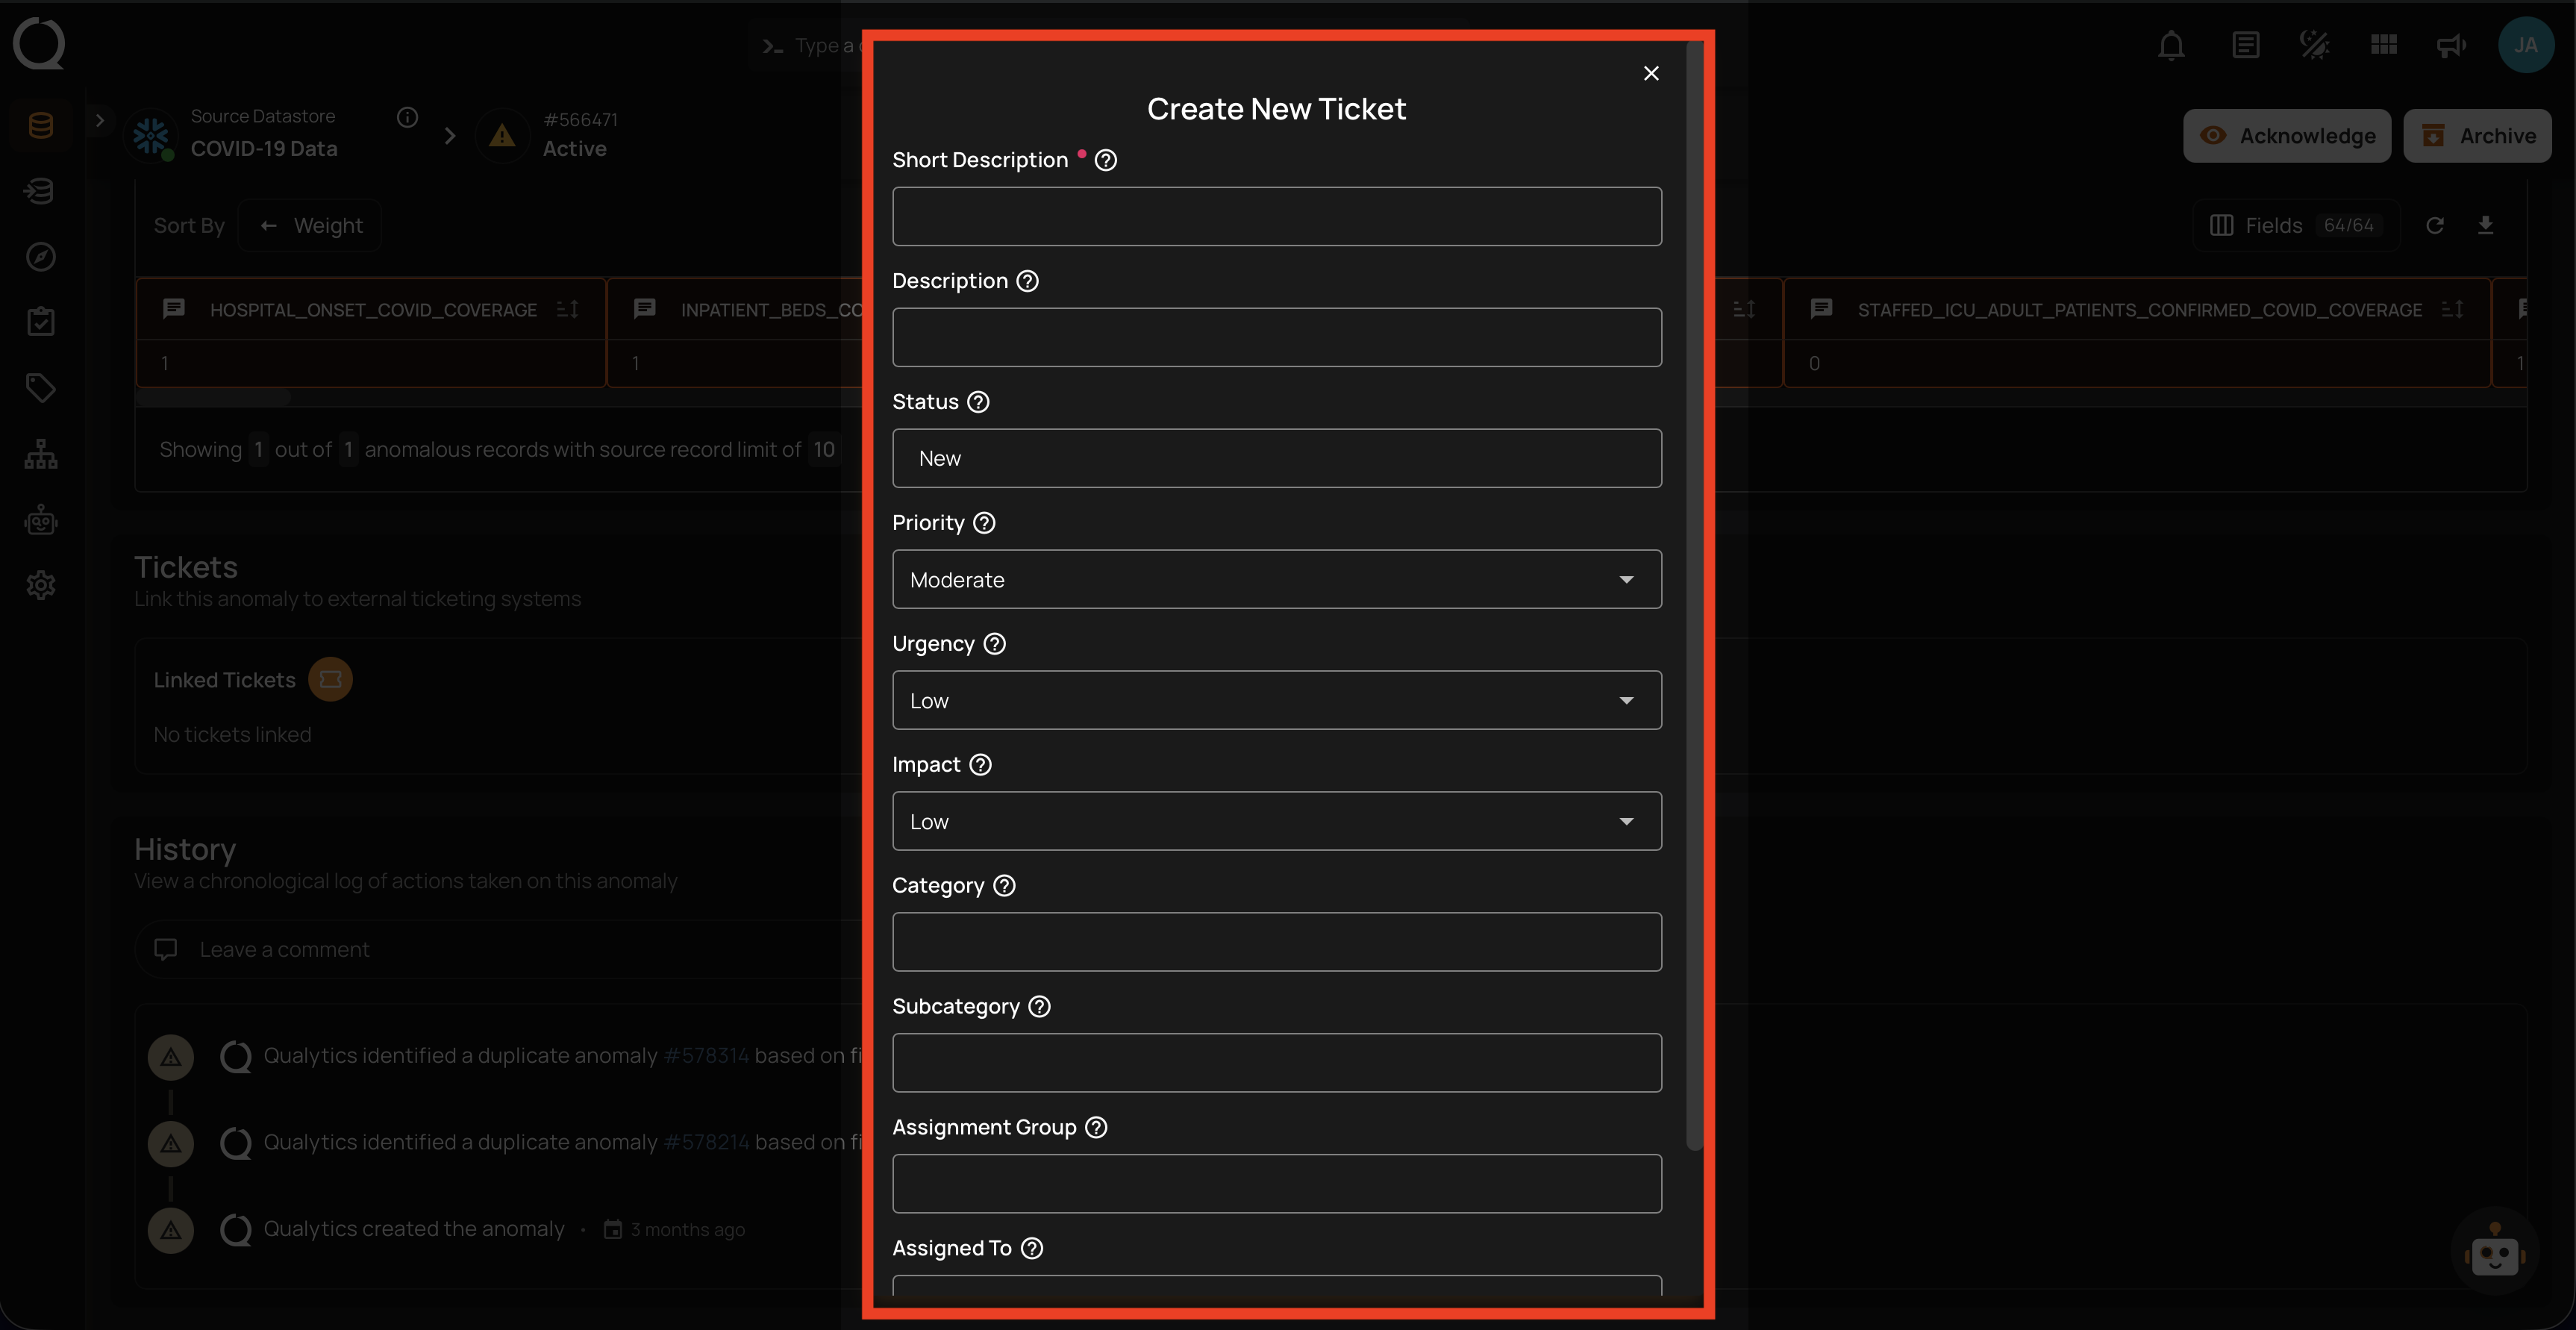
| Field | Description |
|---|---|
| Short Description * | A brief summary of the data quality issue. |
| Description | A detailed explanation of the anomaly and its impact. |
| Status | The initial incident status. Supports text names (New, In Progress, On Hold, Resolved, Closed, Canceled) or numeric codes (1, 2, 3, 6, 7, 8). |
| Priority | The ticket priority level (Critical, High, Moderate, Low, Planning). |
| Urgency | How quickly the incident needs to be resolved (High, Medium, Low). |
| Impact | The impact of the incident on business operations (High, Medium, Low). |
| Category | The ServiceNow incident category for classification. |
| Subcategory | A more specific classification within the selected category. |
| Assignment Group | The group responsible for resolving the ticket (sys_id). |
| Assigned To | The individual assigned to work on the ticket (sys_id). |
* Required field.
Jira
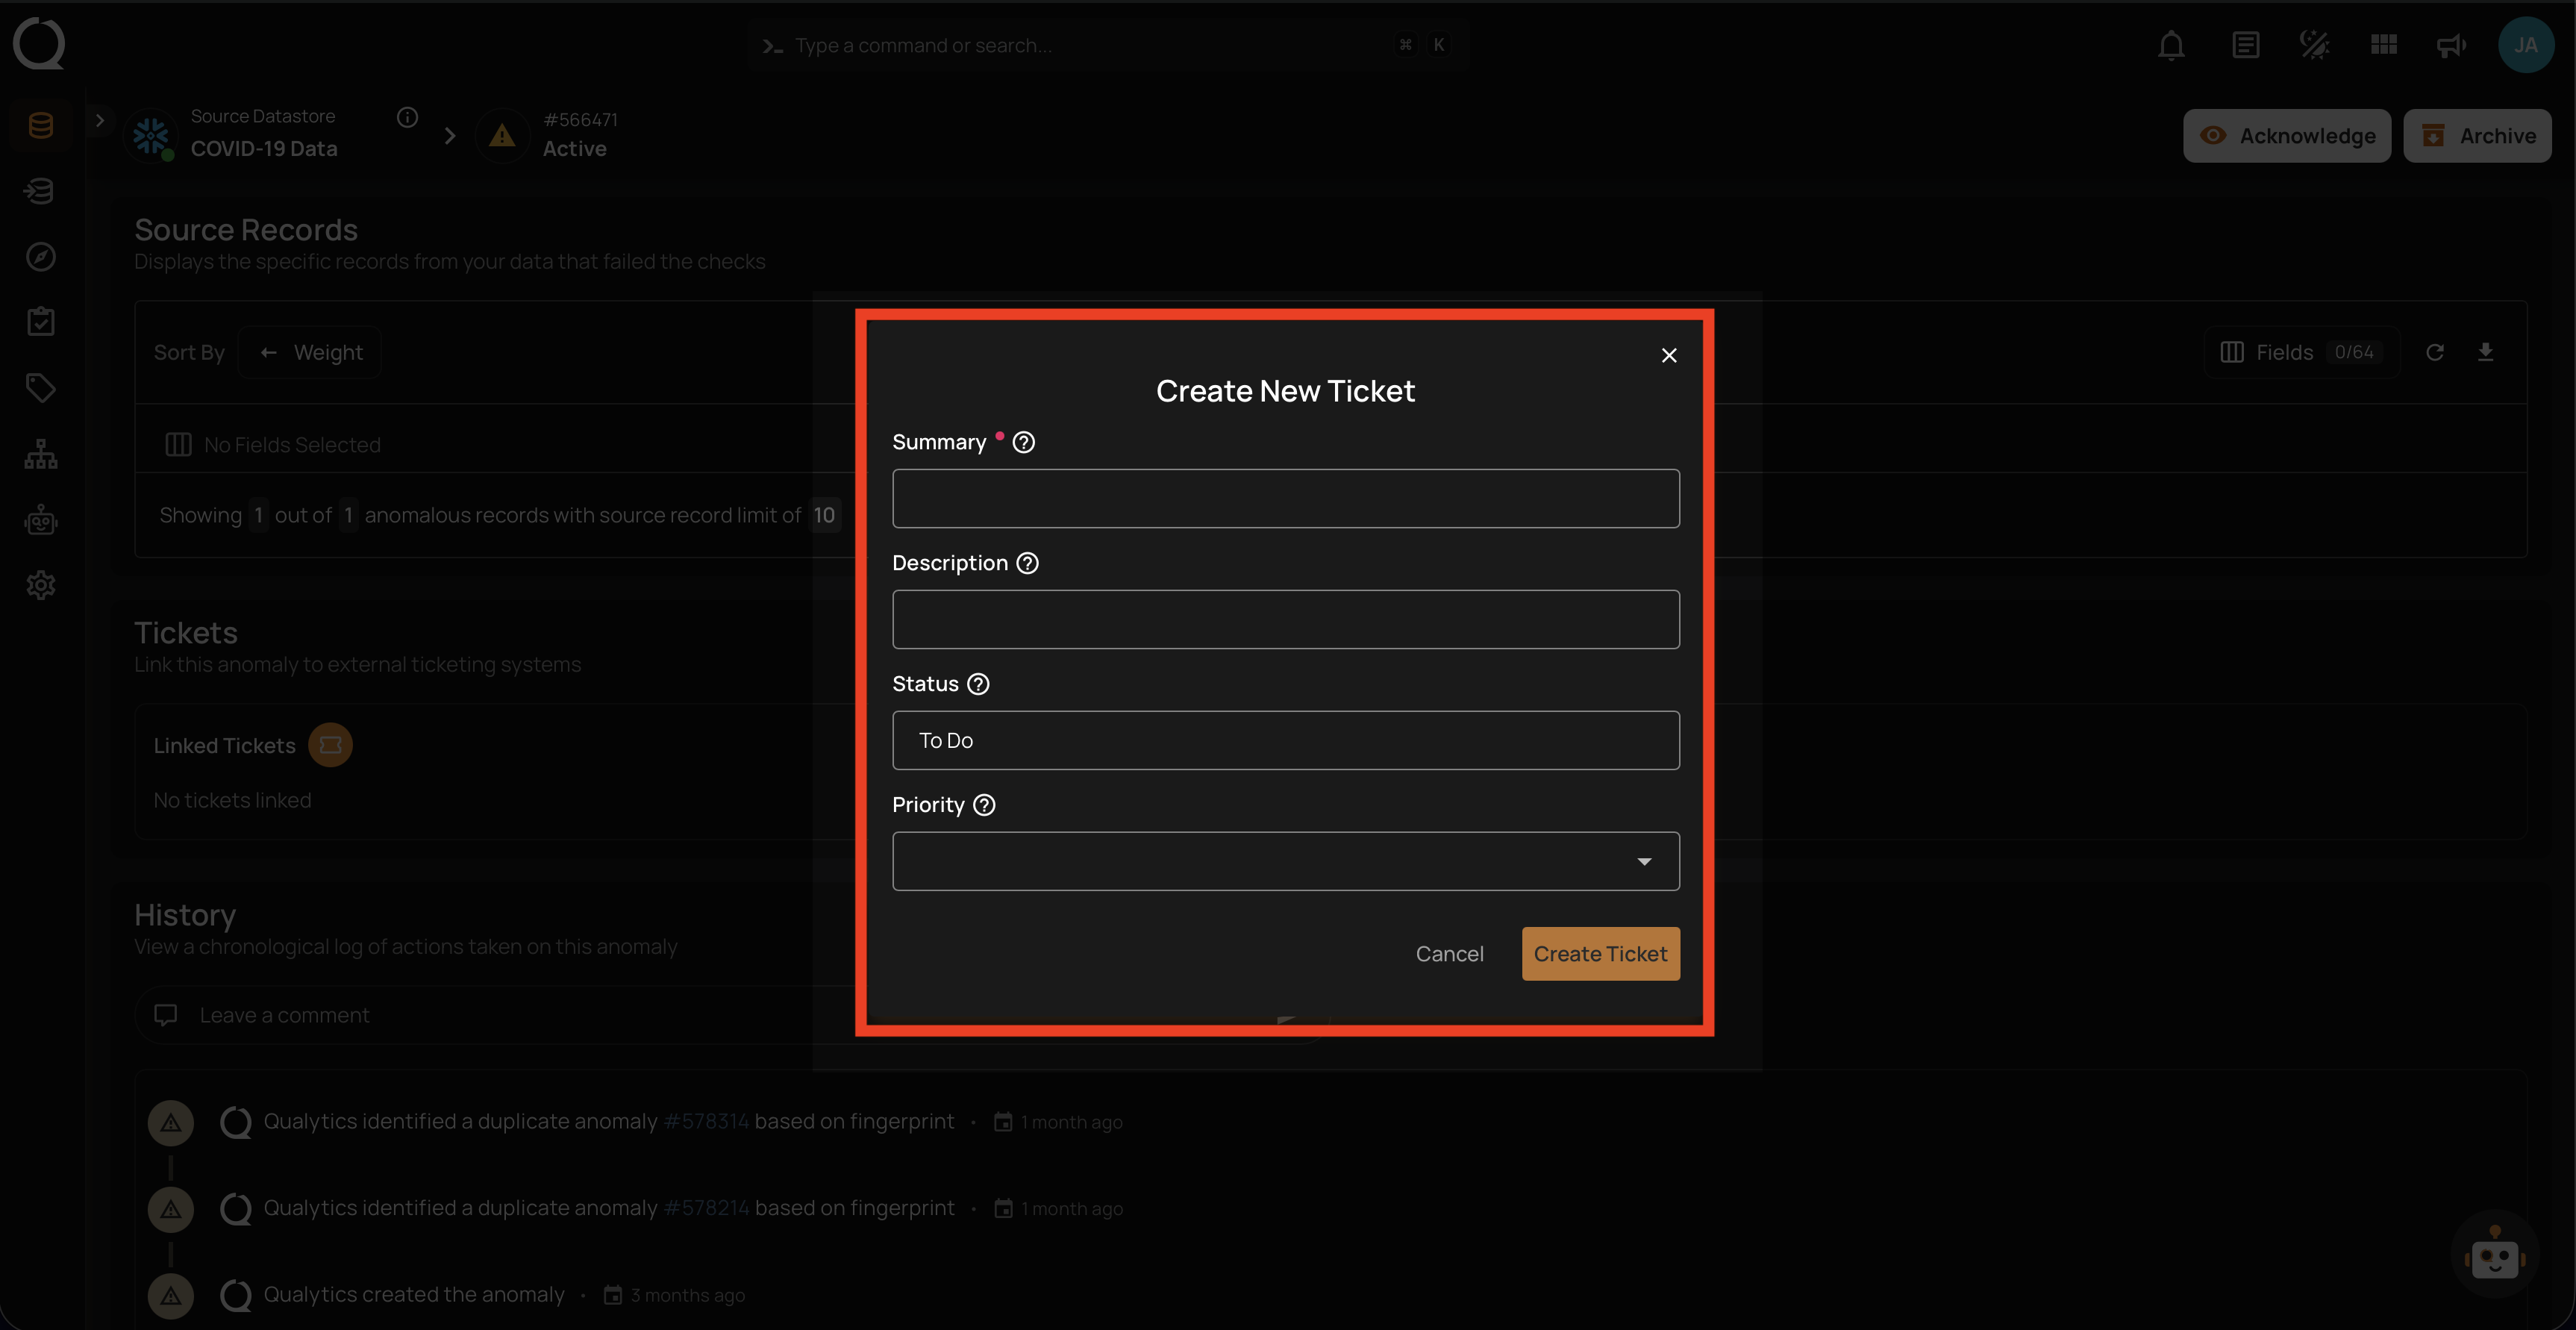
| Field | Description |
|---|---|
| Summary * | A brief summary of the data quality issue. Pre-filled with a suggestion built from the anomaly, which you can edit. |
| Description | Pre-filled with the anomaly's description, which you can edit. The anomaly's details and location are appended automatically. |
| Status | The initial issue status. Common Jira statuses are suggested and any other can be typed. |
| Priority | The priority level of the issue (Highest, High, Medium, Low, Lowest), pre-filled from the anomaly weight. |
| Assignee | The anomaly's assignee, when they have a matching Jira account. |
* Required field.
Step 3: Click Create Ticket to submit the ticket. The new ticket will be created in the external ticketing system and automatically linked to the anomaly.
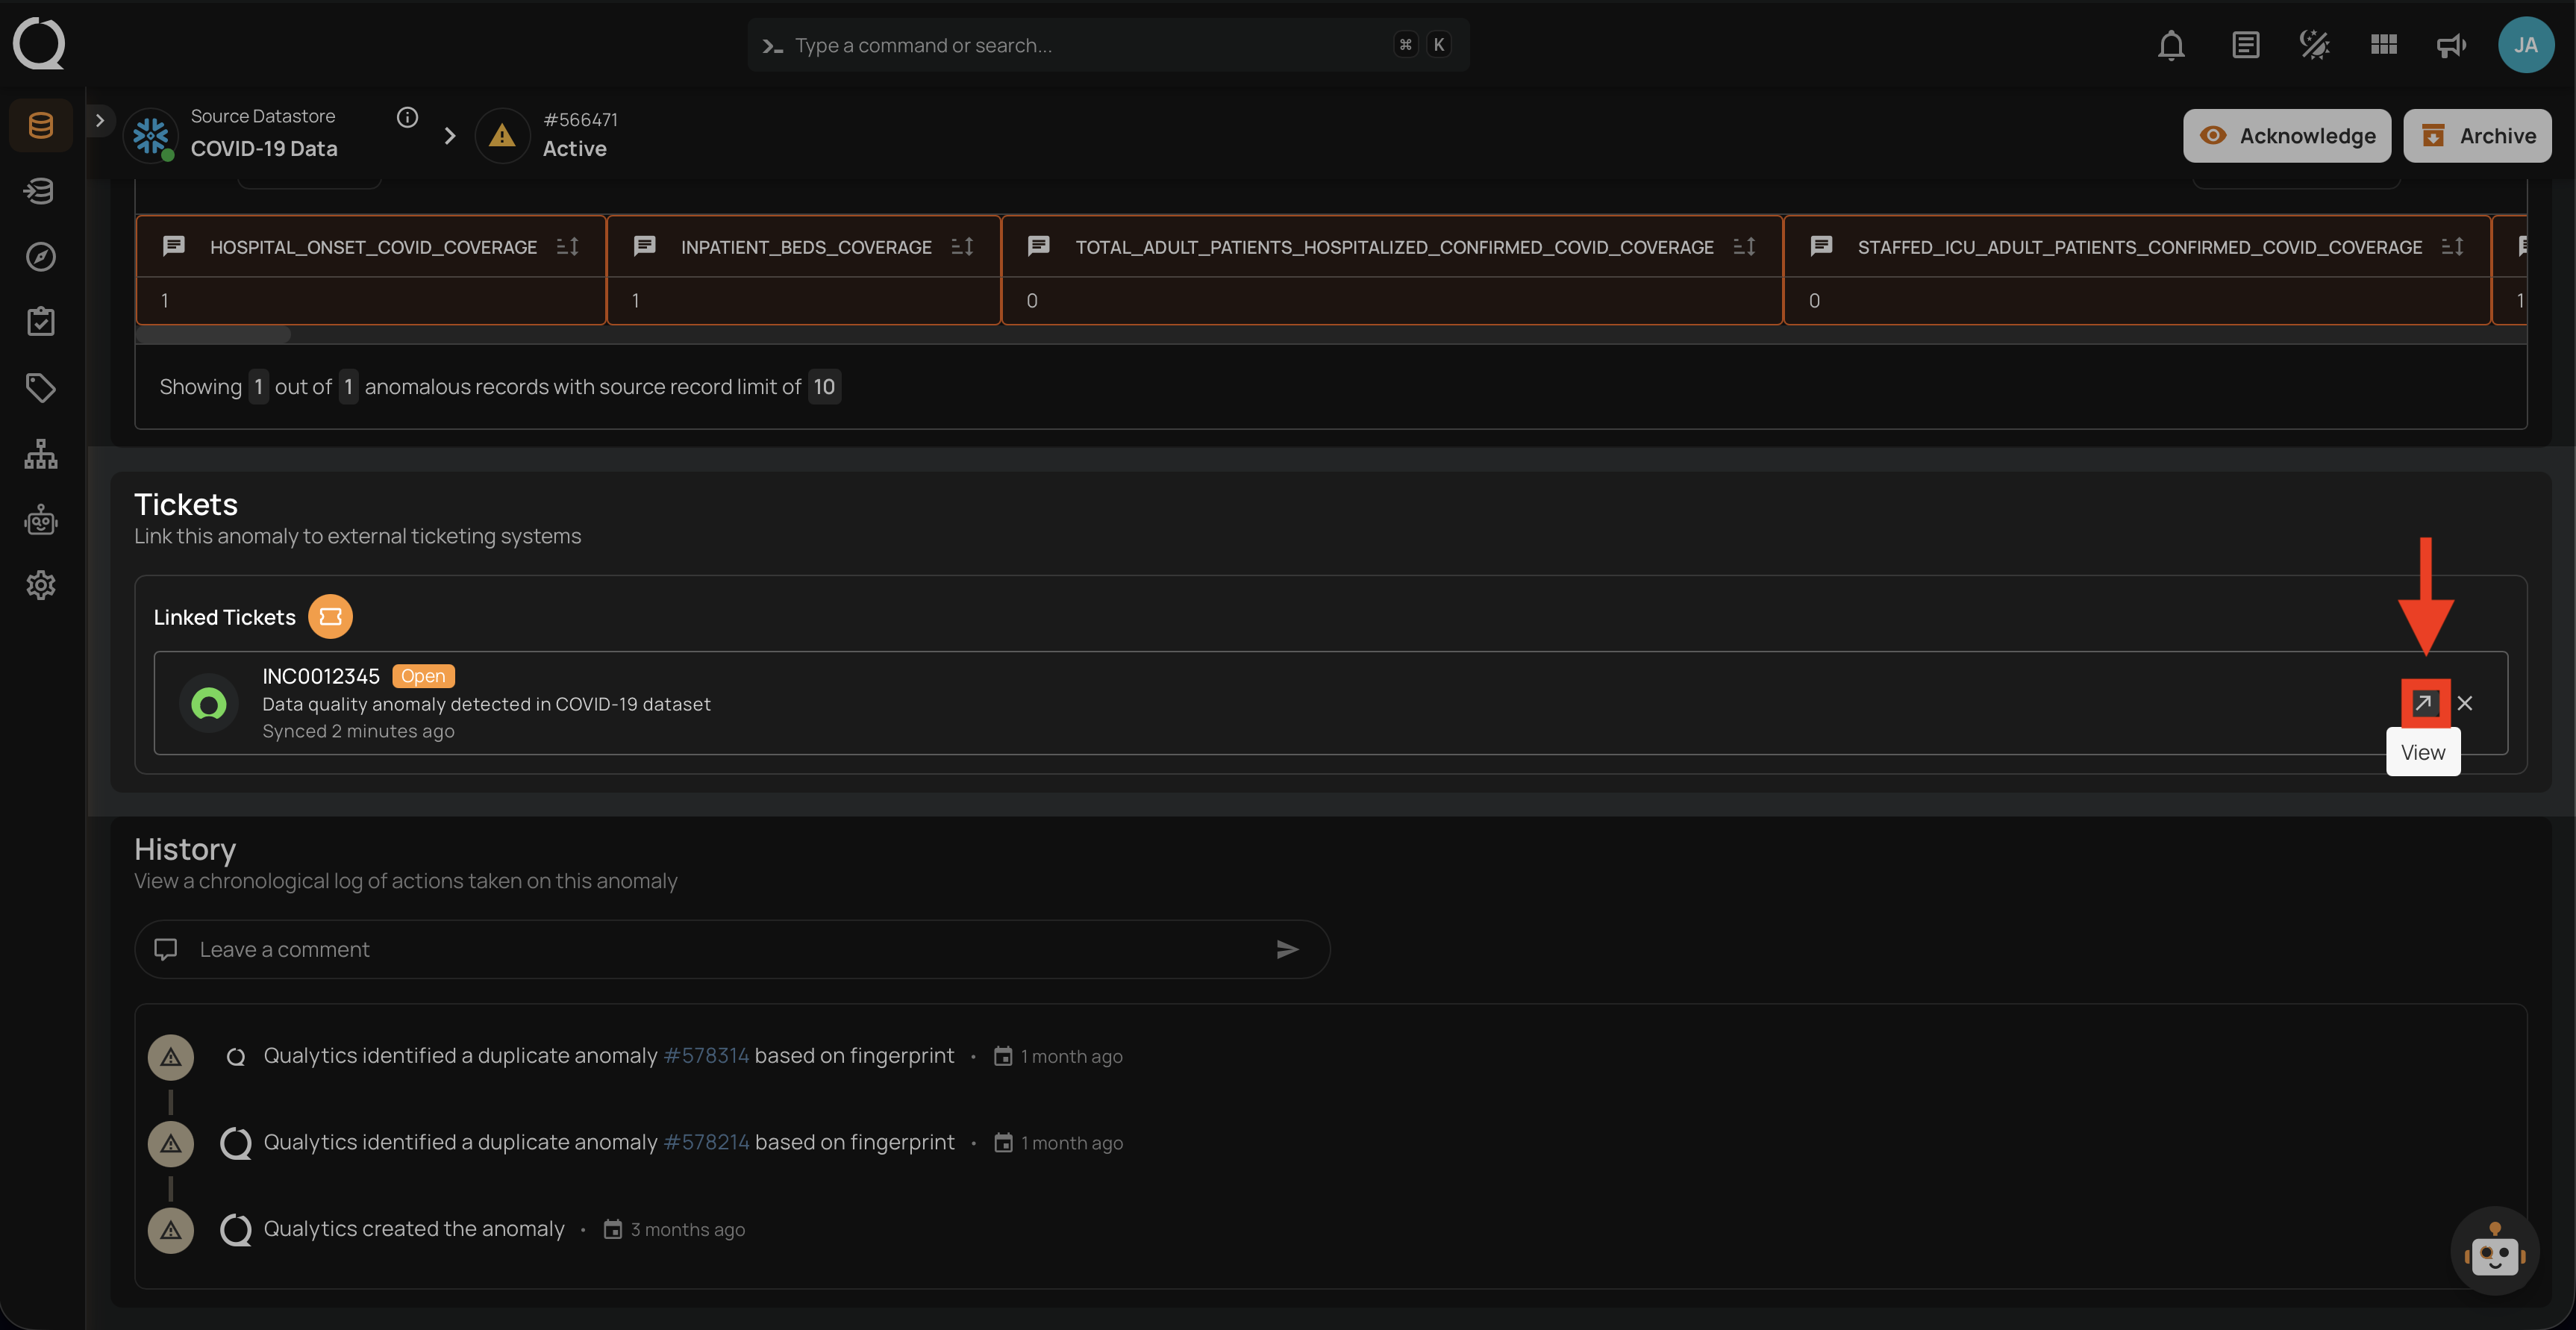
Viewing a Linked Ticket
Click the View button on a linked ticket card to open the ticket directly in the external ticketing system (ServiceNow or Jira) in a new browser tab.
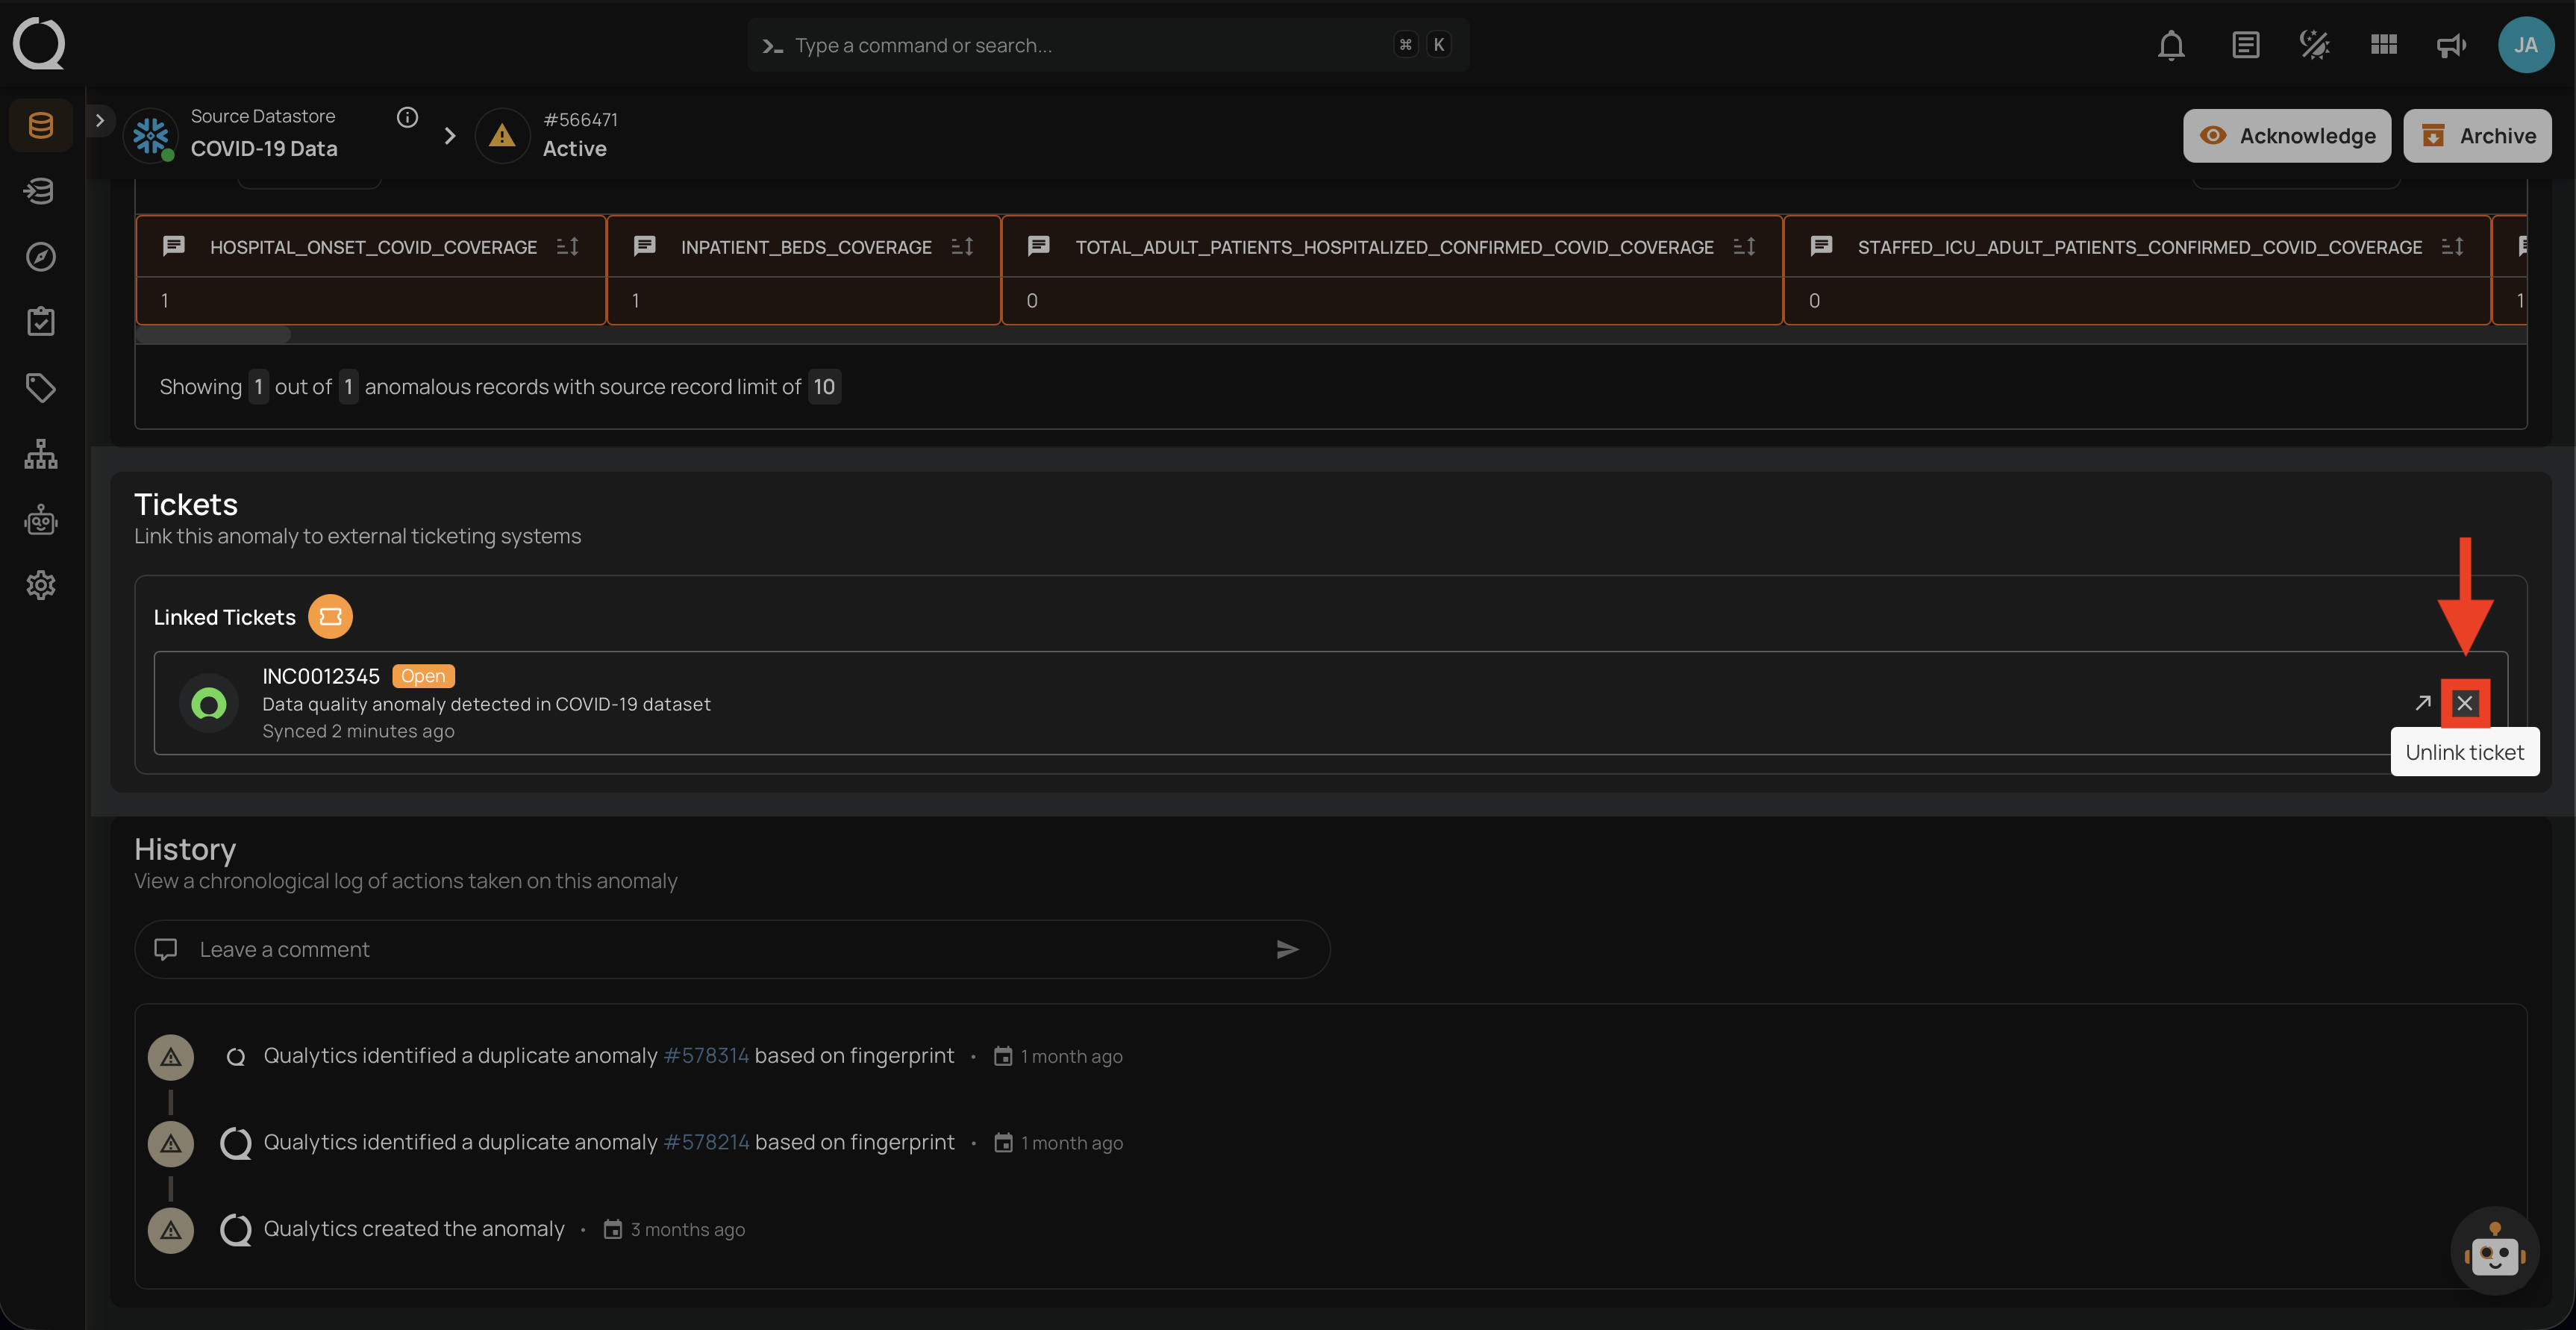
Unlinking a Ticket
Click the Unlink button on a linked ticket card to remove the association between the ticket and the anomaly. The ticket itself remains in the external system. Only the link in Qualytics is removed.
Timeline
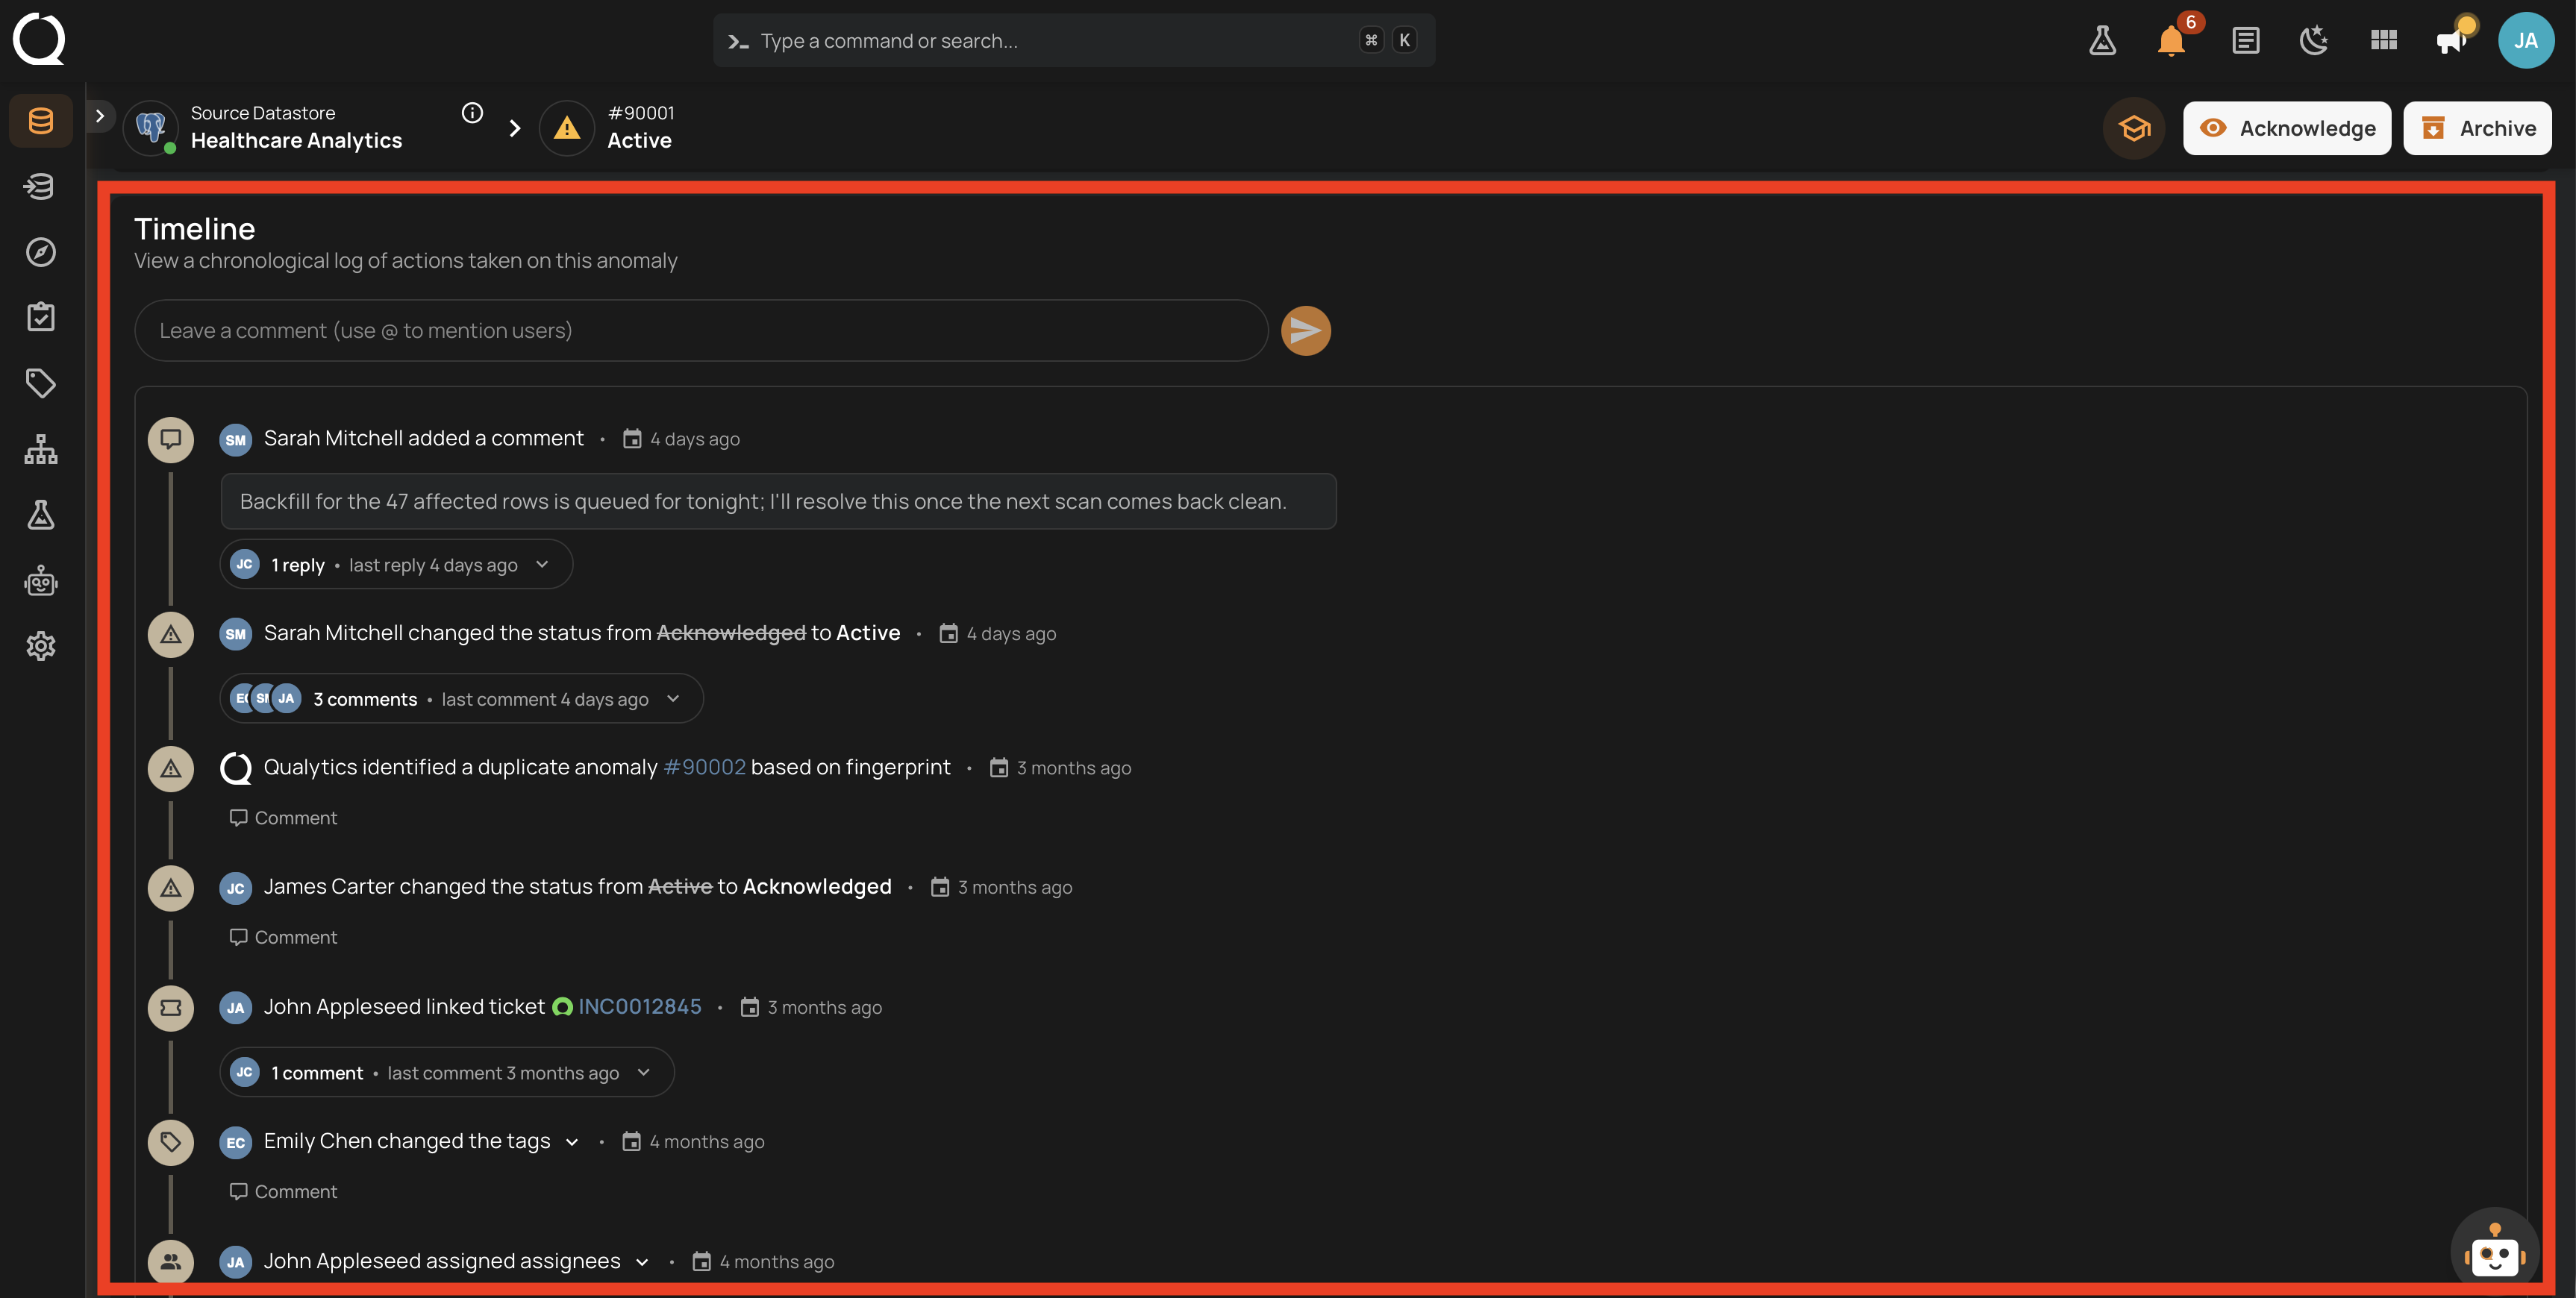
The Timeline section provides a chronological log of all actions taken on the anomaly. It automatically records system events such as anomaly creation, duplicate identification based on fingerprint matching, status changes, description edits, tag updates, assignee changes, and external ticket links and unlinks. Each entry includes the user or system that performed the action and a timestamp. Assignee changes display the users added or removed, with self-assignments and self-unassignments labeled explicitly so it is clear when a teammate takes ownership of an anomaly or steps away from it.
Change entries and comments share this single timeline. Click Show more at the bottom of the list to load older activity, along with the comments from the same period.
Note
Ticket link entries display the linked ticket number as a clickable link back to the external system. Ticket status changes read from the external system are shown on the ticket card and are not recorded in the history. The anomaly's own status changes only when the integration's Anomaly status sync mapping says so, and that change is logged like any other status change. This section was previously labeled History. It was renamed to Timeline because it now carries discussion alongside the change record. The same Timeline and the same commenting behavior are available on containers, quality checks, and check templates.
Note
Ticket link entries display the linked ticket number as a clickable link back to the external system.
Note
When a scan changes an anomaly's status through Auto Resolve Anomalies or Reactivate Recurring Anomalies, the Timeline entry is attributed to Qualytics. Auto Resolve entries link back to the scan operation that performed the action; hover over the entry's avatar to open the scan.
Warning
Existing comments remain visible when an anomaly is archived (Resolved, Duplicate, Invalid, or Discarded), but they become read-only. New comments cannot be added, and existing ones cannot be edited or deleted until the anomaly is restored.
Reviewing a Change
Short values are shown inline on the entry, reading from <previous value> to <new value>. A long change collapses behind a View changes control instead: this happens when the two values together run past roughly 170 characters, or when either one contains a line break. The control reports the before and after lengths (for example, 32 → 166 chars) and expands into a panel with the From and To values. Click Hide to collapse it again. This keeps a long description edit from flooding the Timeline while the full text stays one click away.
When one save changes several properties at once, they are grouped into a single entry rather than split into separate rows.
Adding a Comment
Users can leave comments to discuss the issue, add context, or communicate decisions. All comments are timestamped and attributed to the respective user.
Info
Adding a comment requires at least the Viewer team permission on the datastore. For more details, see the Team Permissions page.
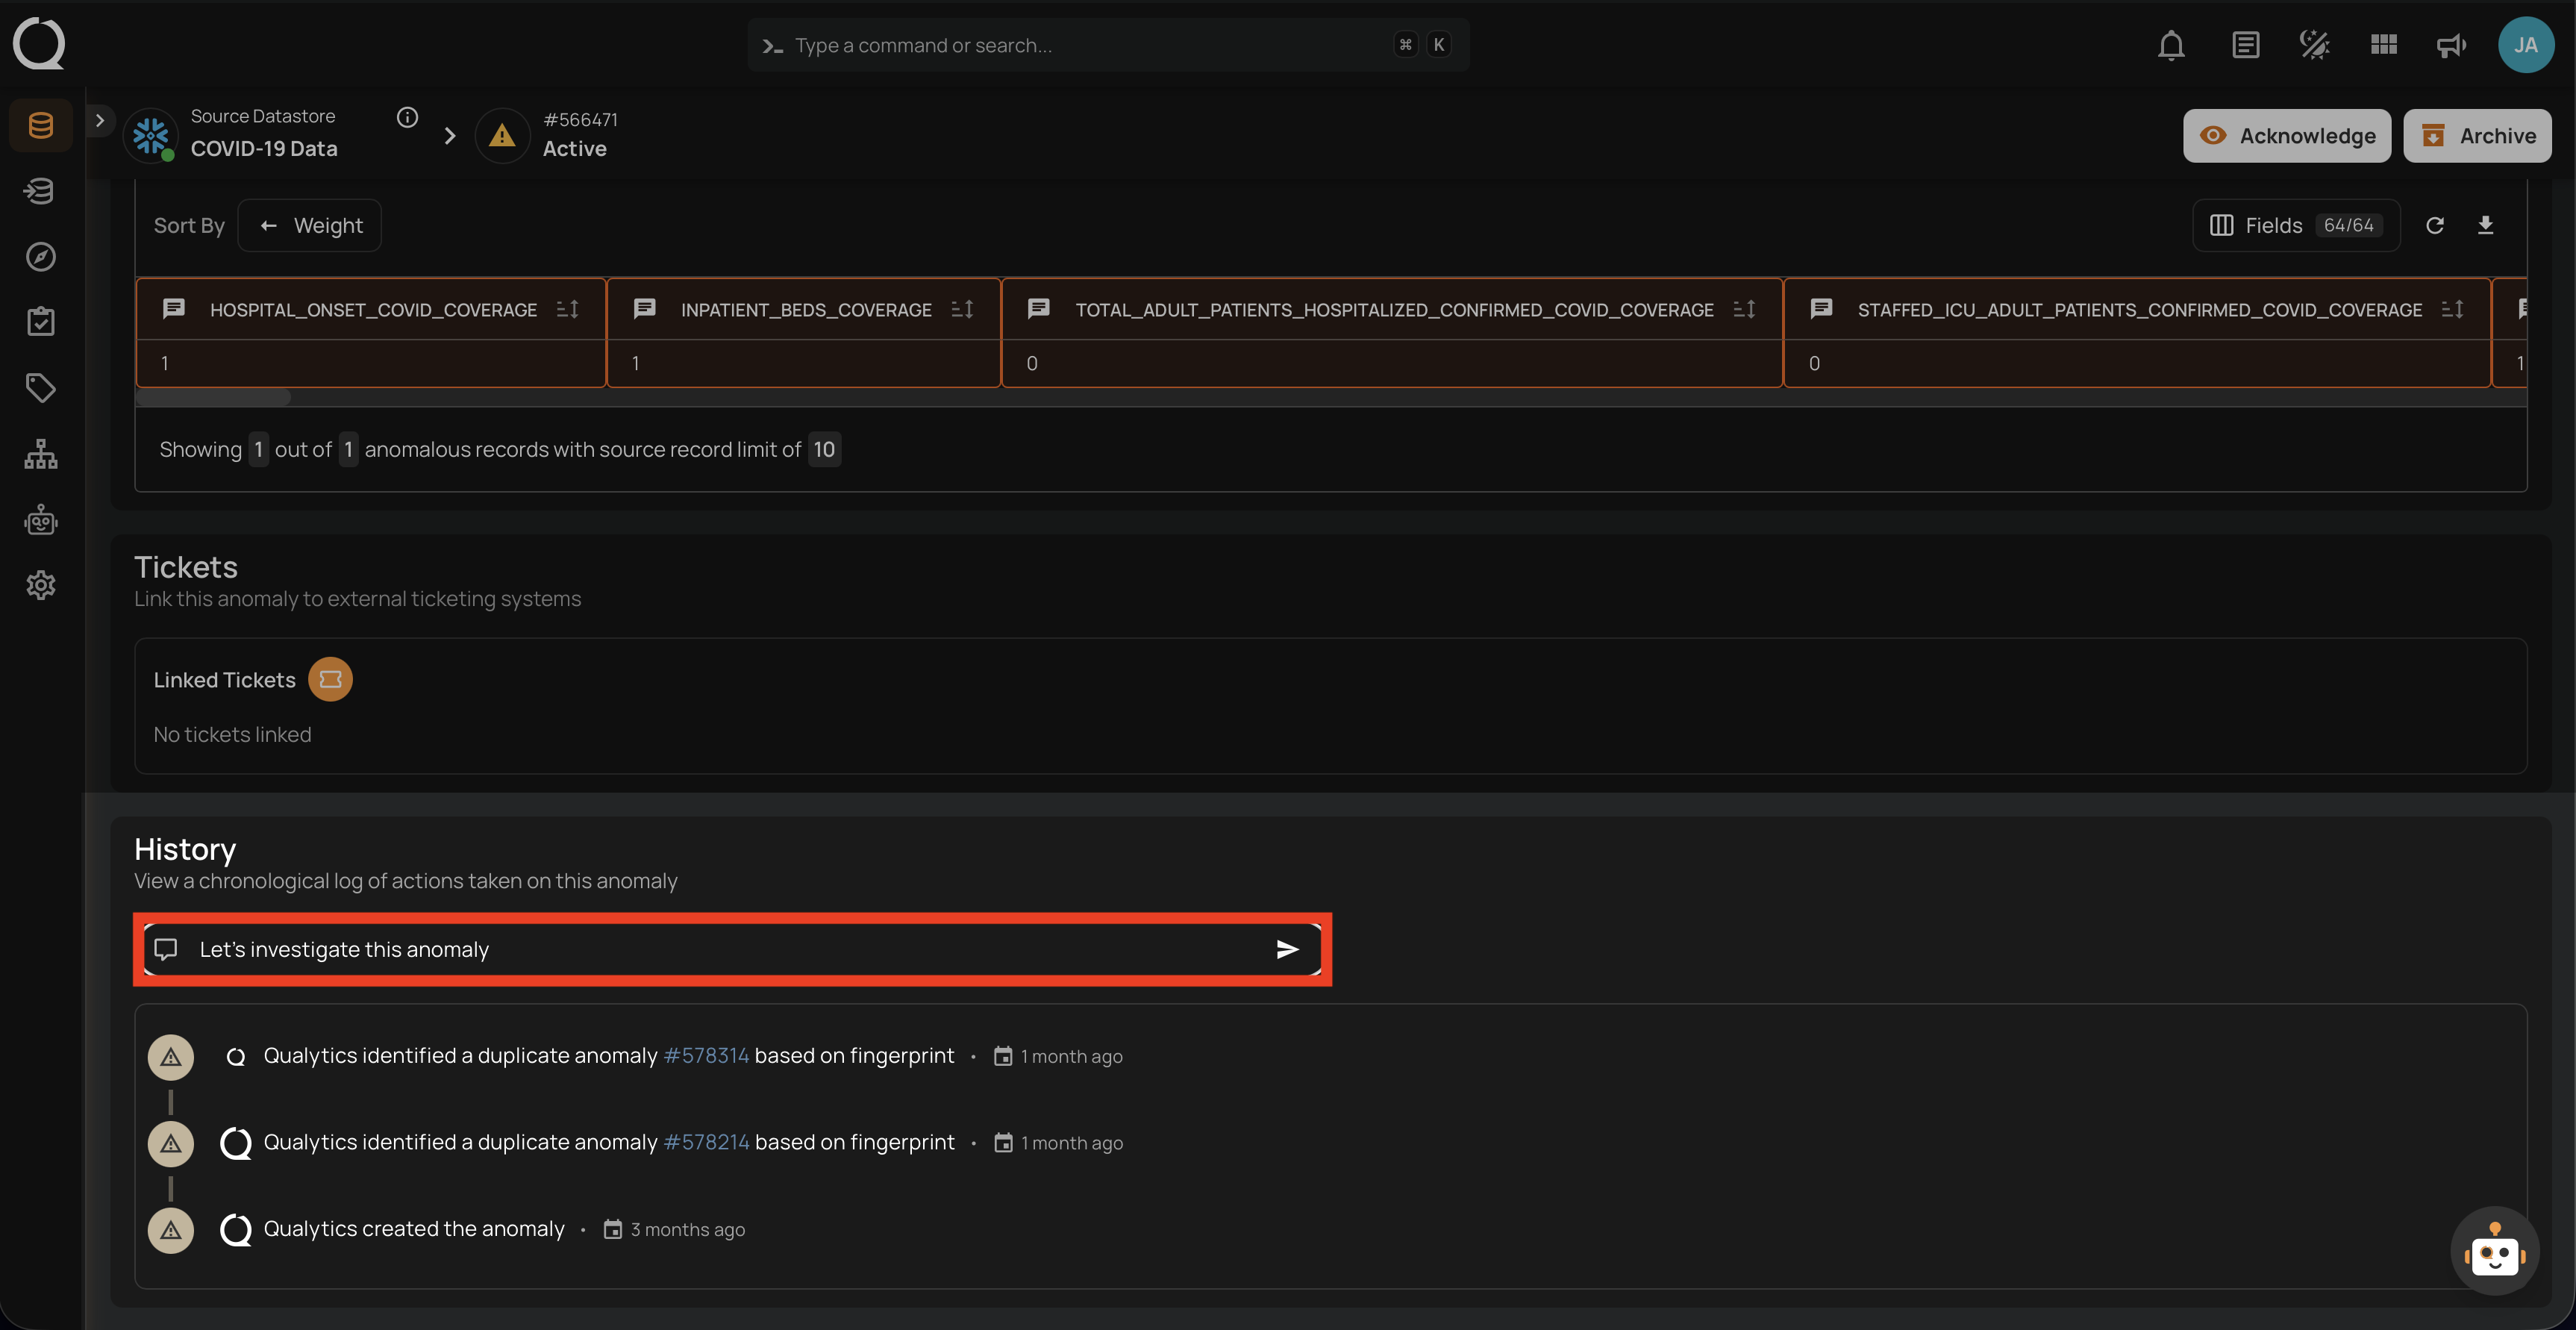
Step 1: Type your comment in the "Leave a comment (use @ to mention users)" input field above the Timeline. Type @ to mention a teammate and pick them from the list.
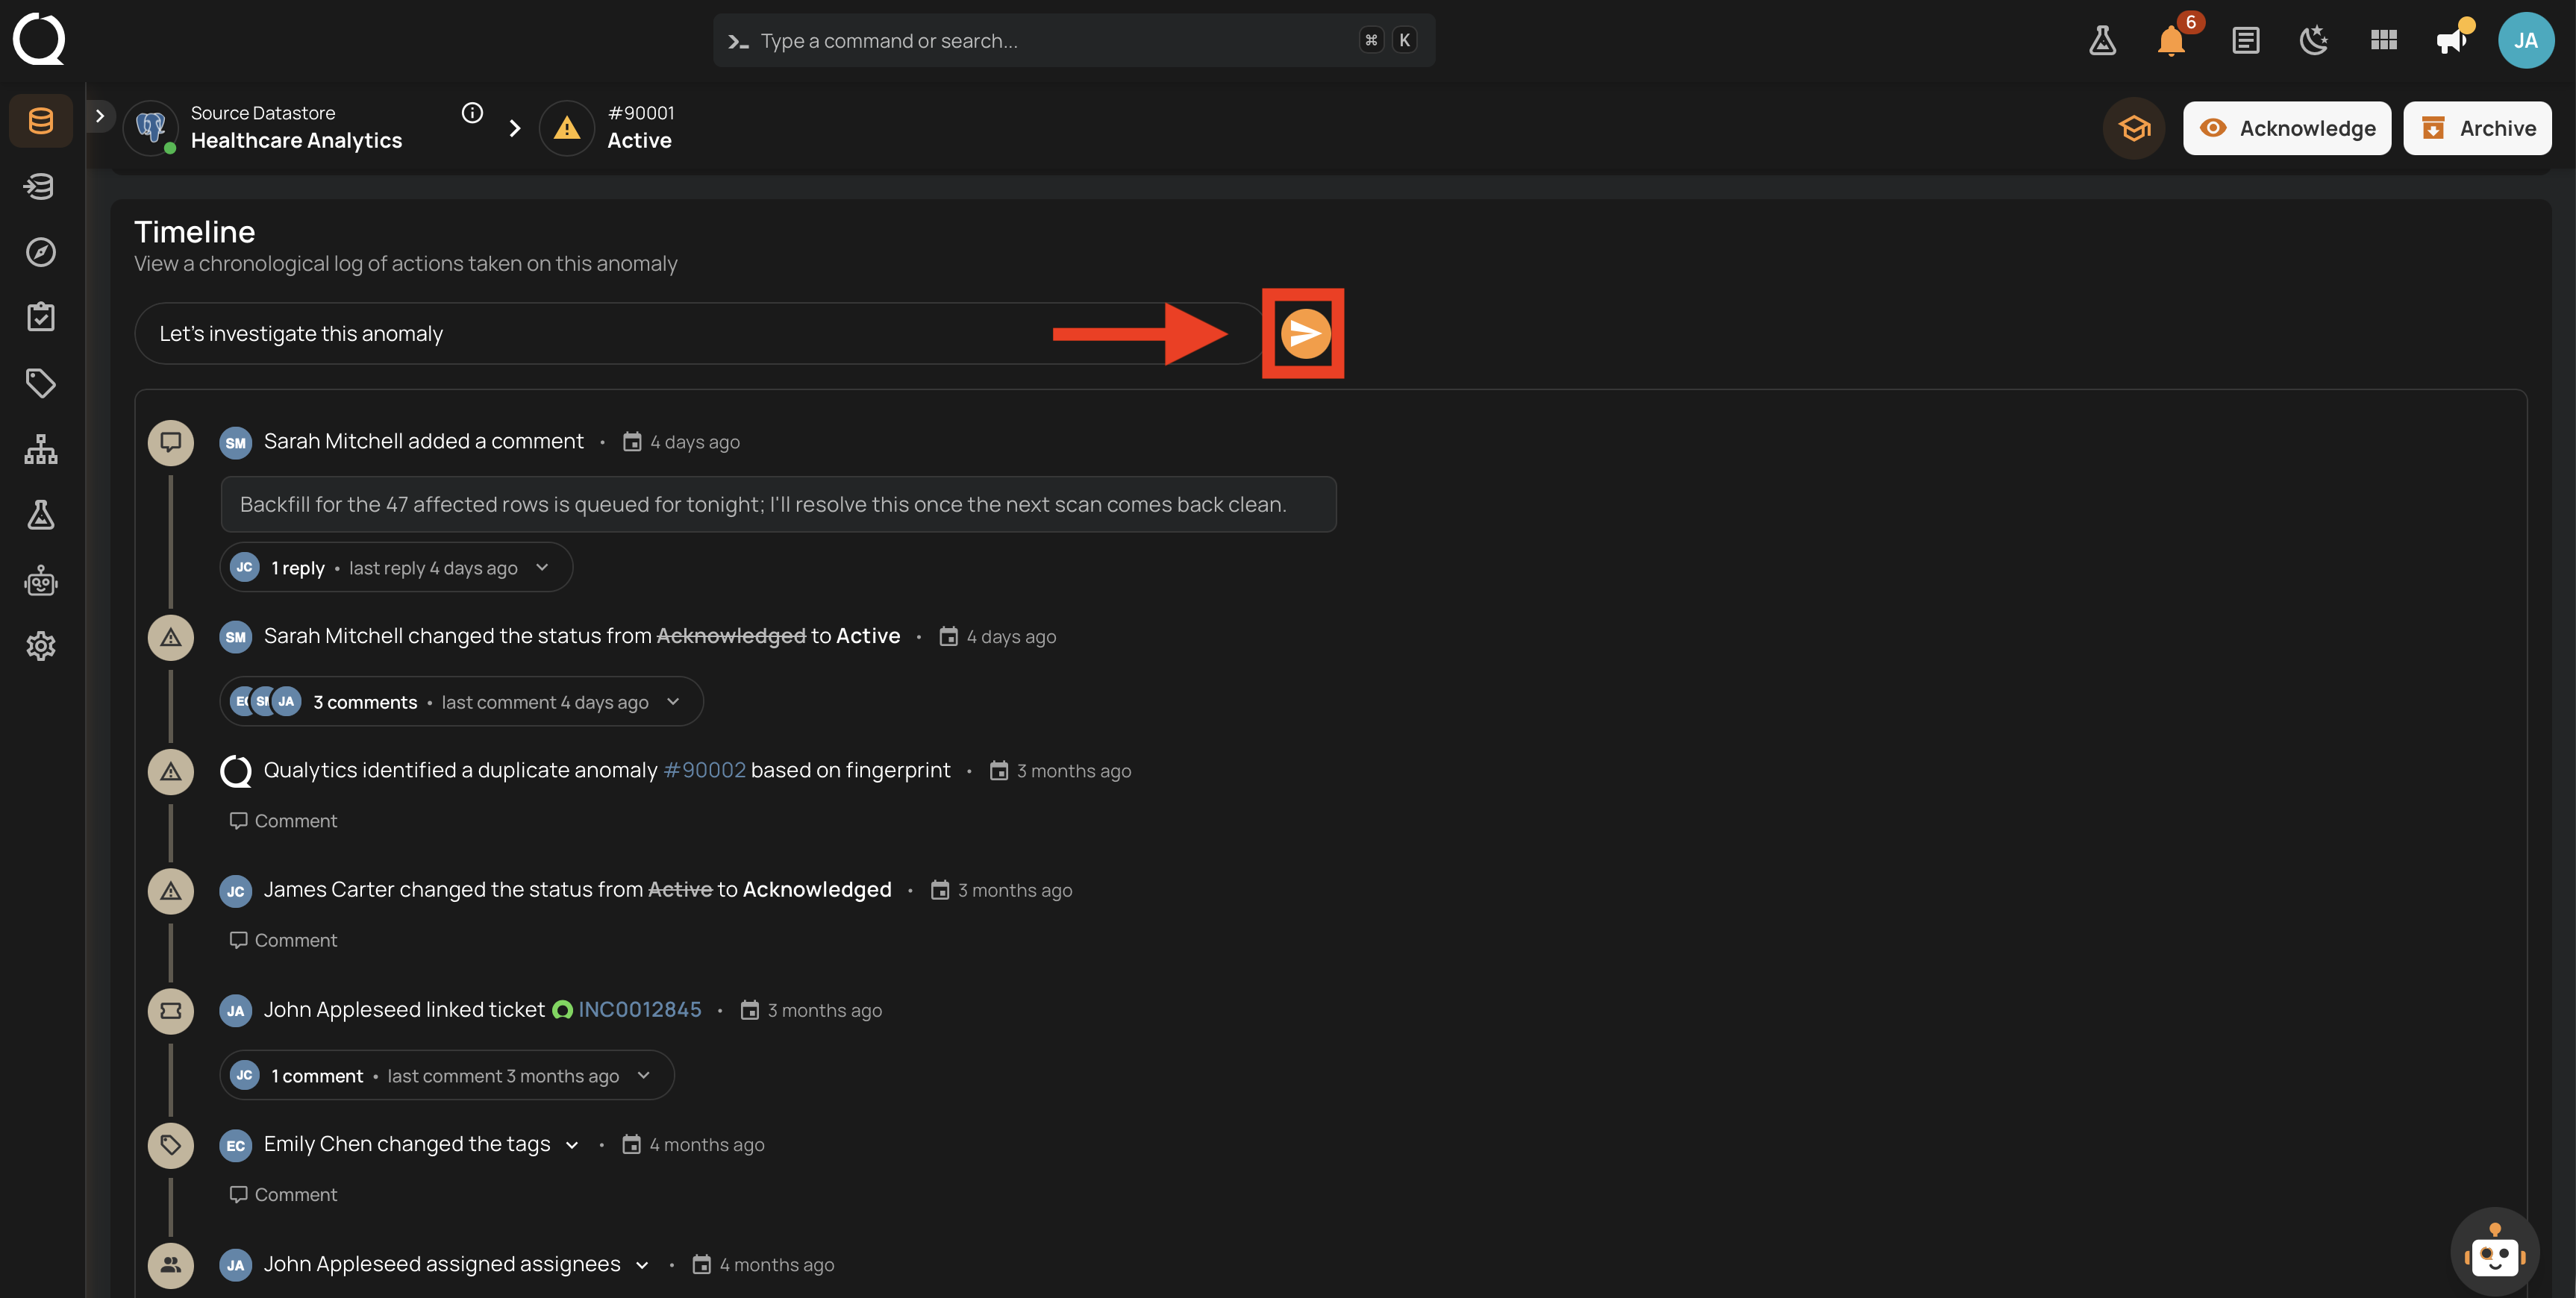
Step 2: Click the Send button to post your comment, or press Enter. Use Shift+Enter for a line break.
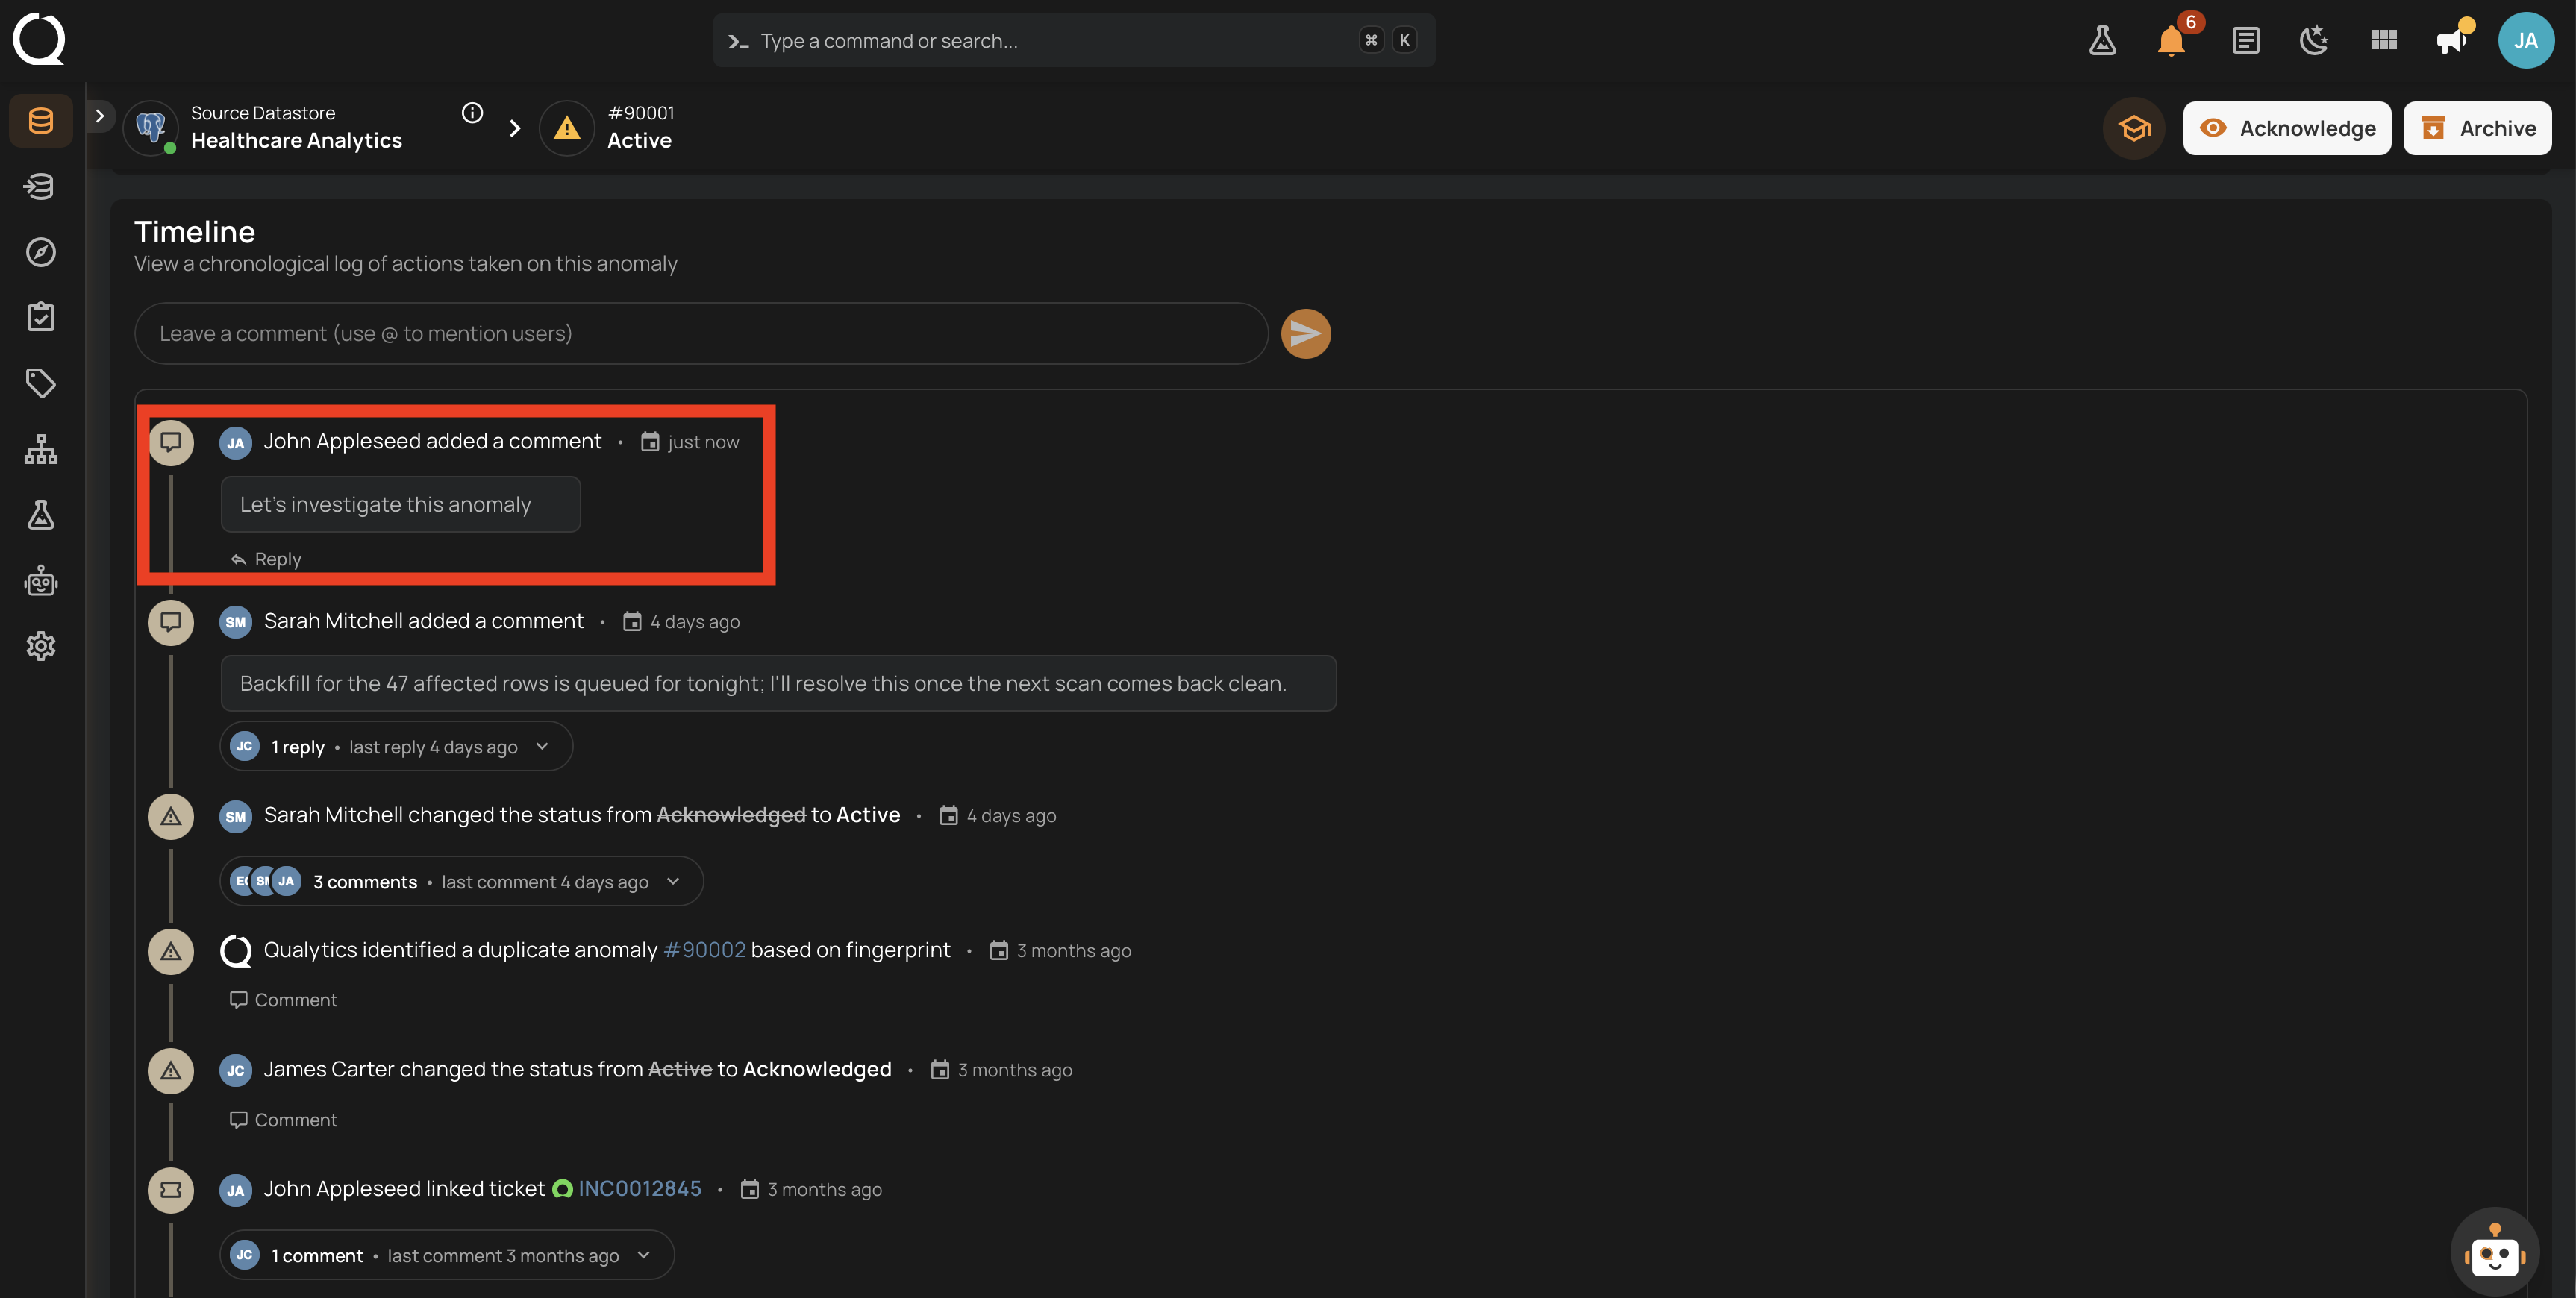
The comment will appear in the Timeline with your name, the message, and a timestamp.
Commenting on a Specific Change
Instead of a standalone comment, you can attach your comment to the exact change it is about. Click the Comment control below a Timeline entry, write your message, and post it. The comment stays with that entry, so a status change or a description edit always carries the reason for it.
Once an entry has comments, they collapse into a pill showing the author avatars, the comment count, and how long ago the last comment was posted (for example, 2 comments • last comment 3 hours ago). Click the pill to expand the conversation, and Hide 2 comments to collapse it again.
Replying to a Comment
Click the Reply control below a standalone comment to answer it. Replies are grouped into a thread under that comment and collapse into a pill reading, for example, 3 replies • last reply 20 minutes ago. Threads are one level deep: you reply to a comment, not to a reply.
Comments attached to a change work differently. Below a Timeline entry the control stays Comment, so everyone who writes there adds another comment about that same change and the entry keeps one running conversation instead of separate reply threads.
Mentioning a Teammate
Type @ in a comment or a reply and keep typing to filter the list of users by name, email, or username. Pick a user and they become a highlighted chip in your comment. Links pasted into a comment become clickable links.
Mentioned users receive an in-app Mention notification. Opening it goes straight to the conversation: it opens the anomaly, expands the thread, scrolls the comment into view, and briefly highlights it, even when the comment sits further back in the Timeline.
Note
Anyone active on the platform can be mentioned, including users without access to the datastore the anomaly belongs to. They receive the notification but cannot open the anomaly it points to, so mention the people who can act on the comment. Editing a comment notifies only the people you newly added to it.
Editing a Comment
Info
Only the comment author can edit their own comments. Admin users cannot edit comments from other users. For more details, see the Team Permissions page.
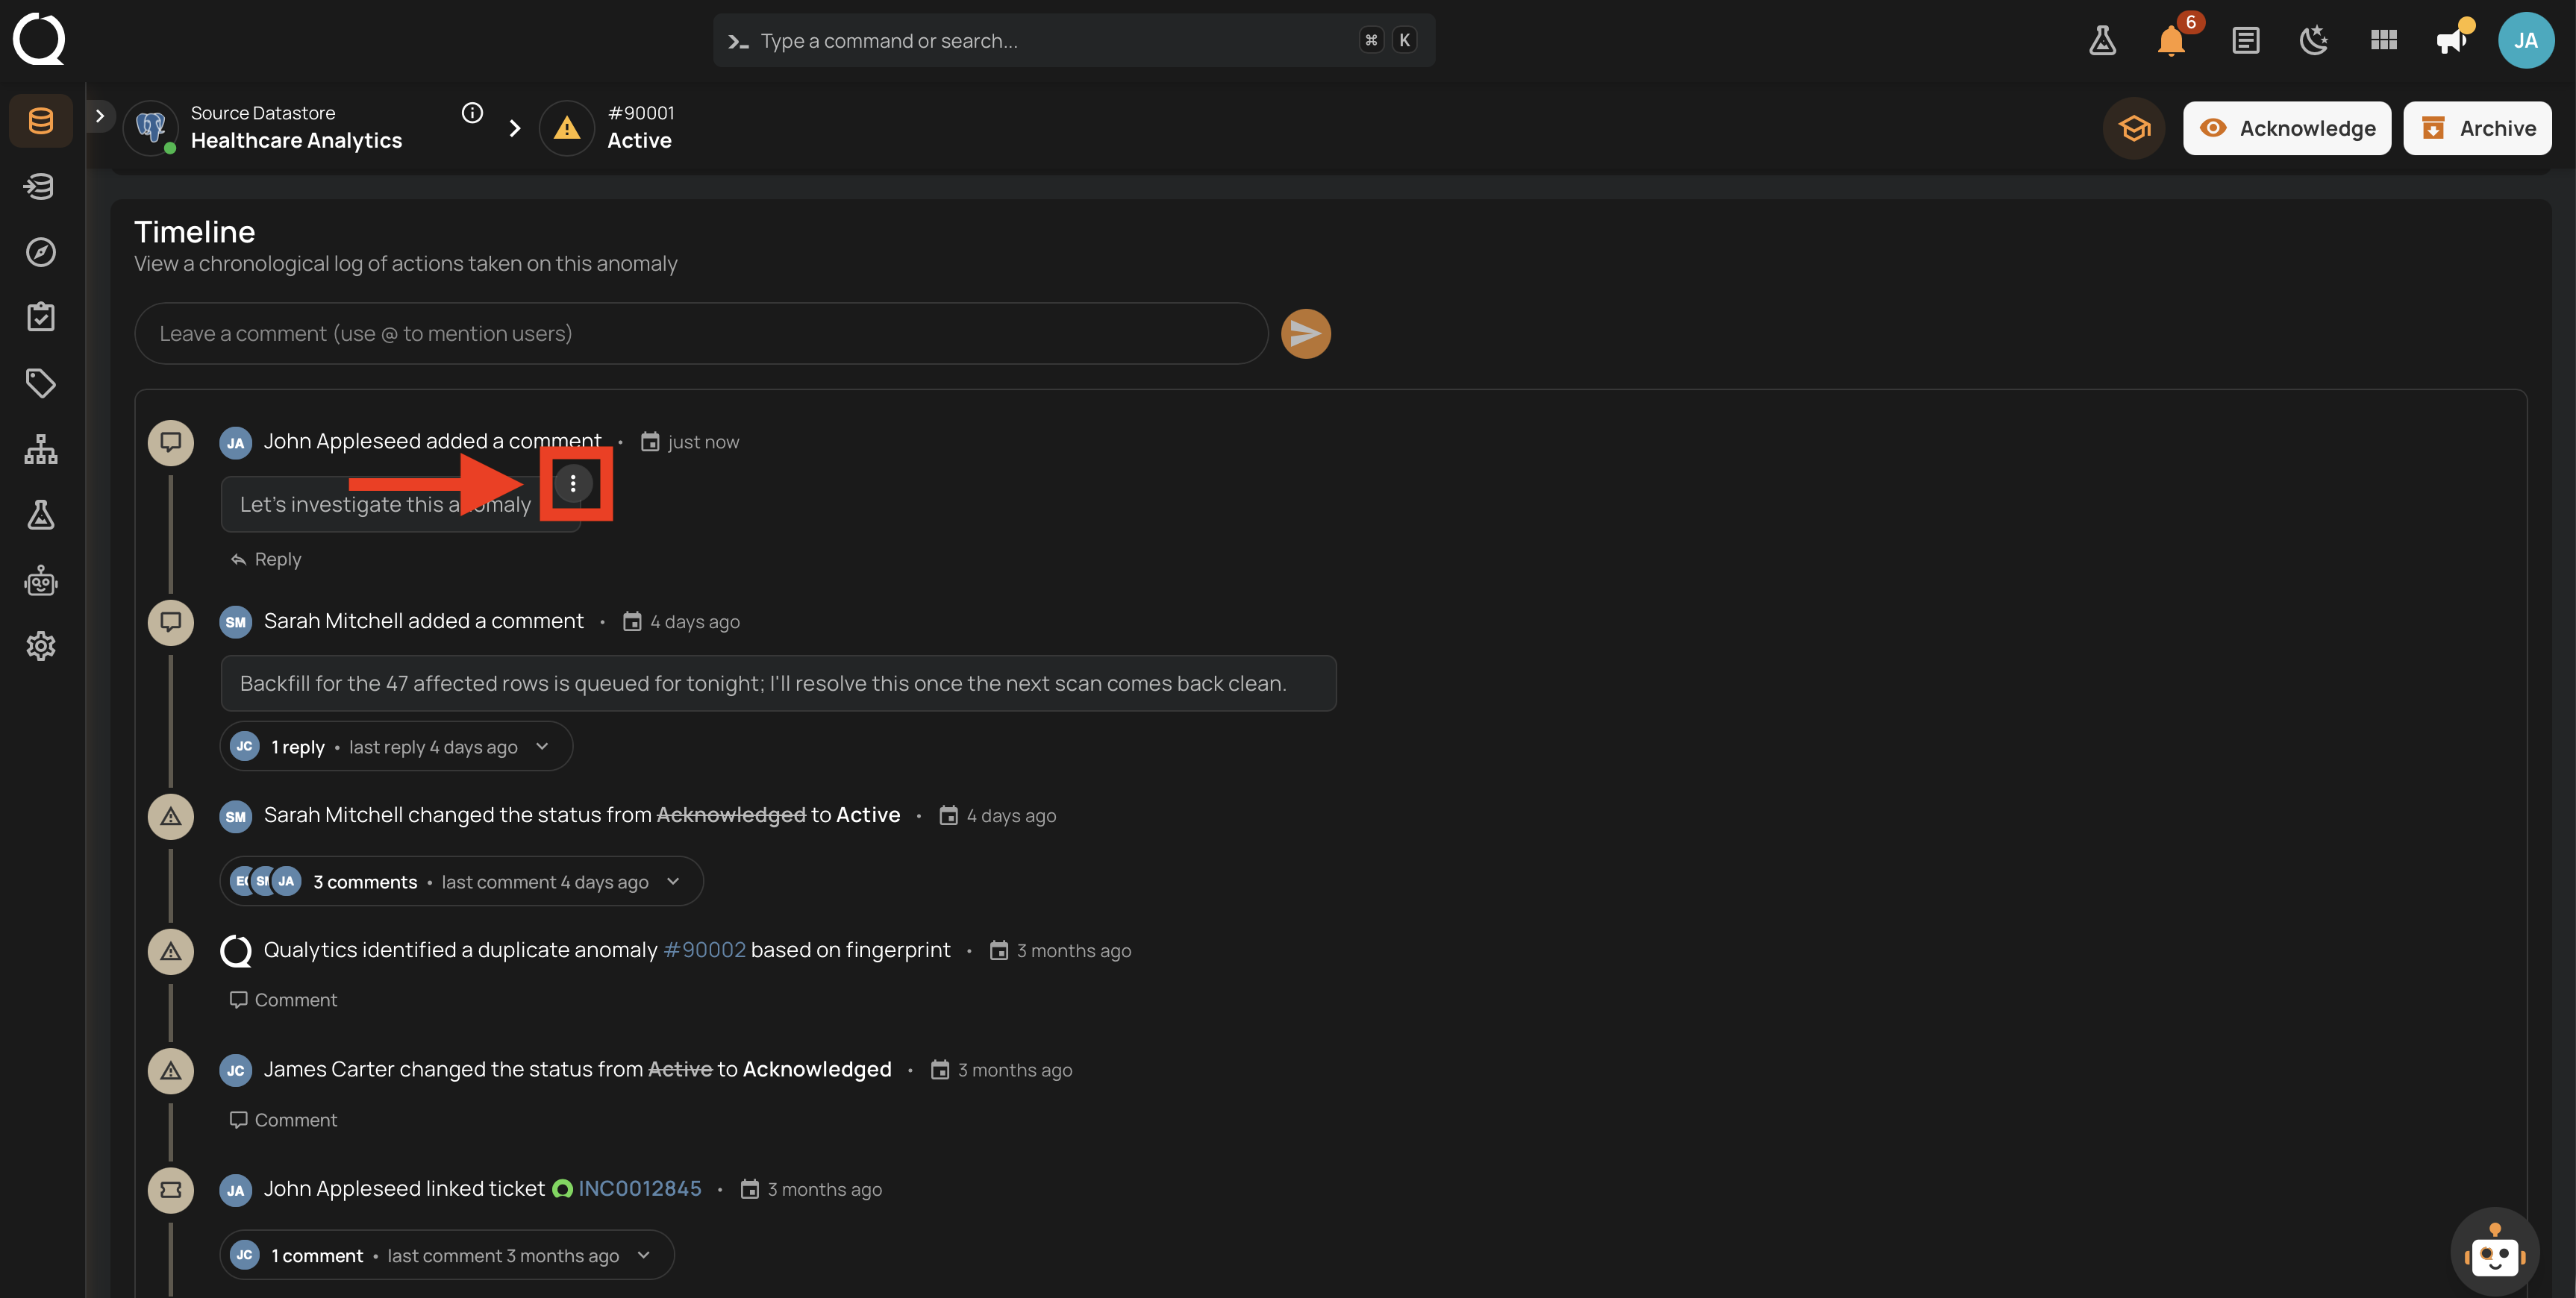
Step 1: Click the vertical ellipsis on the comment you want to edit.
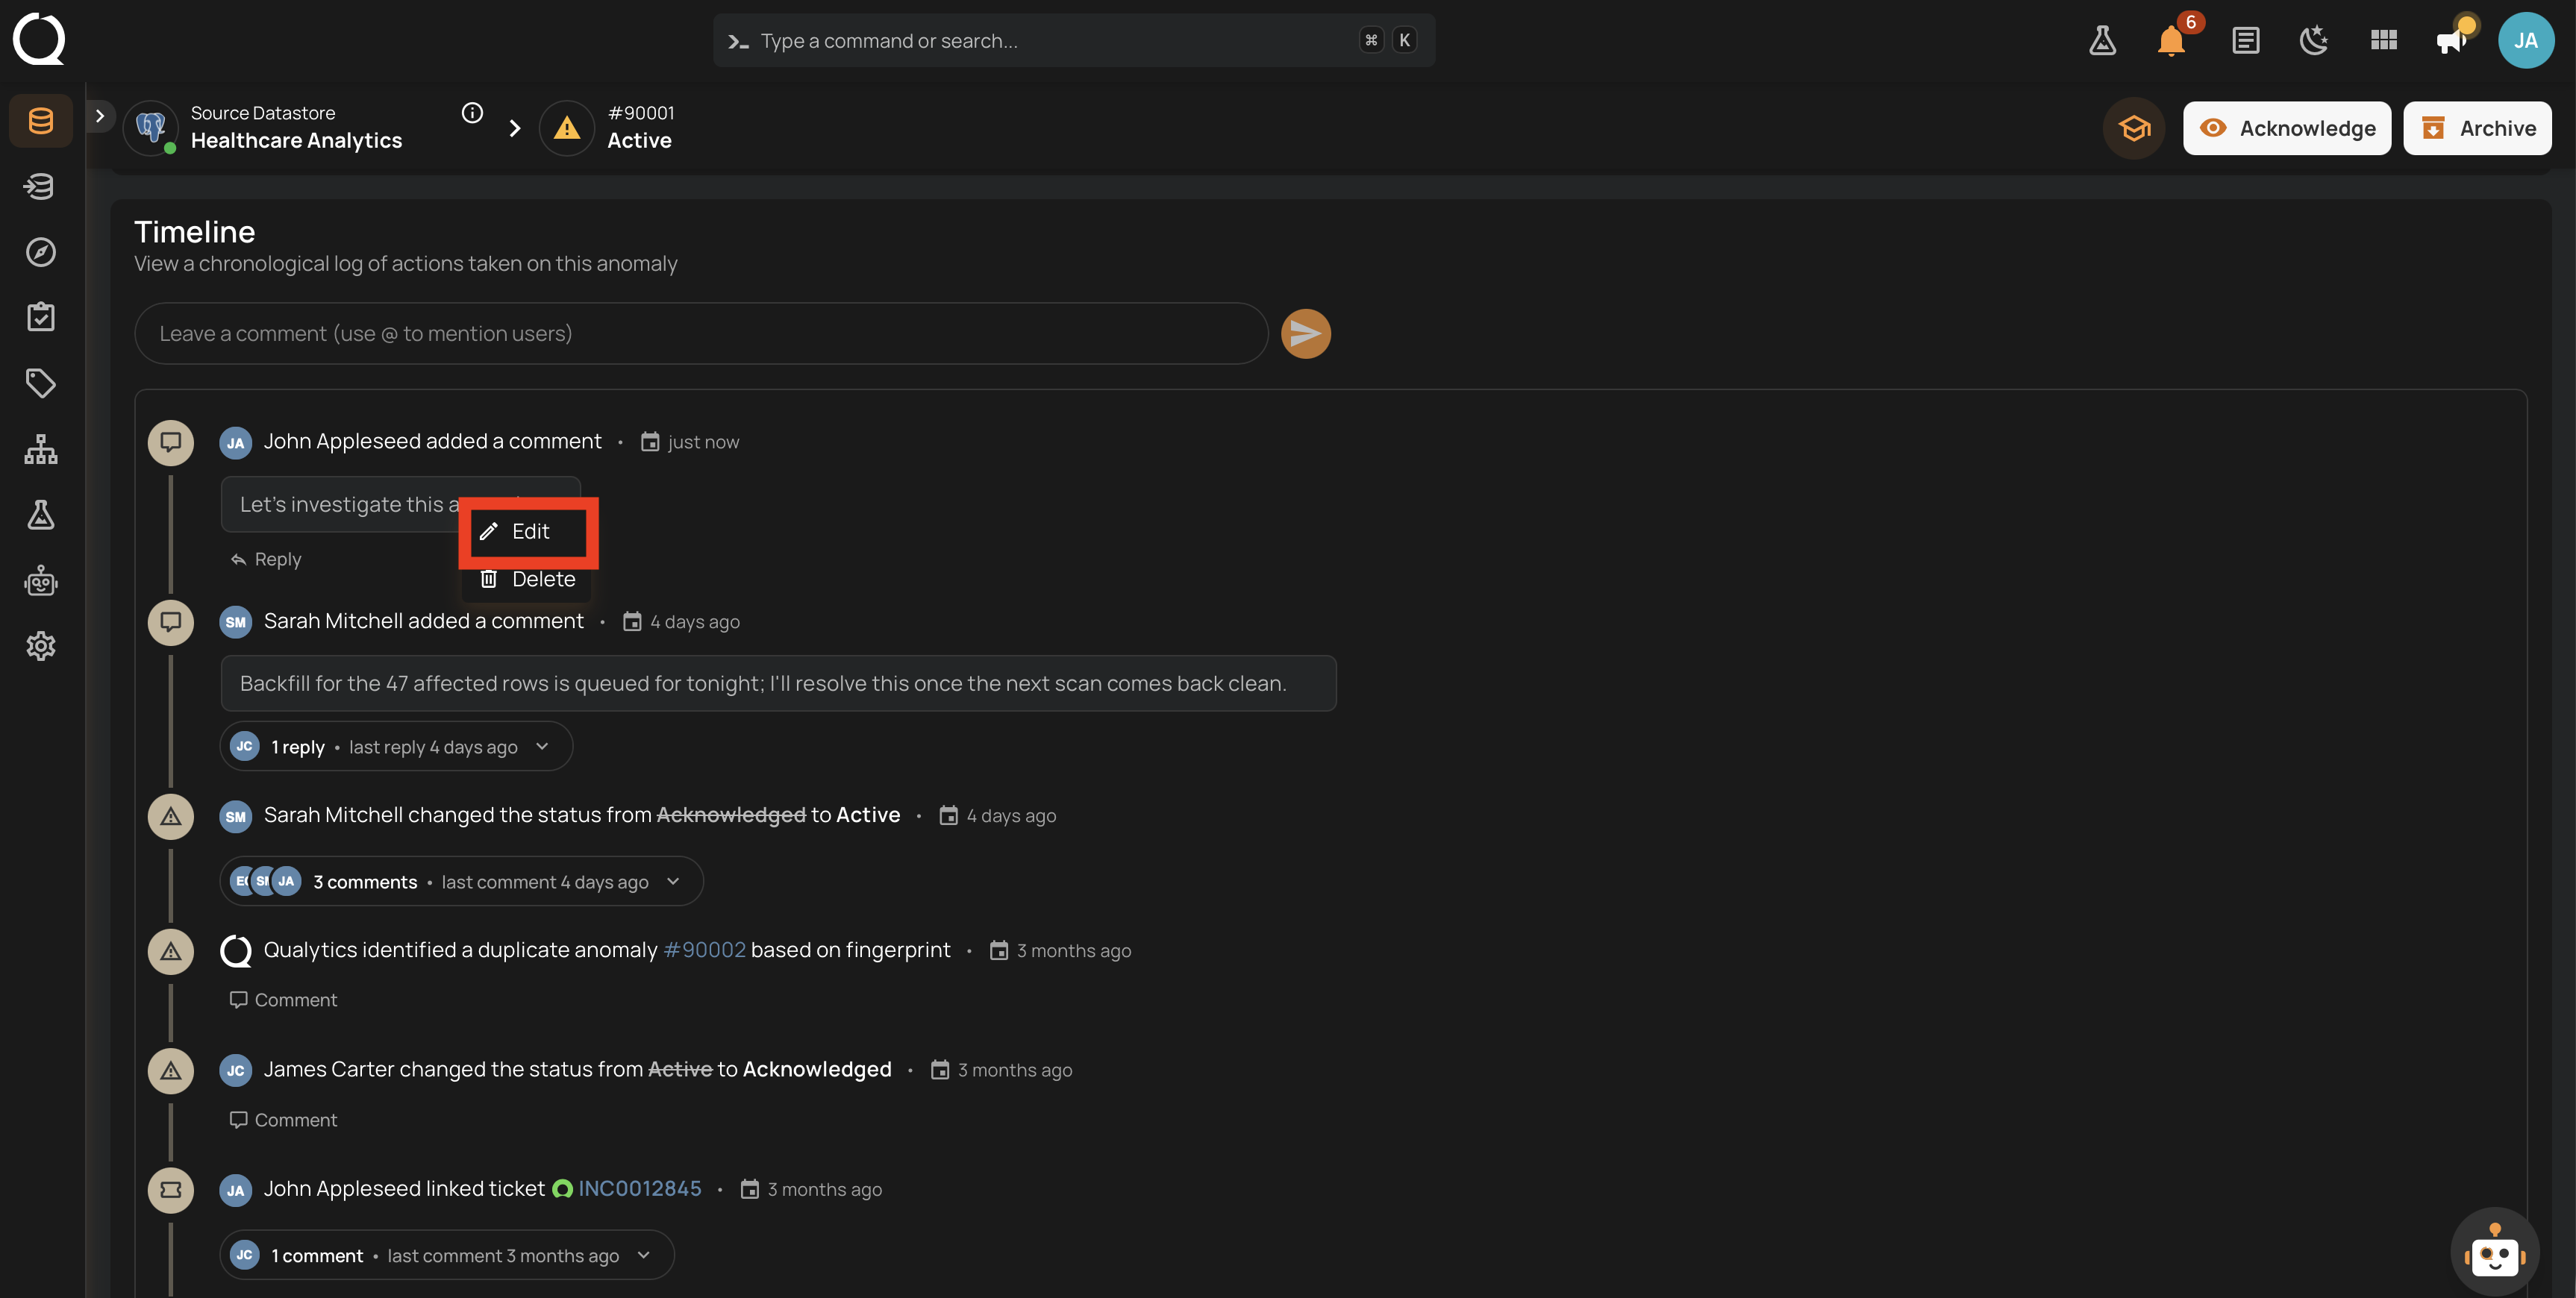
Step 2: Select Edit from the dropdown menu. The comment text will become editable.
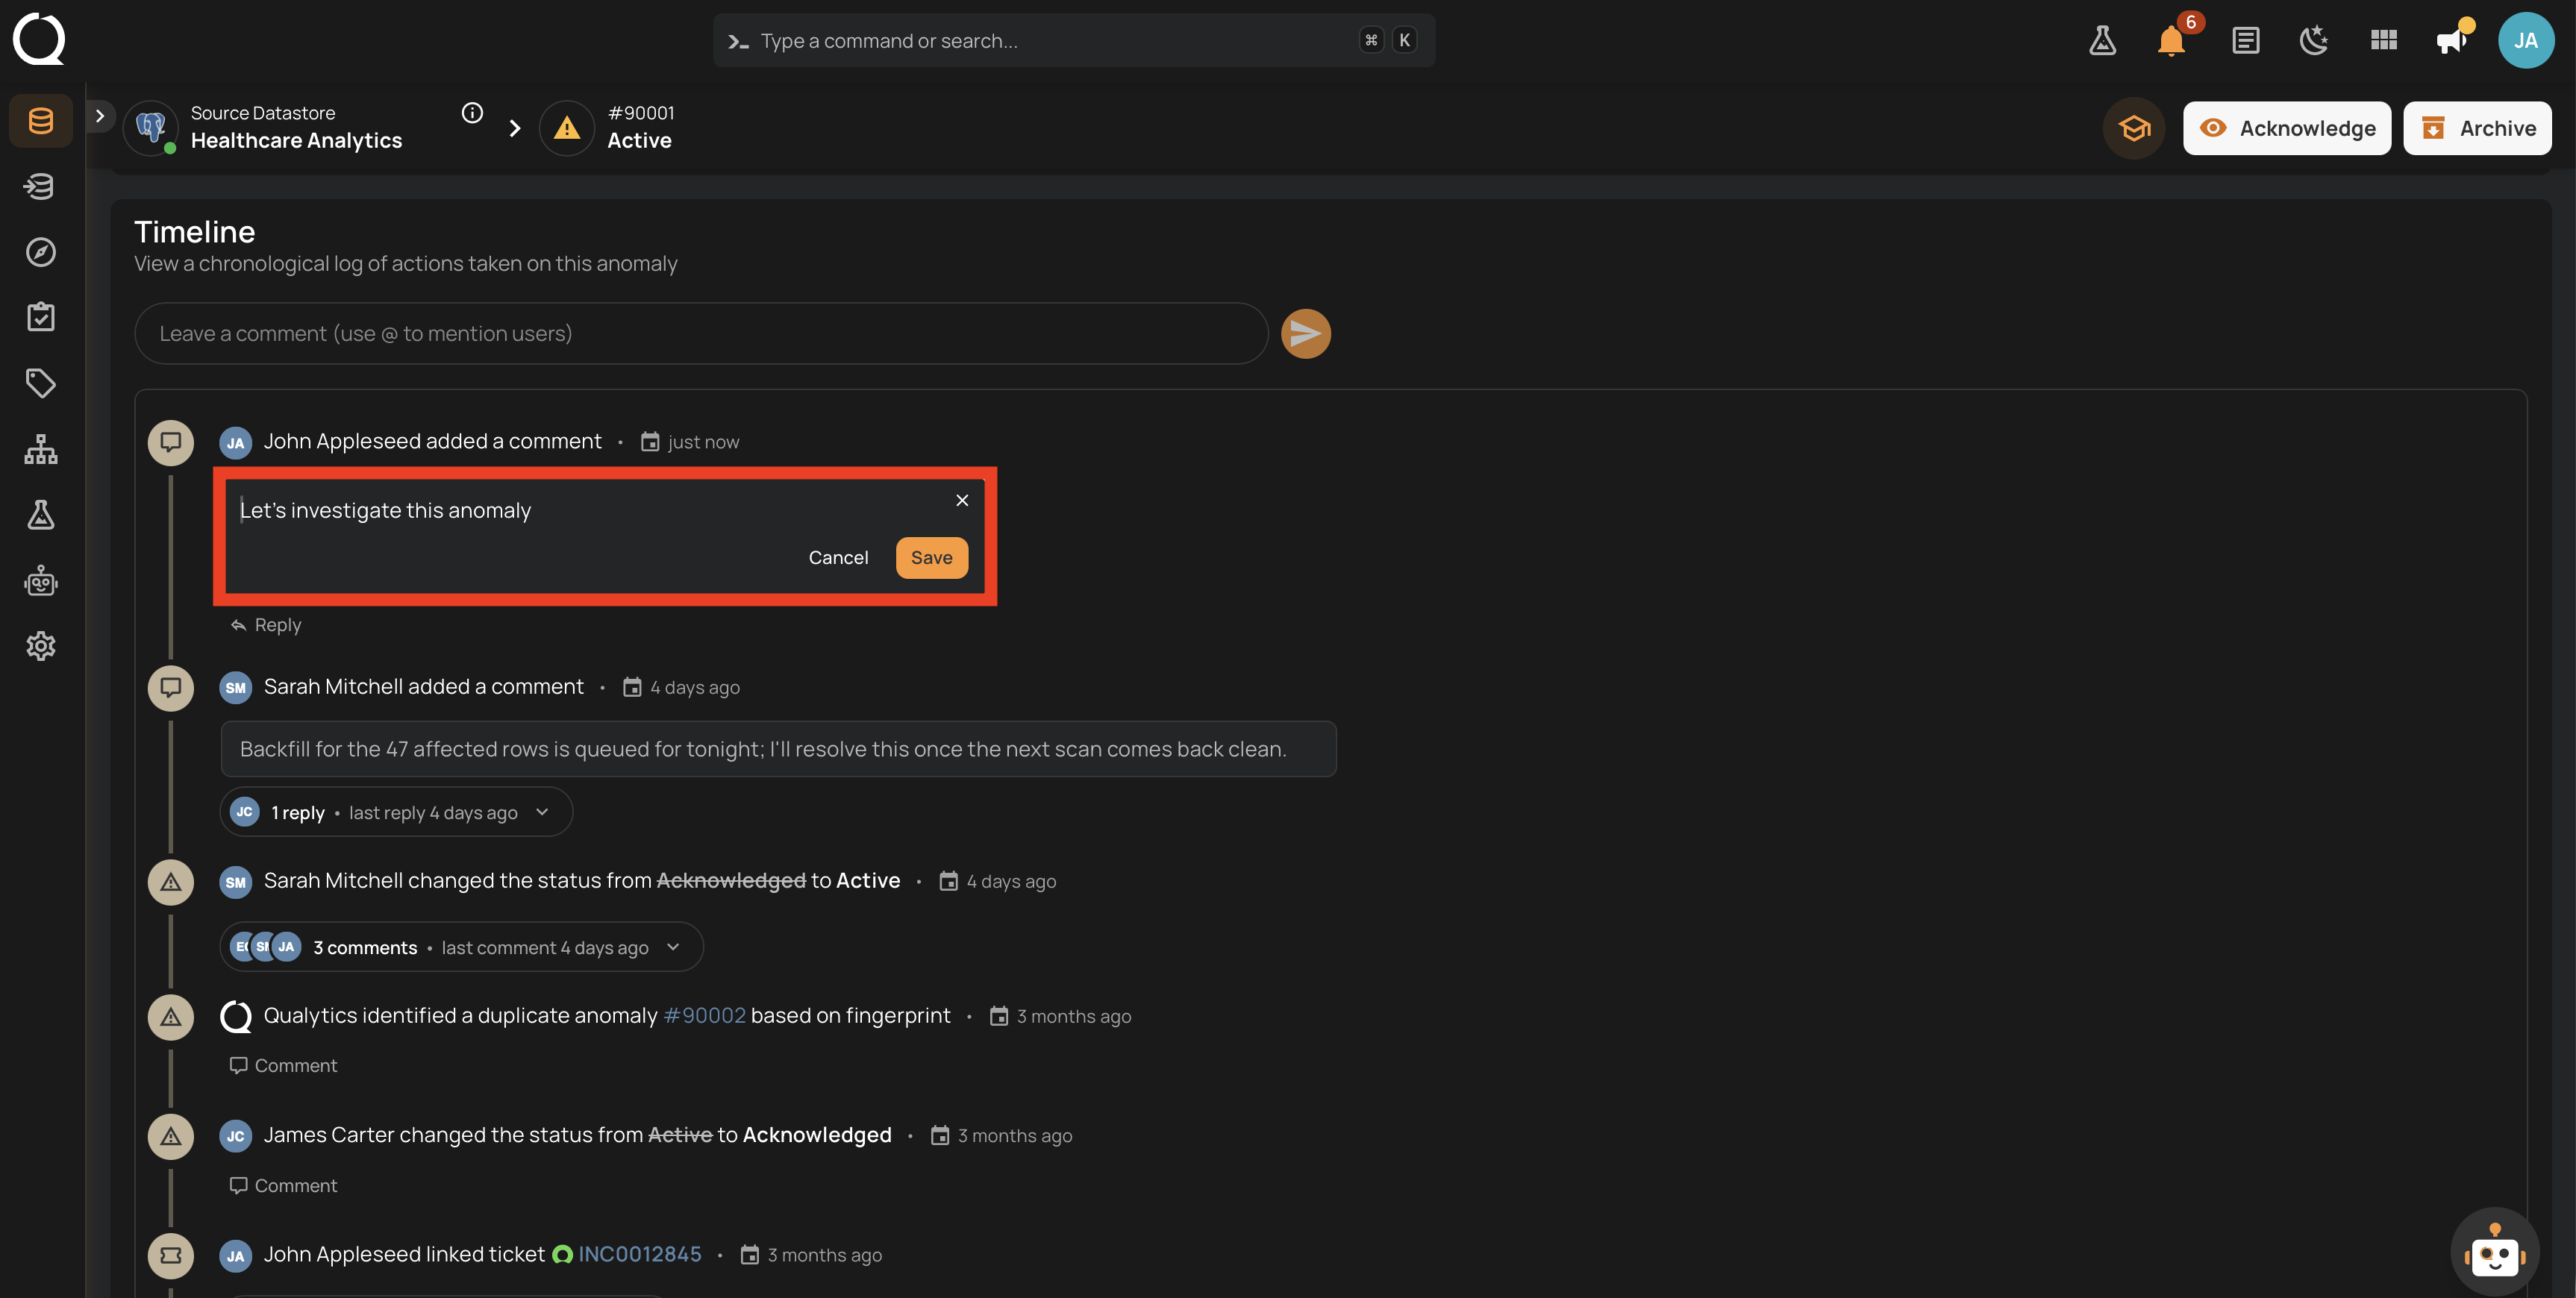
Step 3: Make your changes to the comment text.
Step 4: Click Save to save the edited comment.
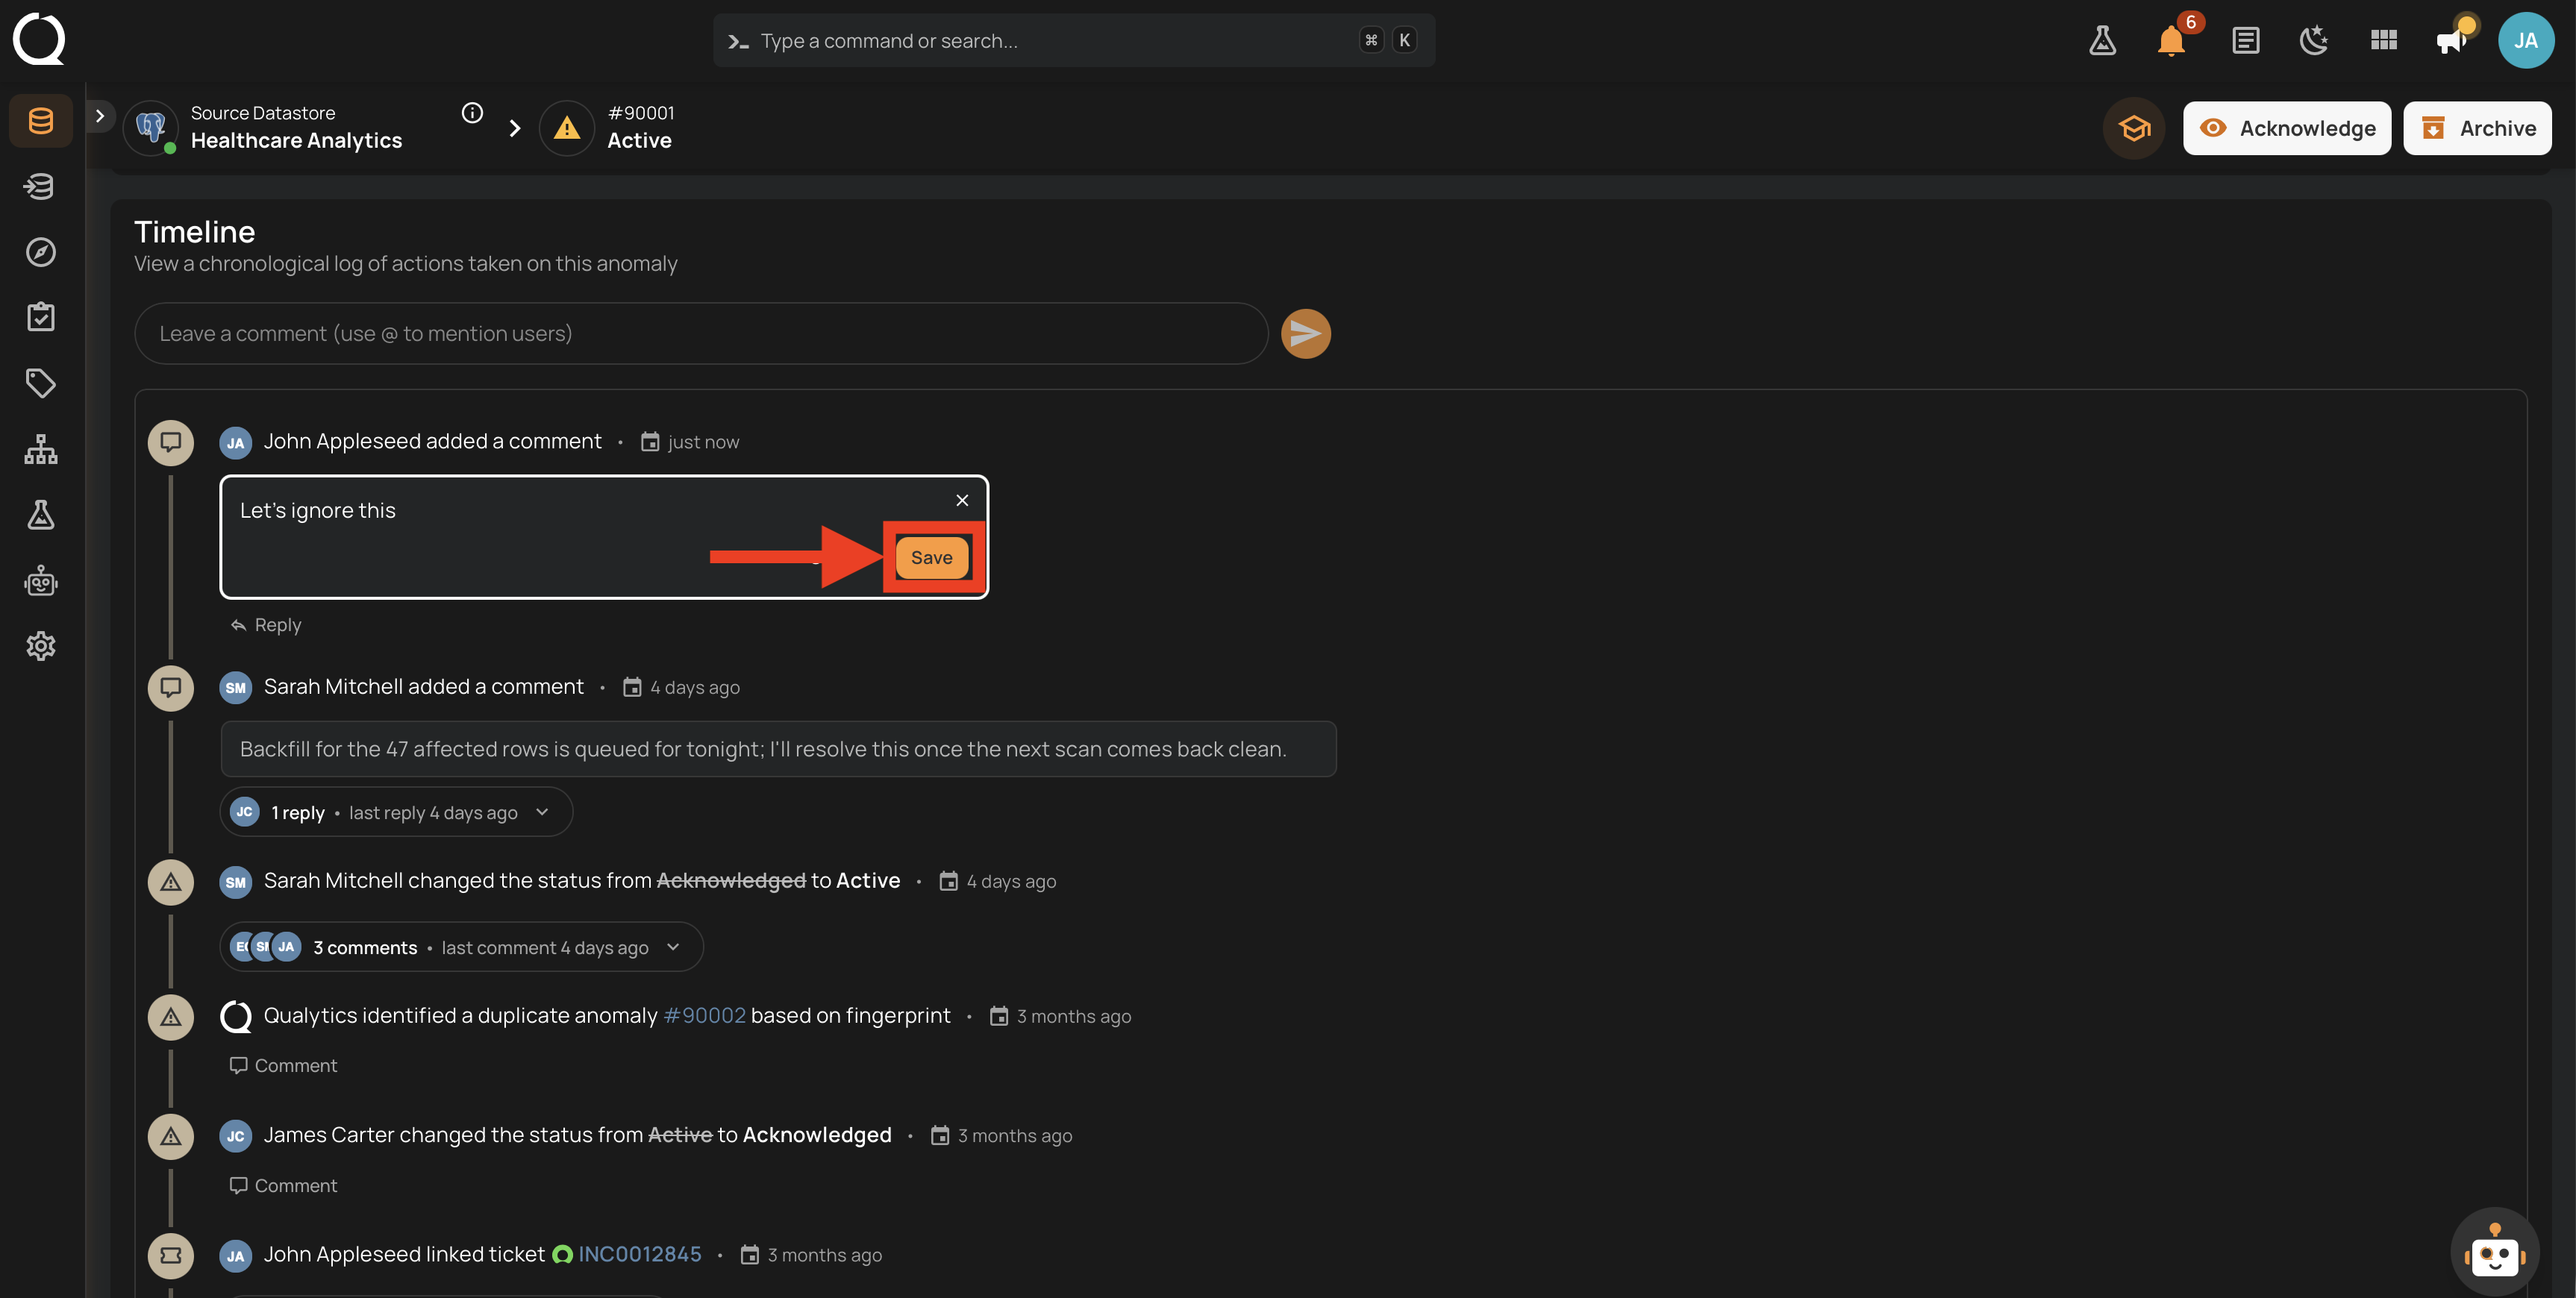
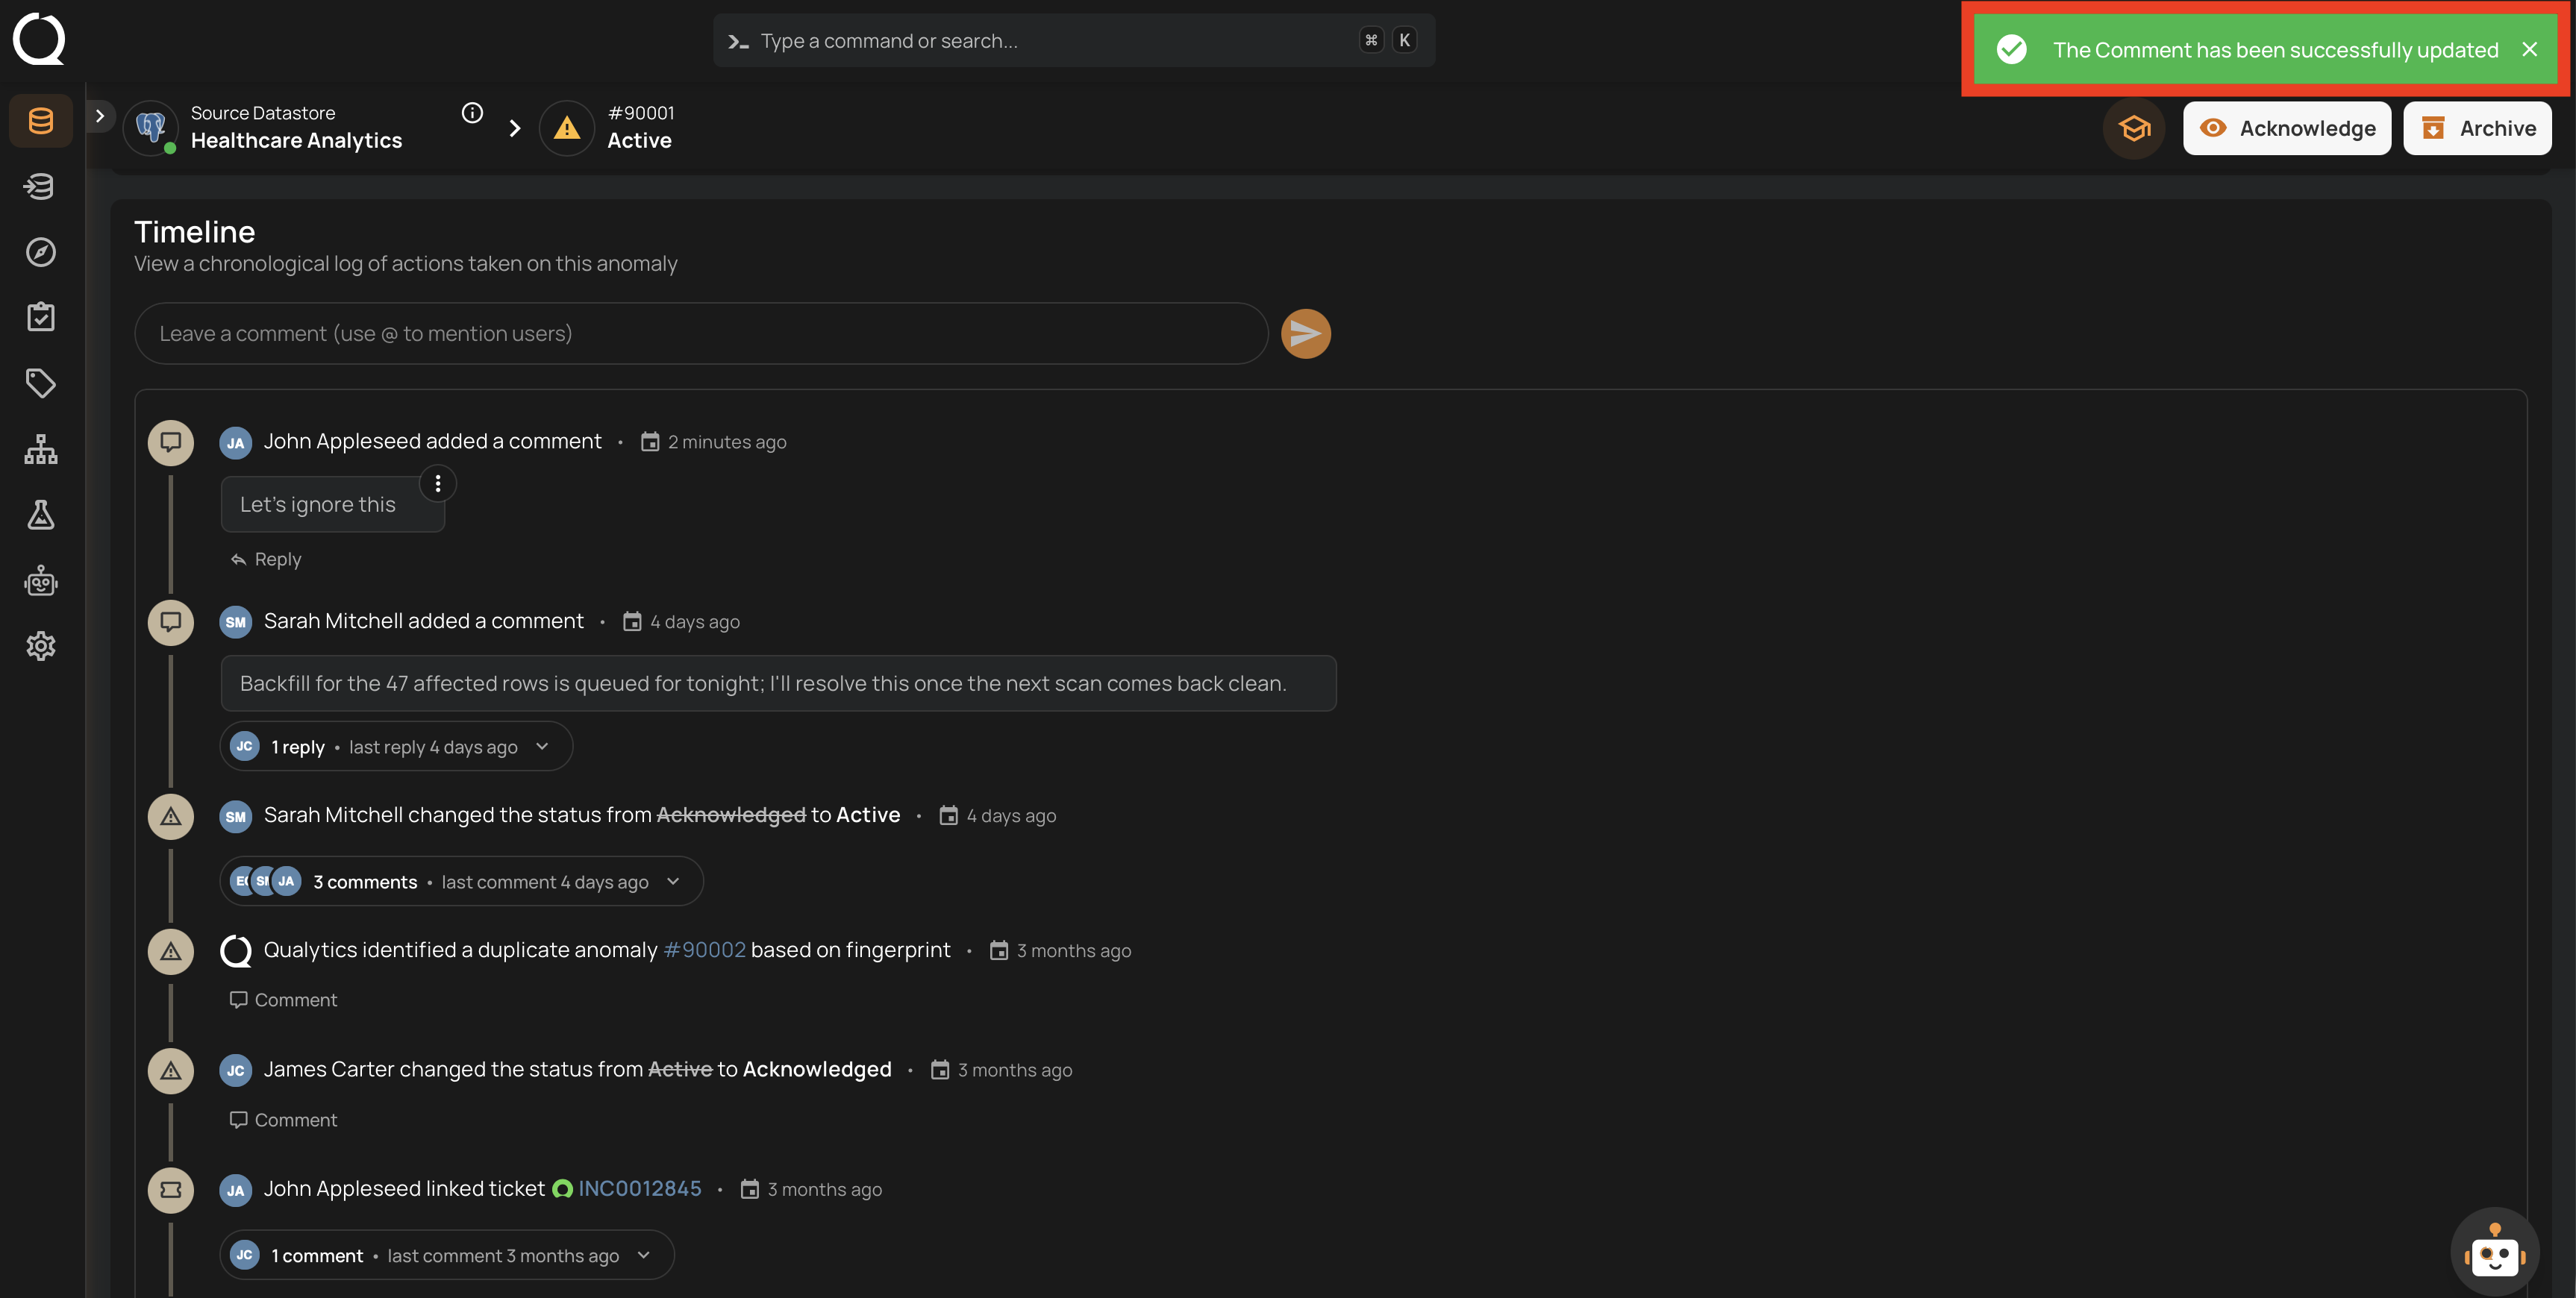
Step 5: A success message confirms the update, and the comment shows the new text in the Timeline.
Deleting a Comment
Info
The comment author can delete their own comments. Admin users can delete any comment. For more details, see the Team Permissions page.
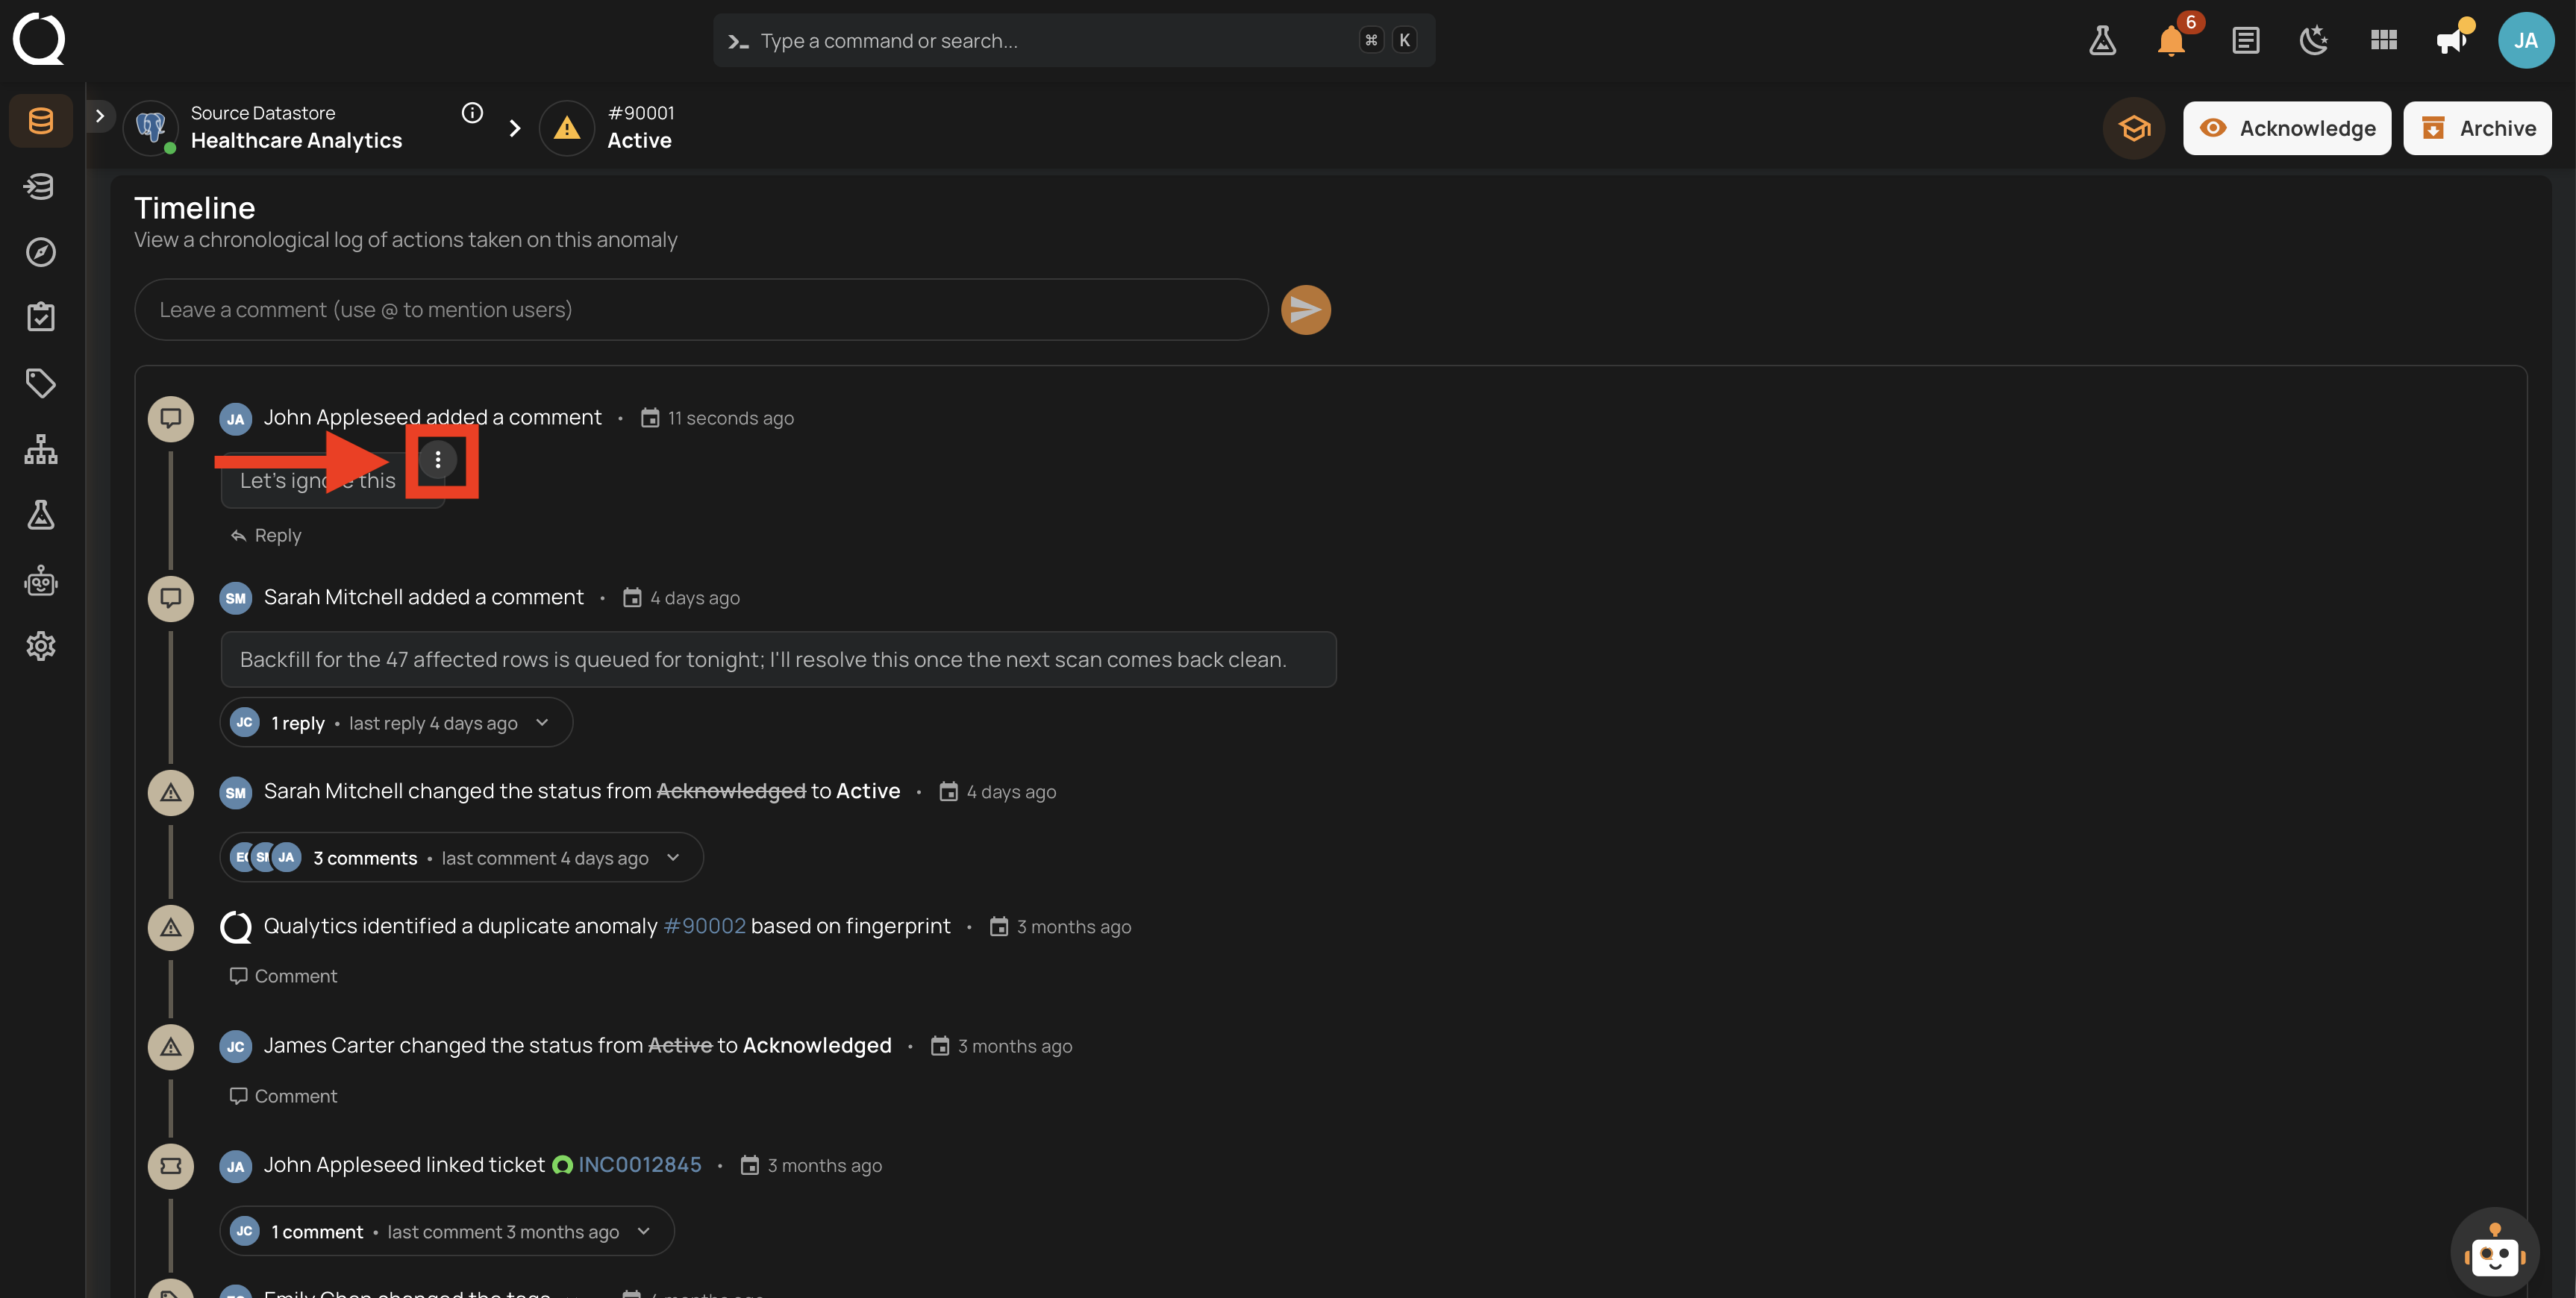
Step 1: Click the vertical ellipsis on the comment you want to delete.
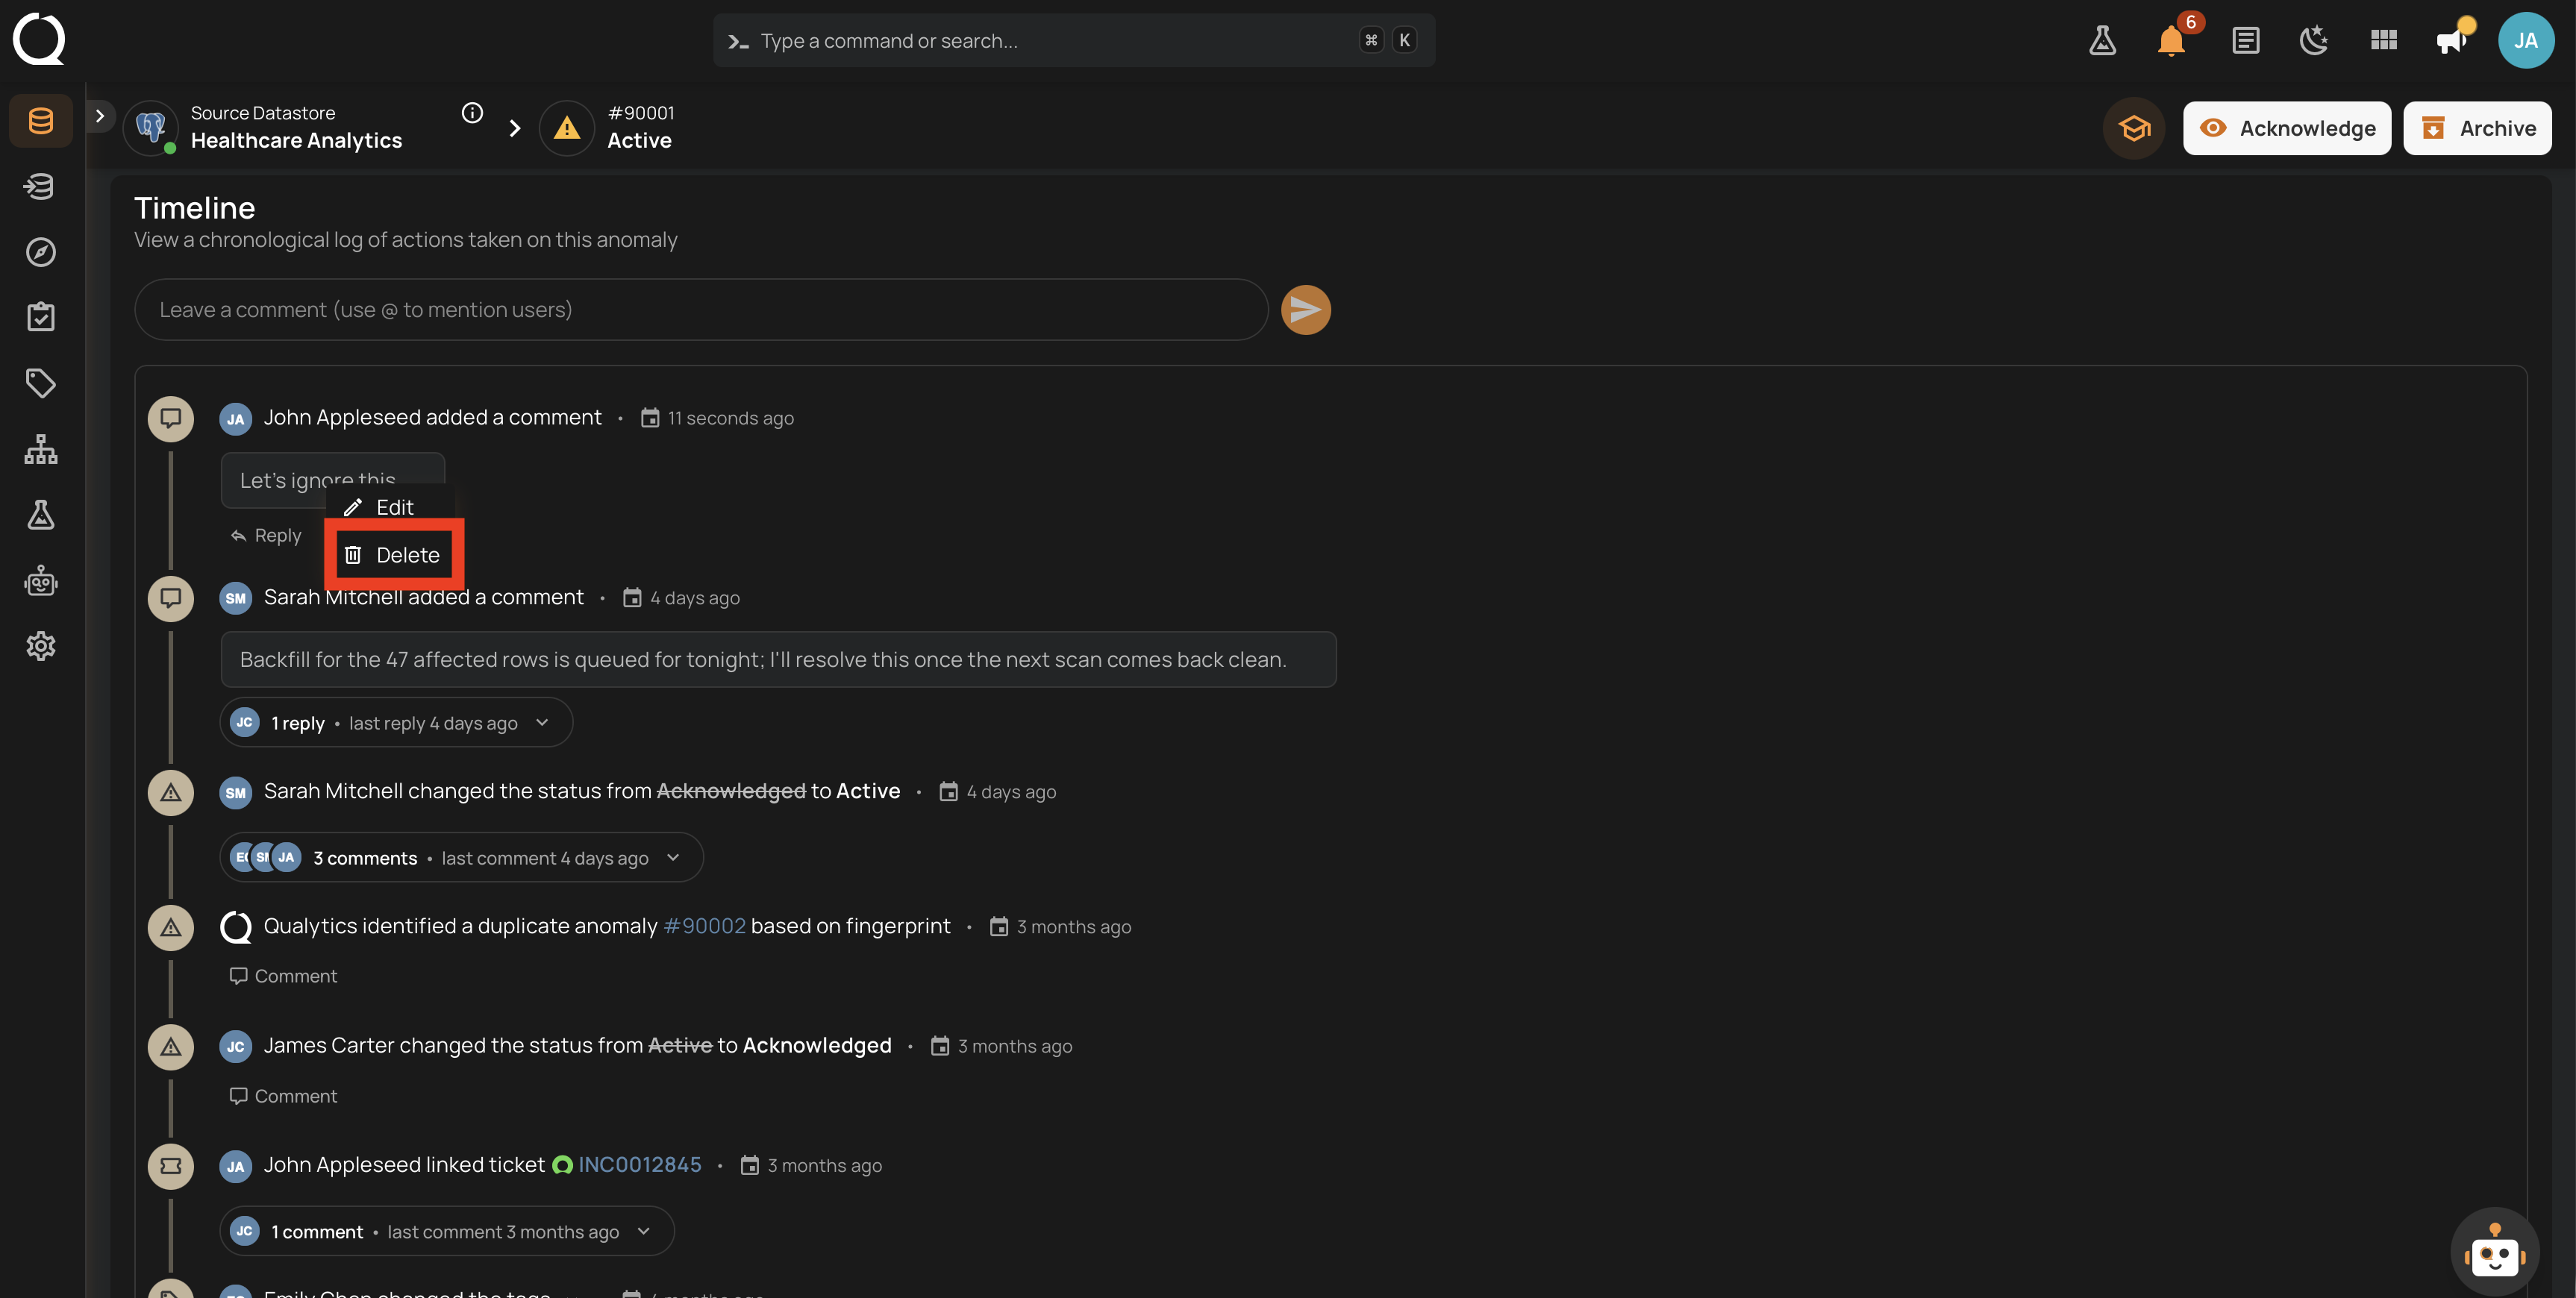
Step 2: Select Delete from the dropdown menu.
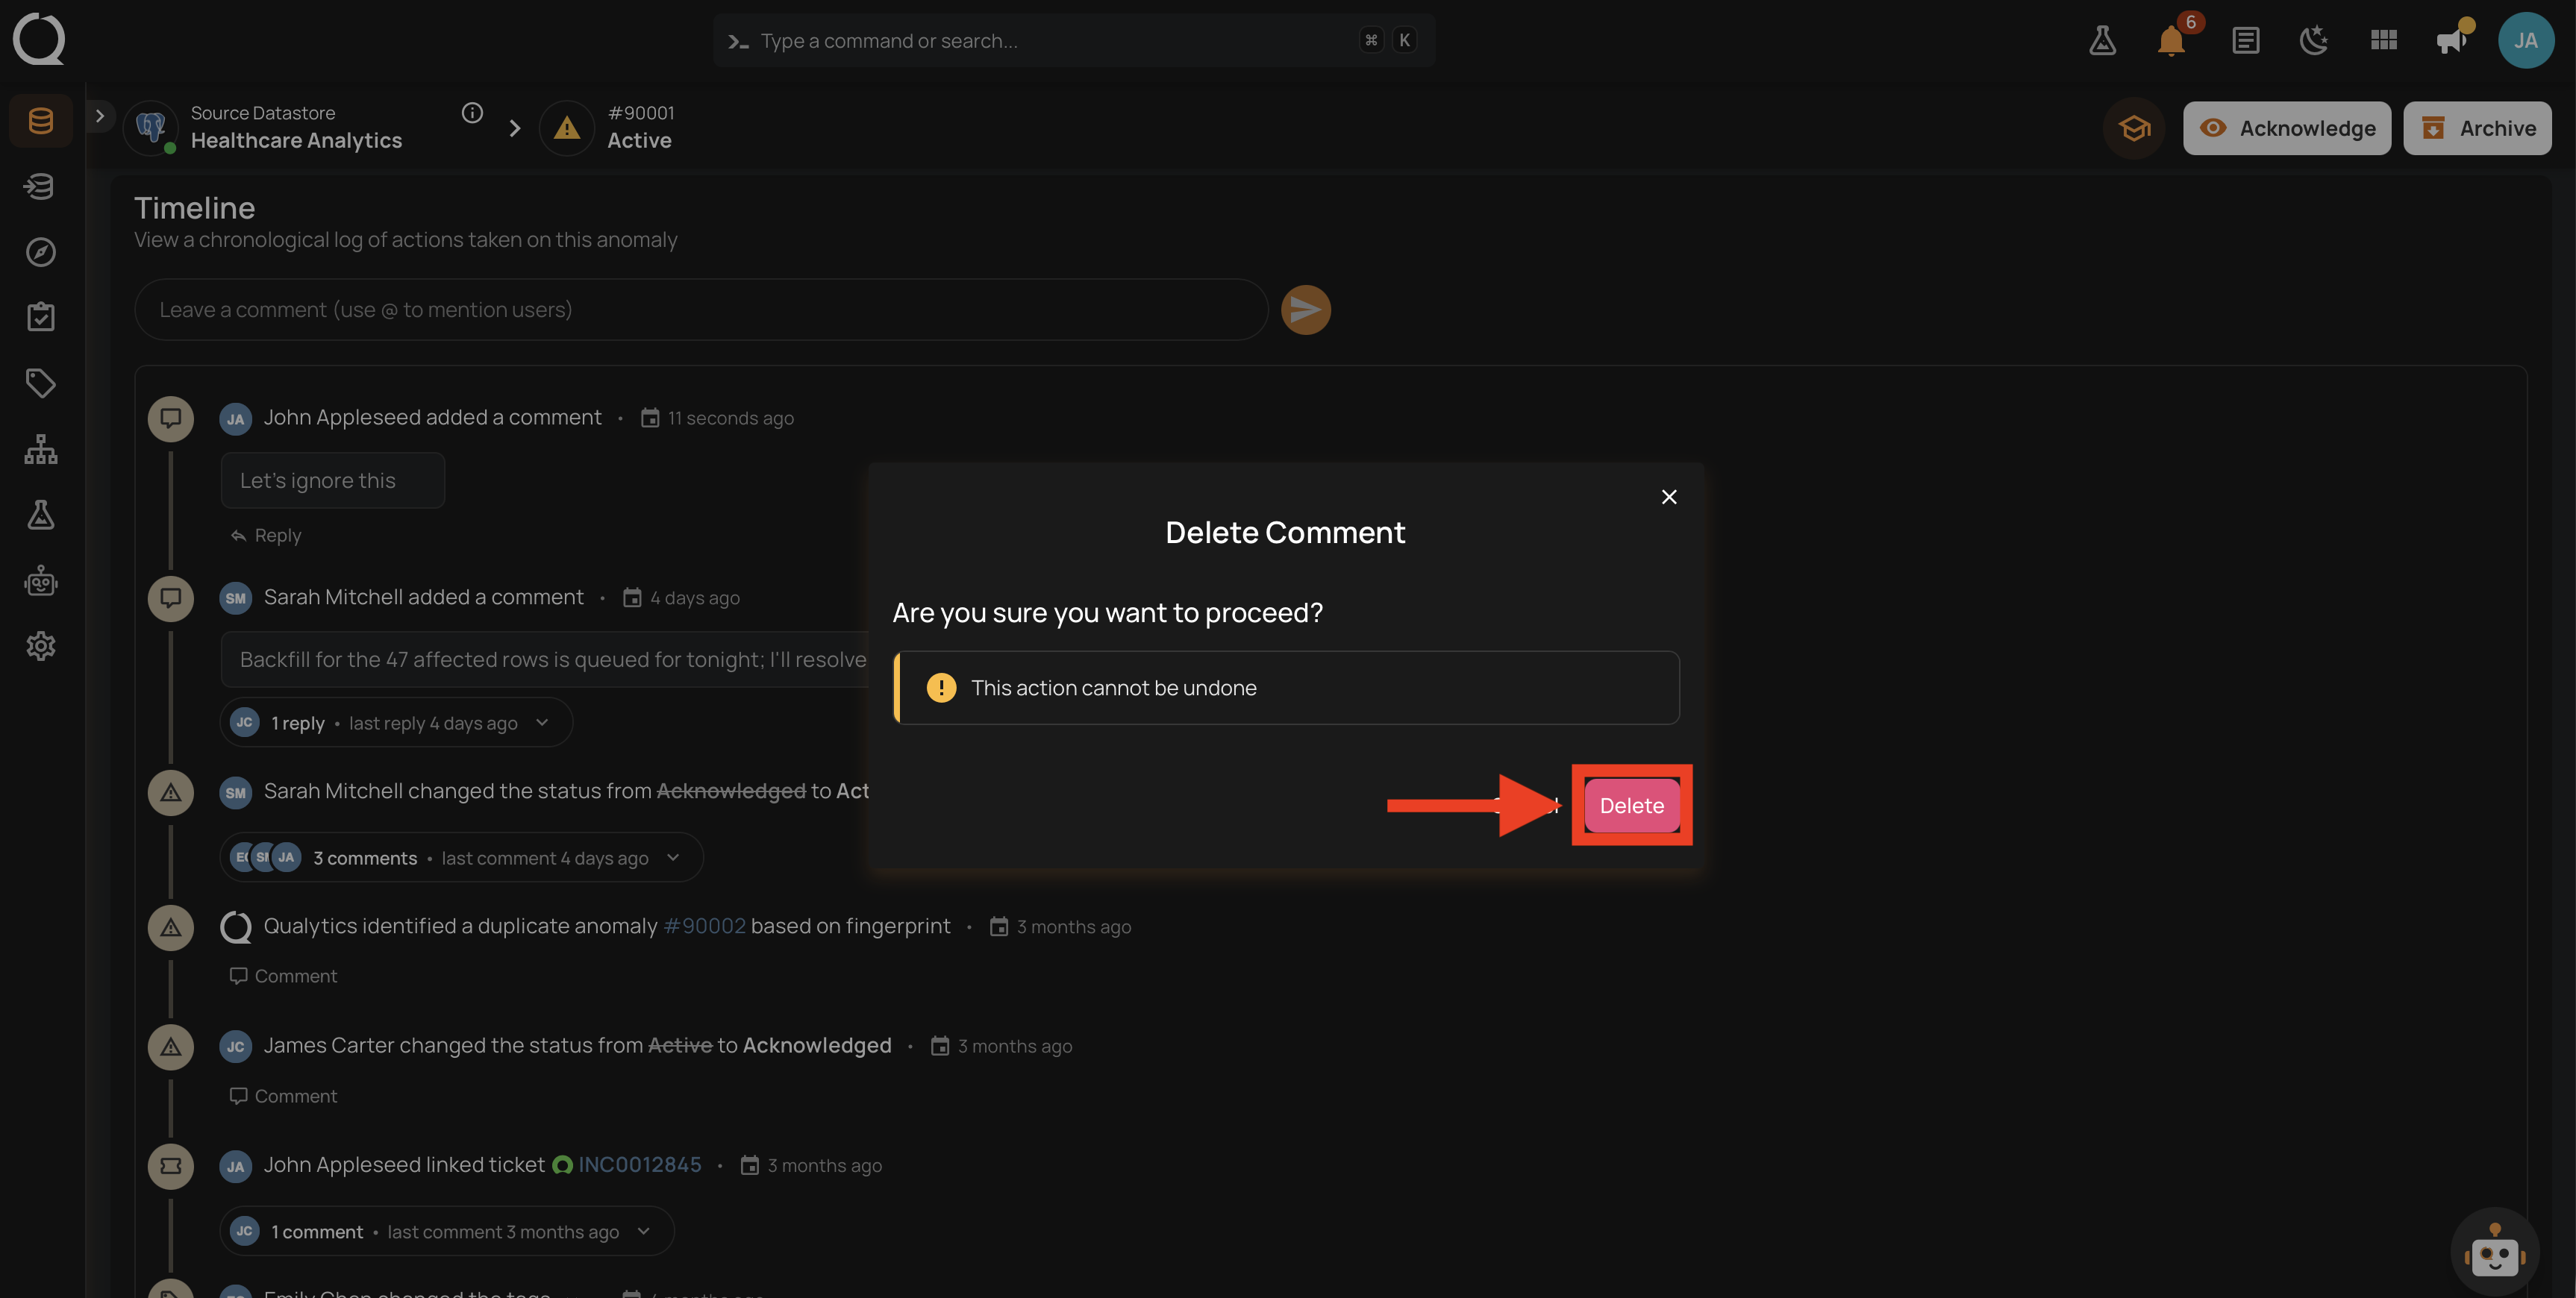
Step 3: A confirmation dialog opens, warning that the action cannot be undone.
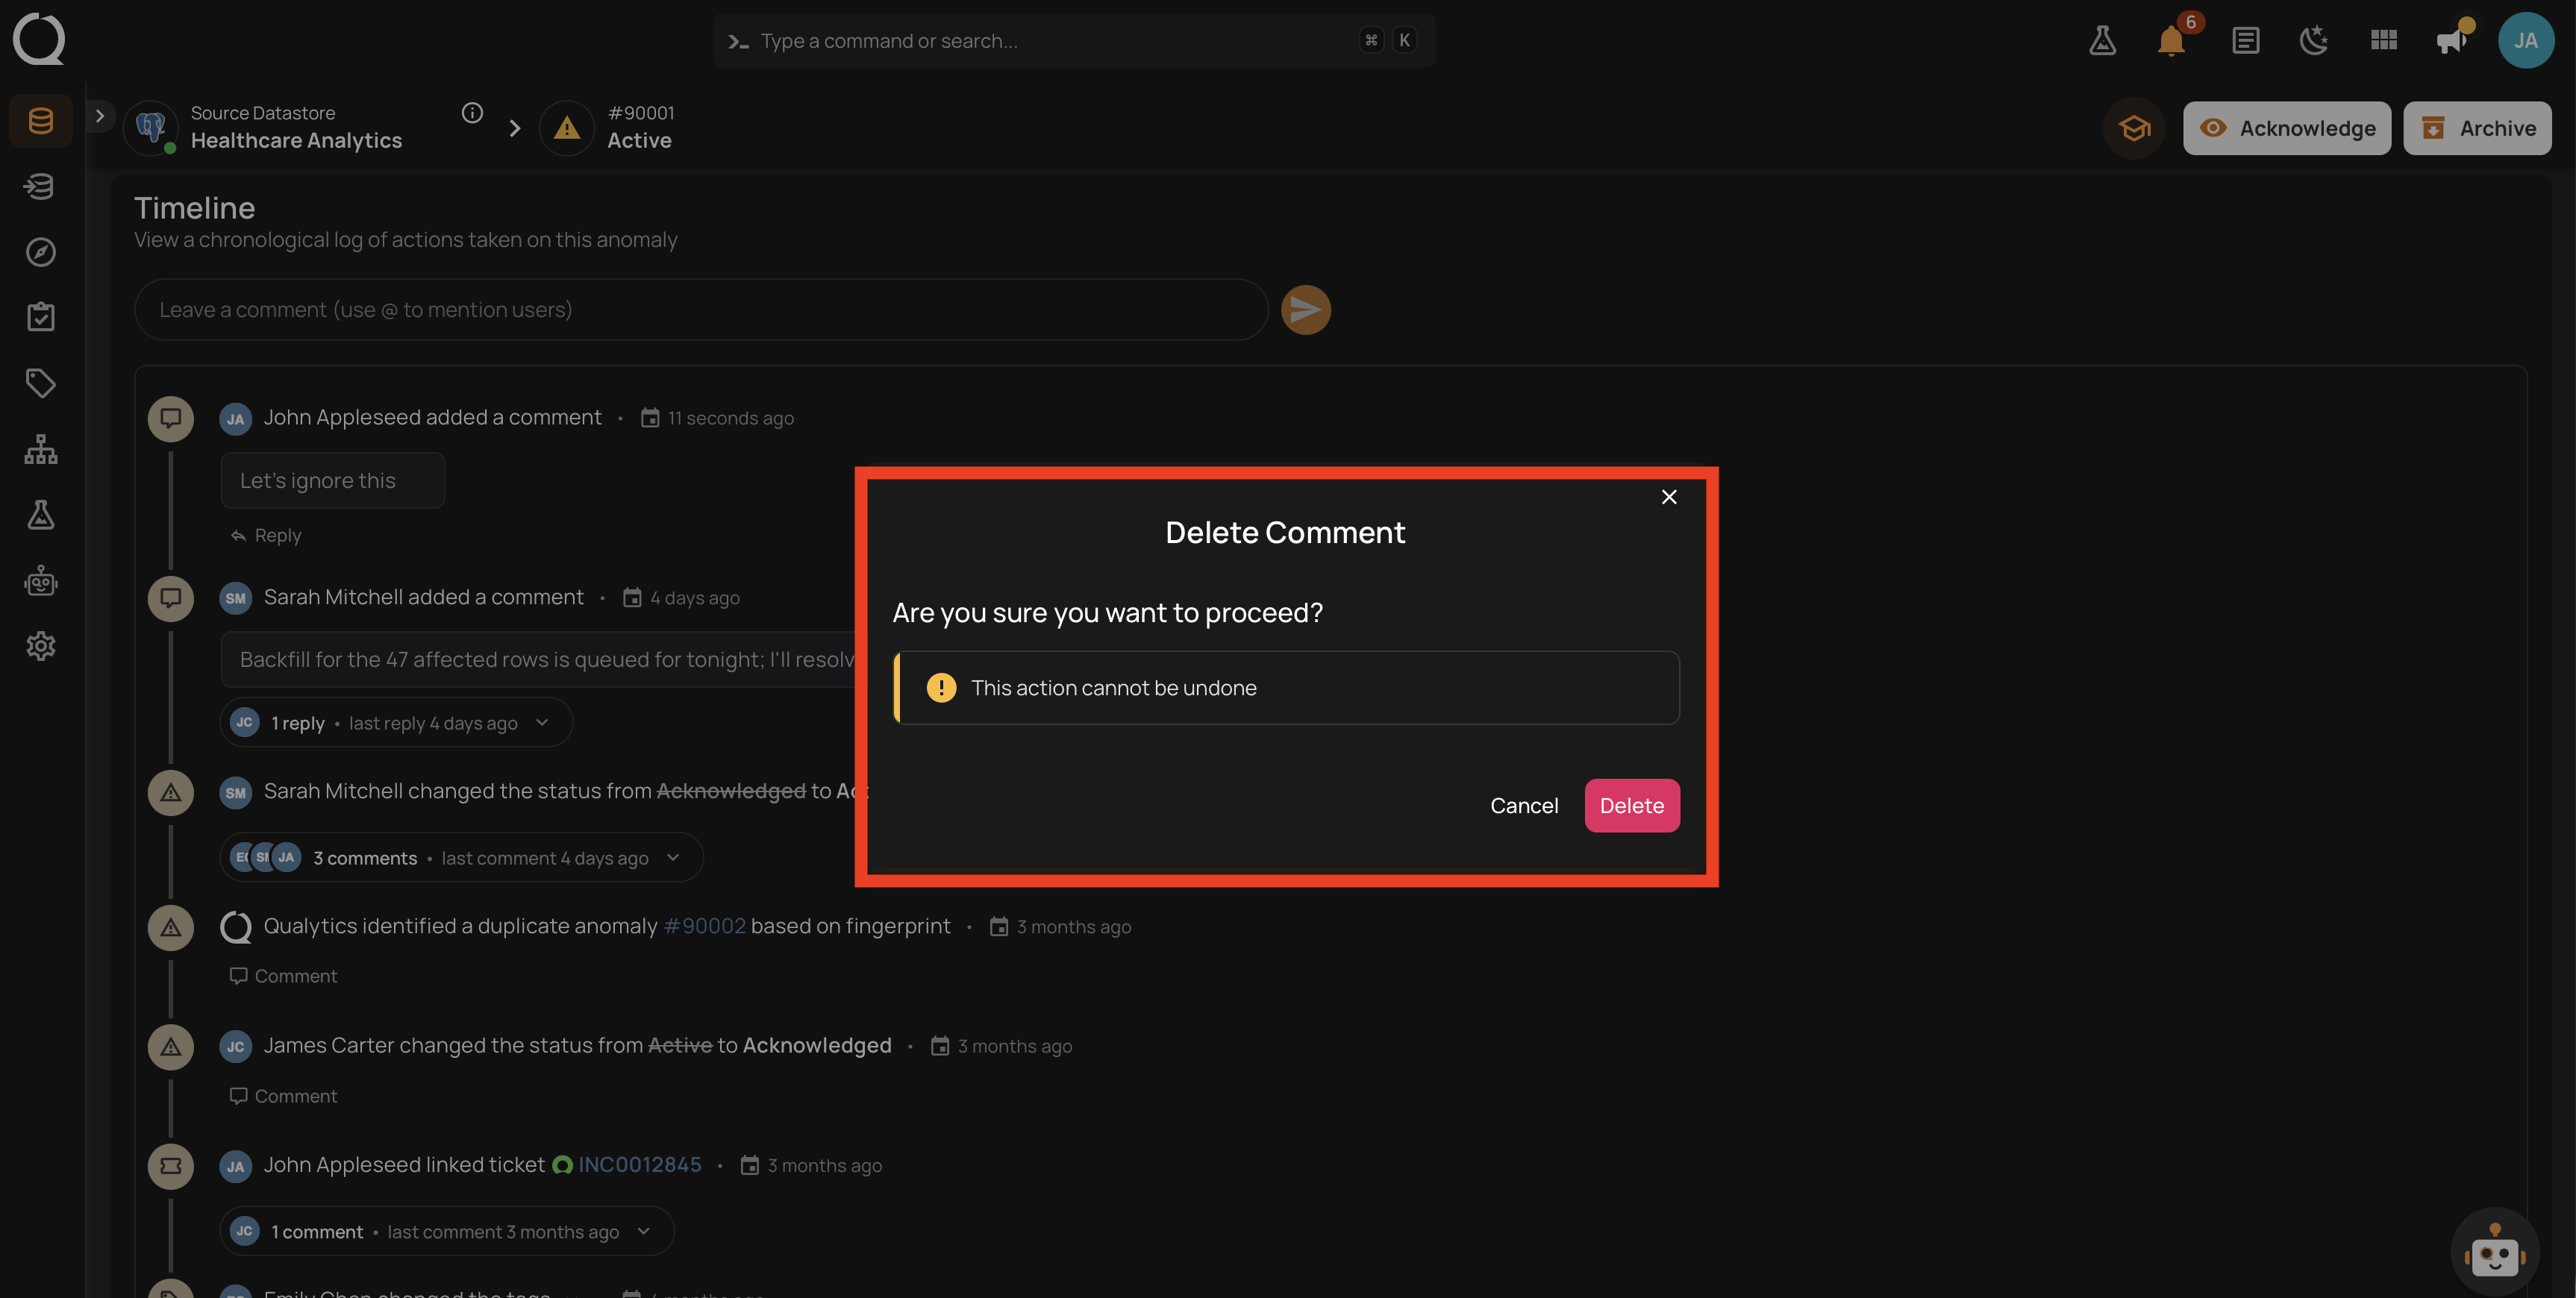
Step 4: Click Delete to confirm, or Cancel to keep the comment.
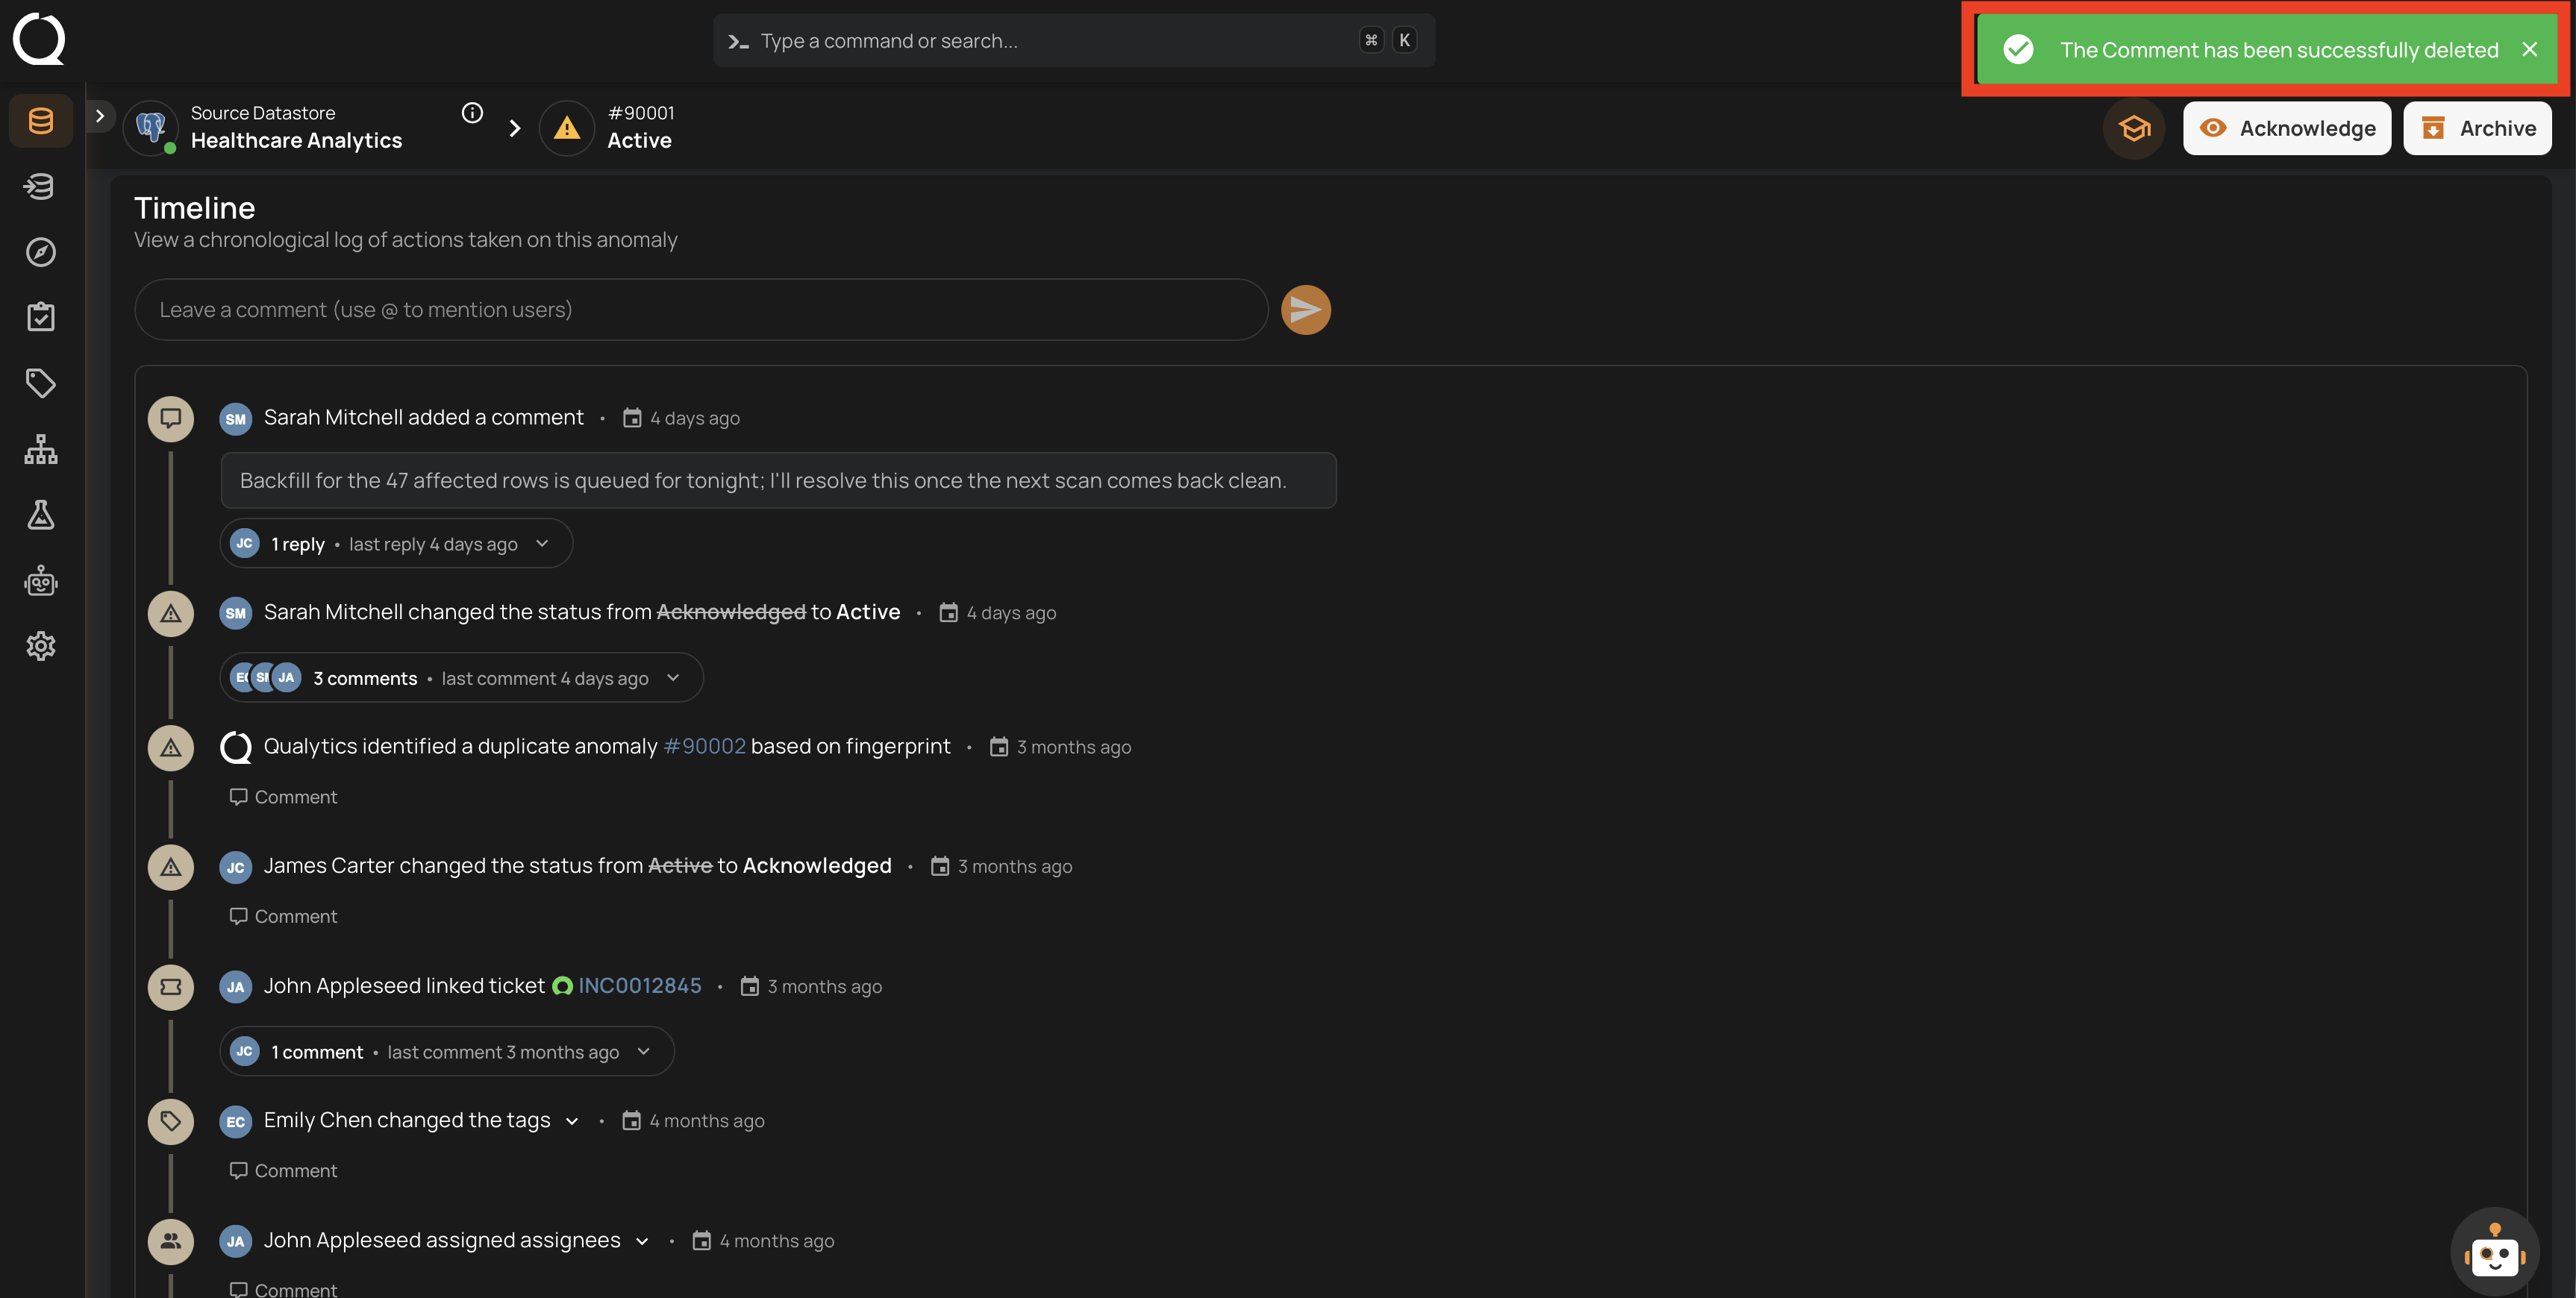
Step 5: A success message appears indicating the comment has been deleted.
Note
Deleting a comment that already has replies leaves a placeholder reading This comment was deleted so the replies stay visible and the thread still reads in order. The confirmation dialog states this before you delete. When the last reply is deleted, the placeholder disappears with it.
Comments from Linked Tickets
When the anomaly has a linked Jira issue, the Timeline's comments and the issue's comments mirror each other:
- A comment posted on the Timeline is pushed onto every linked issue that is synced two-way, opening with a panel that names its Qualytics author. Editing or deleting the comment in Qualytics updates the issue's copy the same way.
- A comment written on the issue is mirrored onto the Timeline, with the ticket it came from named beside the timestamp. It is attributed to the Qualytics user whose email matches the author's; when no user matches, it is shown under the author's display name from the ticketing system. Edits and deletions made on the issue follow along.
A mirrored comment without a Qualytics author cannot be edited in Qualytics, though an Admin can still delete it. See How the Jira Integration Works for the full behavior, including the read only switches that stop all writes to an issue.