Scan: Aborted
Aborted operations were stopped manually by a user (or by the platform during shutdown) before completion. Aborted operations expose a Resume action that picks up from where the operation stopped, alongside the usual Rerun and Delete actions. The Status badge shows the red Aborted state.
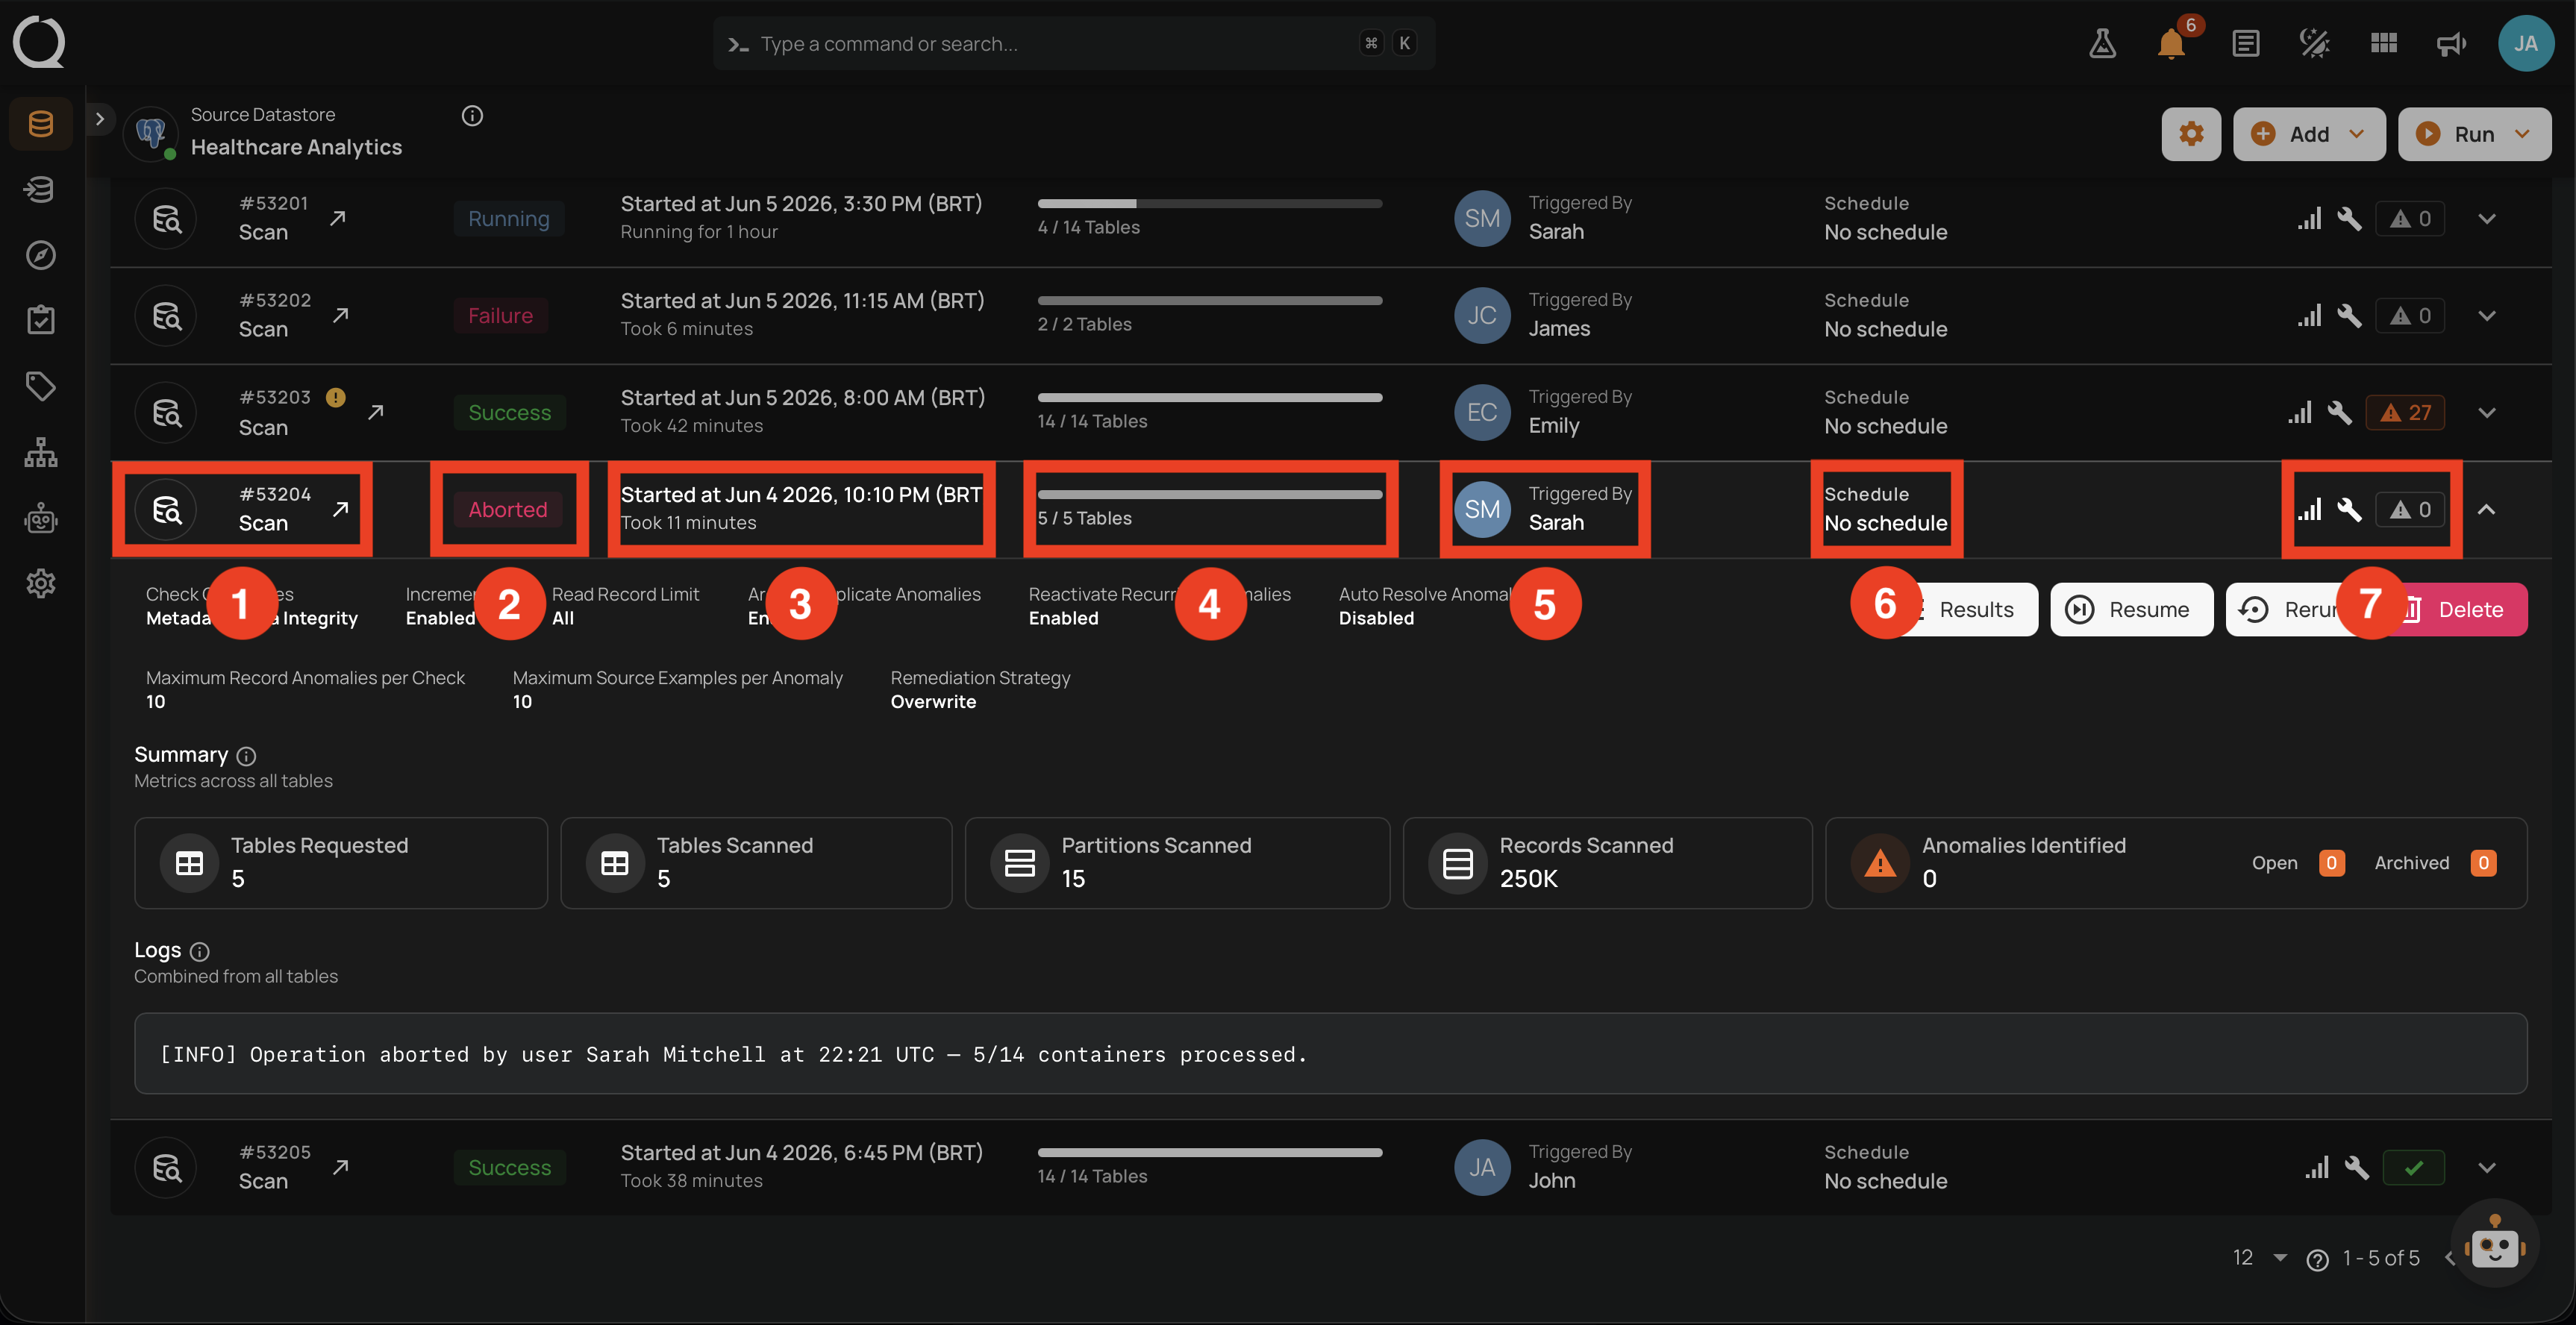
Expanded row in the operations list
Header of the operation
| No. | Element | What it shows |
|---|---|---|
| 1 | Operation ID and type | The unique identifier (for example #53204) and the operation type (Scan). The icon next to the ID links to the dedicated Overview of the operation. |
| 2 | Status badge | The red Aborted badge indicating the operation was stopped before completion. |
| 3 | Time info | Started At (for example Started at Jun 5 2026, 10:10 PM (BRT)) and Duration (the time elapsed up to the abort, for example Took 5 minutes). |
| 4 | Progress | Containers processed before the abort against the total requested (5 / 14 Tables). |
| 5 | Aborted By | The user (avatar and name) who aborted the operation. On Aborted runs this tile replaces the usual Triggered By tile. If the platform stopped the Run automatically (for example, a shutdown or an internal cleanup), the value is System. Hover the row to see a tooltip that lists both the aborter and the original user who launched the Run. |
| 6 | Schedule | The named schedule if recurring, otherwise No schedule. |
| 7 | Quick stats icons | A cluster of small status icons on the right of the row. Each icon shows a tooltip on hover summarizing configuration and result counters at a glance. See the Right-side icons (No. 7) in detail breakdown below this table. Not the row action buttons. |
The red Aborted badge differs from Failure in intent: Aborted means a user (or system shutdown) deliberately stopped the run; Failure means a fatal error did.
Right-side icons (No. 7) in detail
The scan-row cluster contains the following icons, left to right:
| Icon | Tooltip | Meaning |
|---|---|---|
| Incremental Field | Whether the scan ran in Incremental mode (filled when active) or Full (grey when the scan was Full). | |
| Remediation Strategy | The remediation strategy used for this run (filled when Append or Overwrite is set, grey when None). |
|
| / | Anomalies Identified | Total number of anomalies detected before the abort, with Open and Archived counts in the tooltip. Reflects partial work. |
| Anomalies Auto-Resolved | Number of previously open anomalies (Active or Acknowledged) that the partial run automatically resolved. Shown only on Full scans where Auto Resolve was enabled and at least one anomaly was resolved before the abort. |
Details of the operation
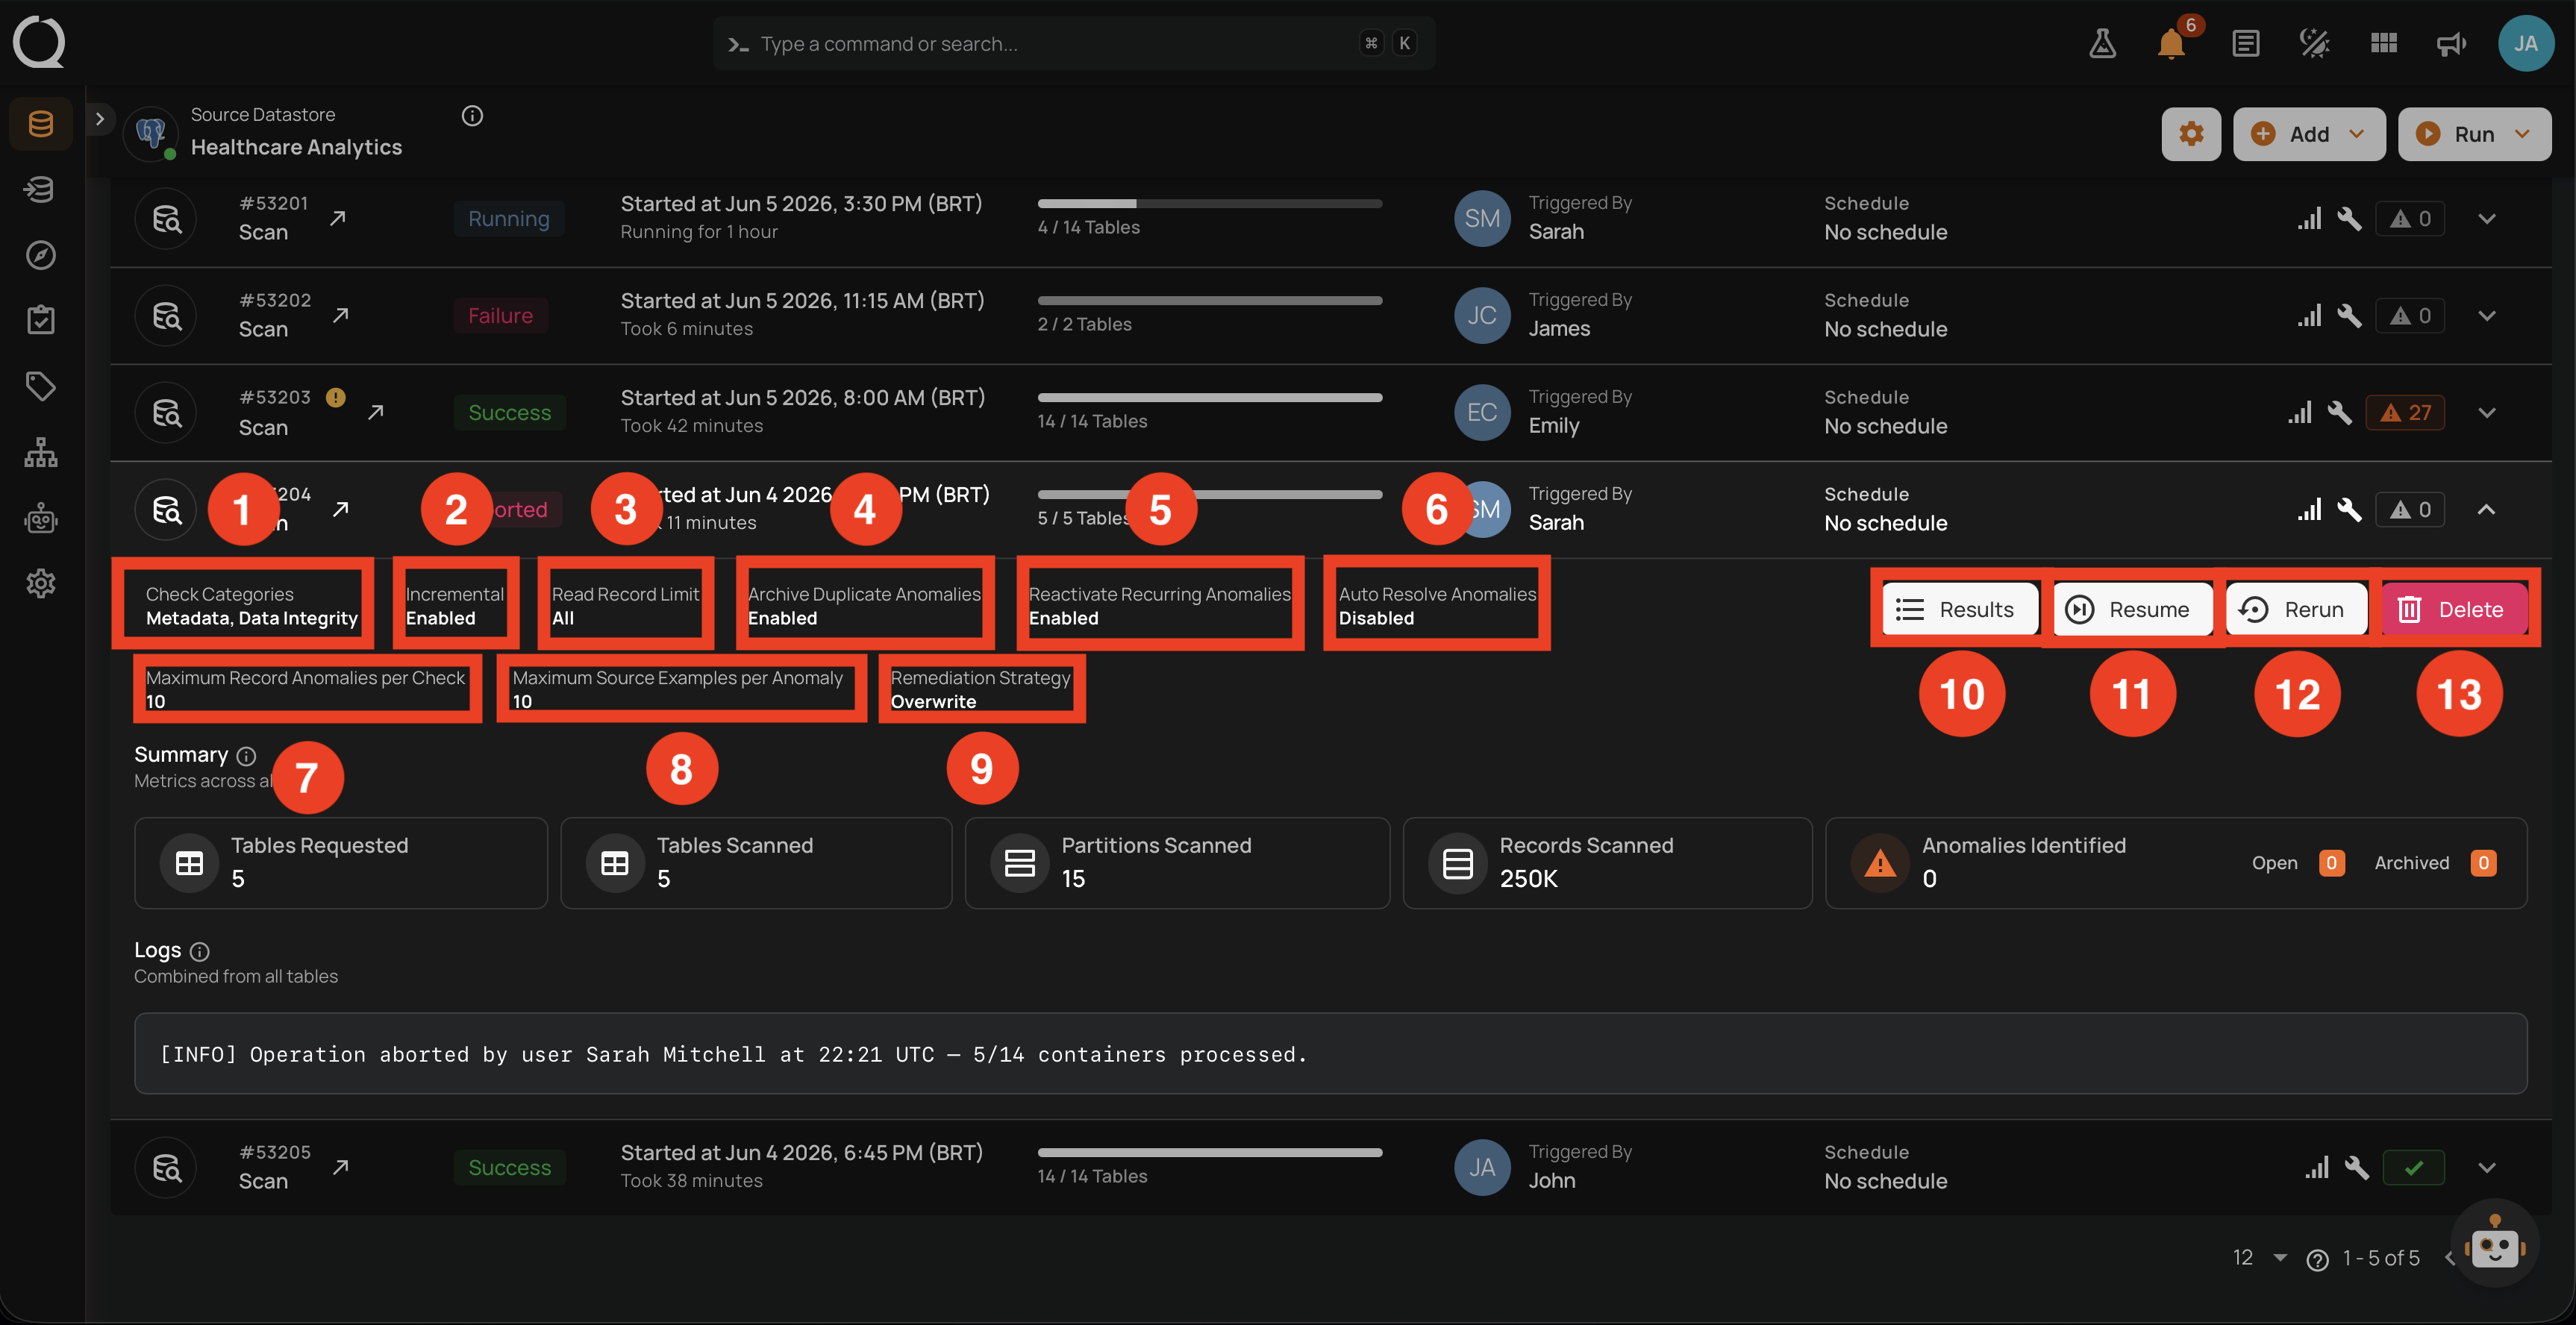
Expanding the row reveals the Settings used for the run (read-only) and the inline action buttons, including Resume which is unique to Aborted (and recoverable Failure) operations.
| No. | Setting | What it shows |
|---|---|---|
| 1 | Check Categories | Which categories were configured. |
| 2 | Incremental | Read strategy used. |
| 3 | Read Record Limit | Per-container record cap. |
| 4 | Archive Duplicate Anomalies | Setting from Step 4. |
| 5 | Reactivate Recurring Anomalies | Setting from Step 4. |
| 6 | Auto Resolve Anomalies | Setting from Step 4 (Full scans only). |
| 7 | Maximum Record Anomalies per Check | The rollup threshold used. |
| 8 | Maximum Source Examples per Anomaly | Source examples cap used. |
| 9 | Remediation Strategy | The remediation strategy applied. |
| 10 | Results | Opens the Scan Results modal for the containers processed before the abort. |
| 11 | Resume | Continues the operation from where it stopped, with the same settings. |
| 12 | Rerun | Replays the operation as a fresh run with the same configuration, starting from container 1 (does not preserve what was already processed before the abort; use Resume instead when you want to continue without reprocessing). |
| 13 | Delete | Removes the operation record from the Activity list. Anomalies and other downstream artifacts produced by the Run are preserved. |
Resume is the differentiator for Aborted operations: it picks up exactly where the run stopped (container N+1 onwards) without reprocessing the containers that already completed.
Summary
| No. | Metric | What it shows |
|---|---|---|
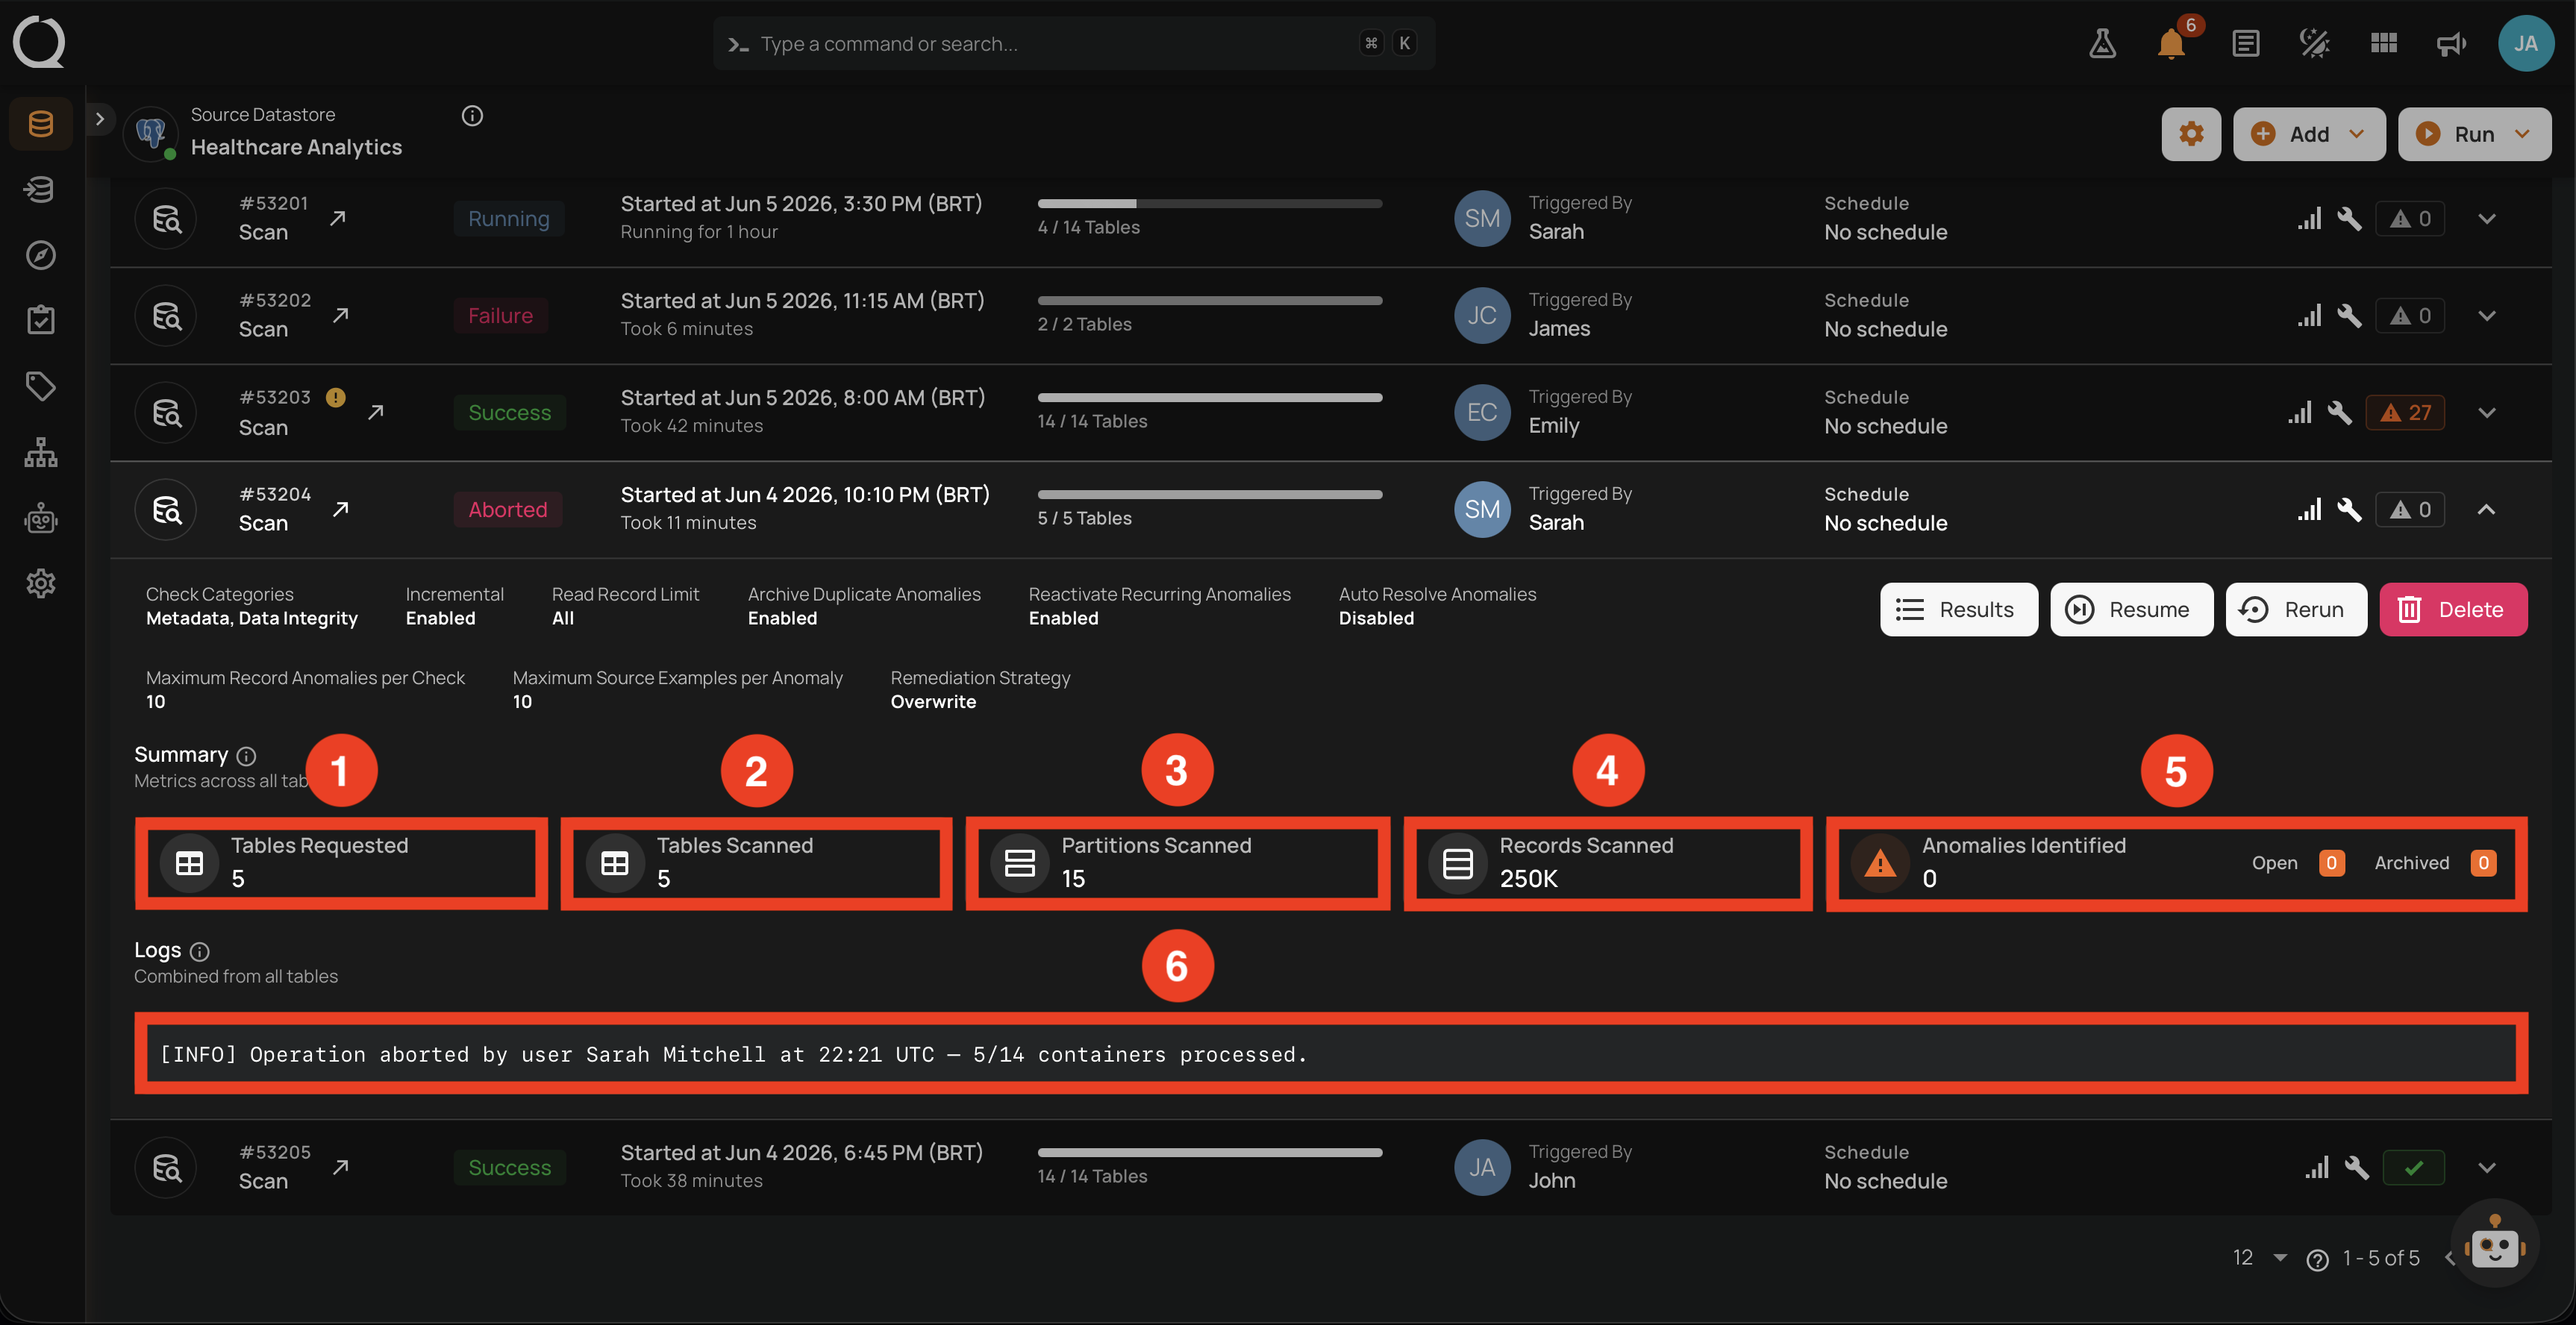
| 1 | Tables Requested | Total containers targeted (full requested list, unchanged by the abort). |
| 2 | Tables Scanned | How many containers completed before the abort. |
| 3 | Partitions Scanned | Partitions read up to the abort. |
| 4 | Records Scanned | Records processed up to the abort. |
| 5 | Anomalies Identified | Anomalies detected on the containers that completed before the abort. |
For Aborted scans the counters reflect partial work. Use these numbers to estimate what is still pending if you choose Resume.
Logs
The Logs block on the expanded Aborted row surfaces the [INFO], [WARN], and [ERROR] lines emitted during the partial run, in chronological order. For Aborted operations, the block ends with an [INFO] line that records the abort actor and timestamp (for example, "Operation aborted by Sarah Mitchell at 2026-06-05 22:21 UTC"). The same block is surfaced on the operation detail page in a wider view (see the Logs block under Operation detail page below).
The Logs confirm who stopped the run and when. Review them before deciding whether to Resume or Rerun.
Operation detail page
Clicking the row opens the dedicated operation detail page, which has two top-level tabs: Overview and Results. The Overview tab presents the operation's properties, settings, partial metrics, log entries, and chronological timeline. The Results tab drills into the containers that completed before the abort.
Overview tab
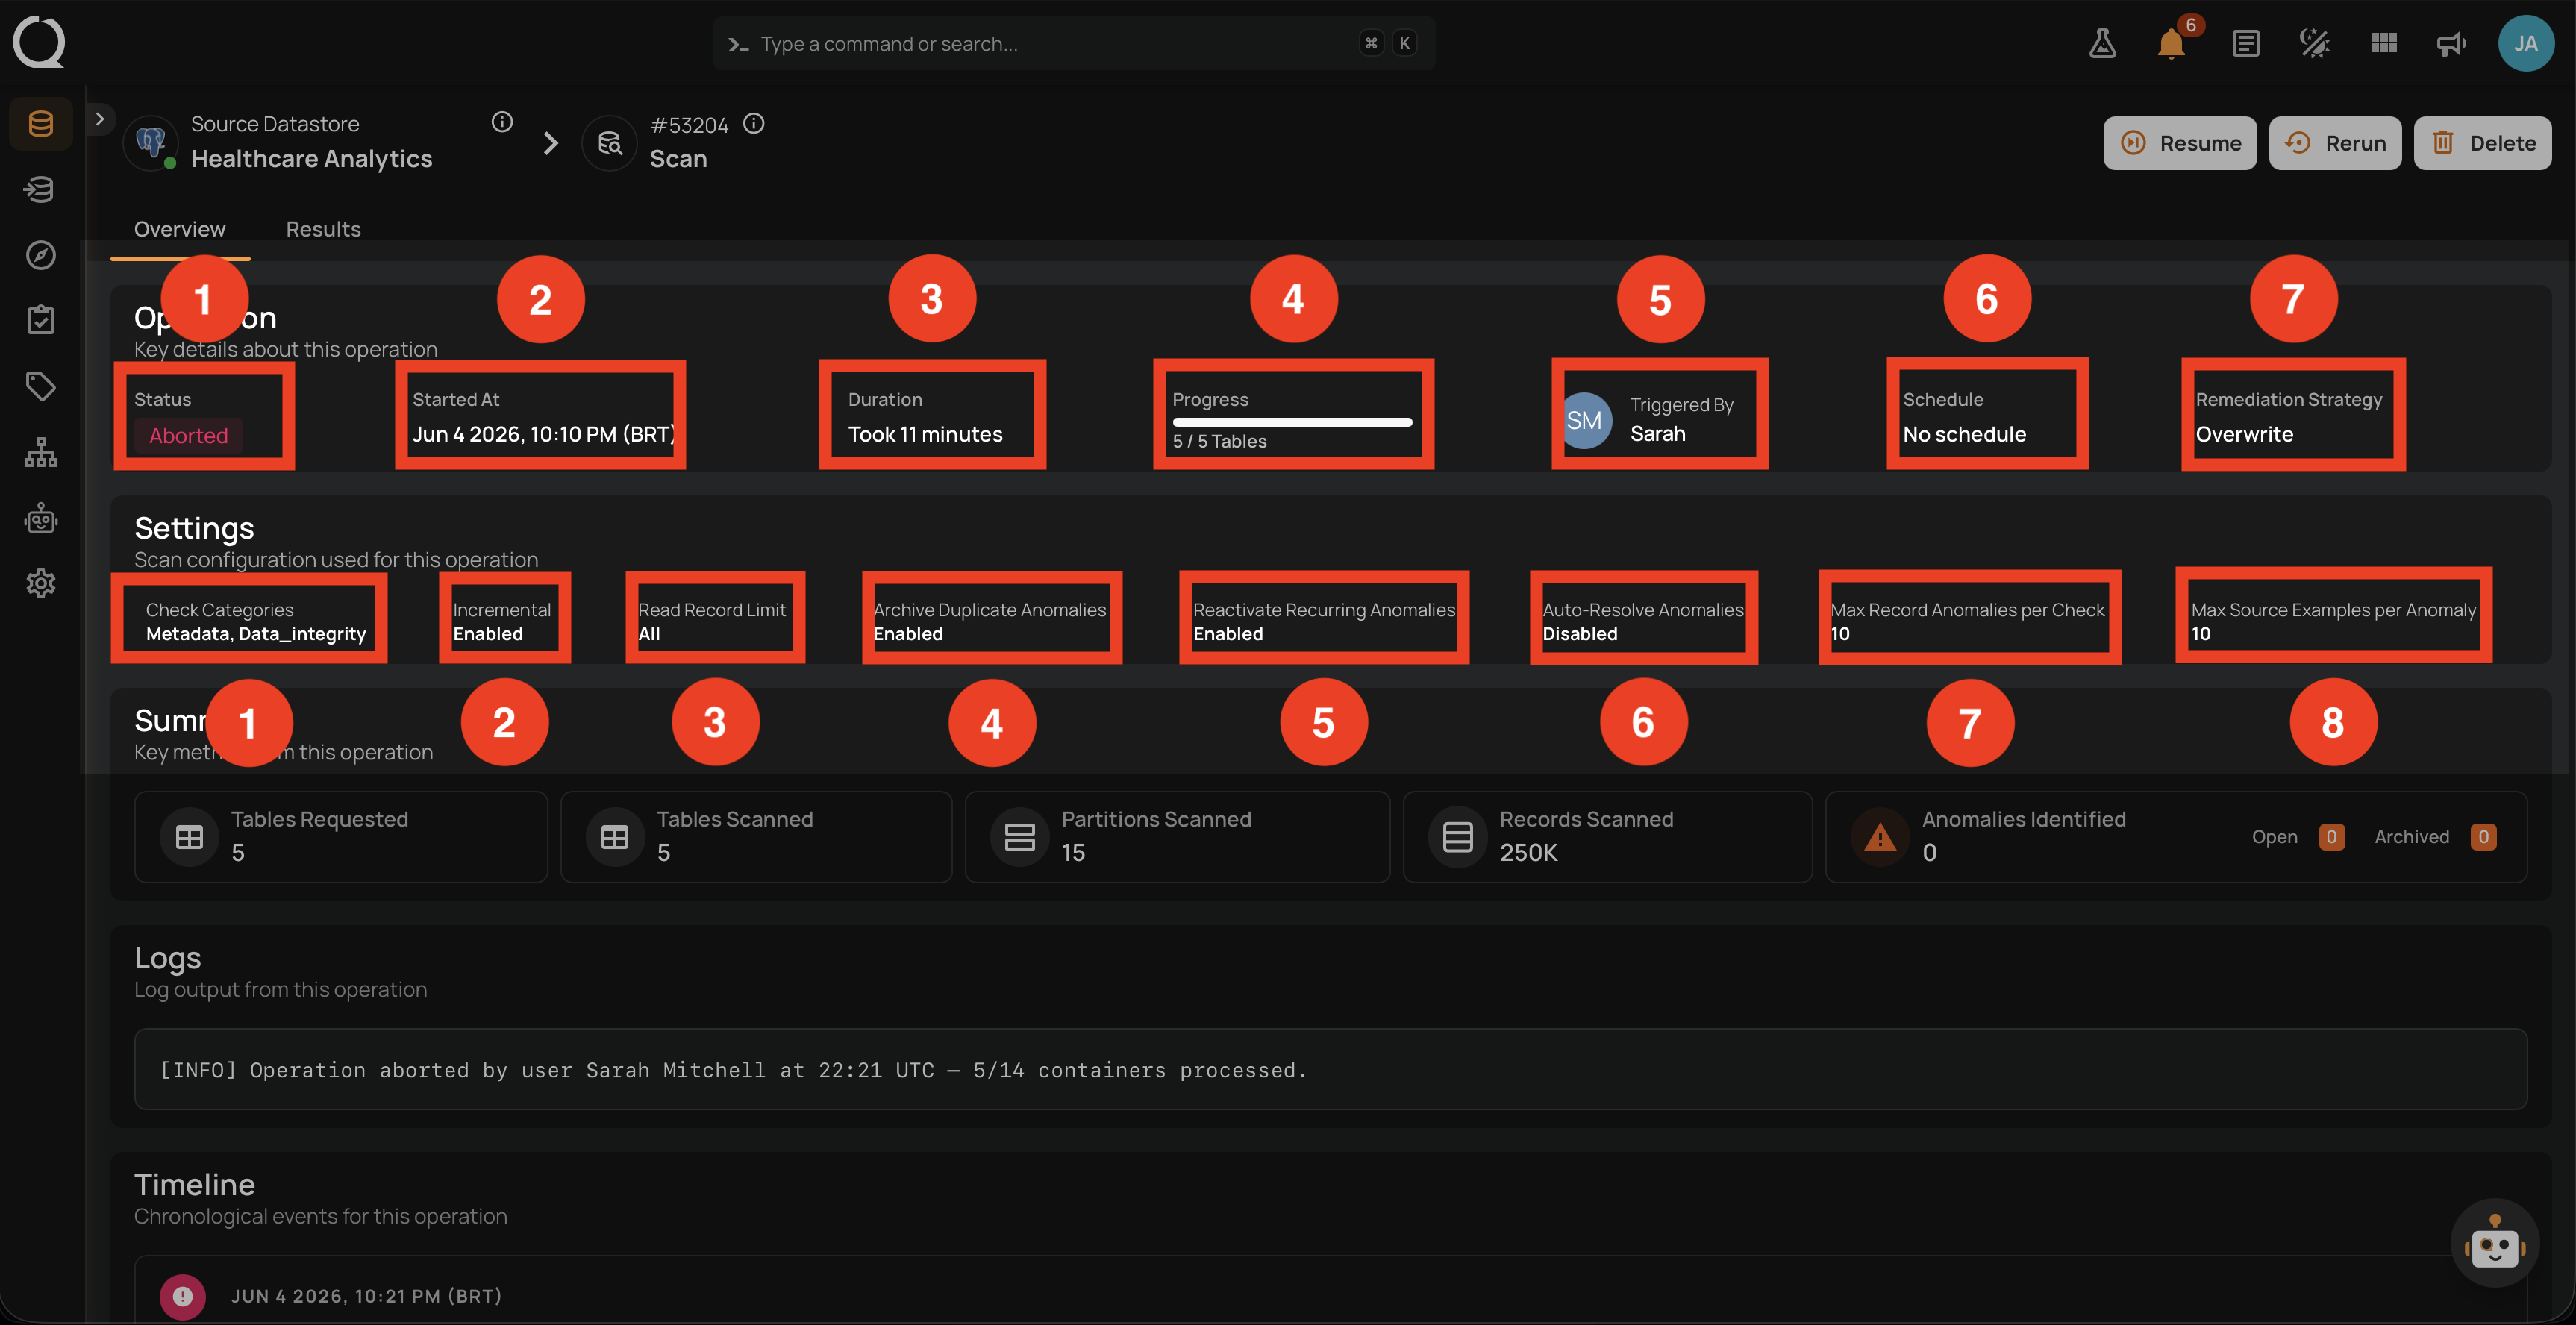
The Overview tab opens with a snapshot of the run, organized into five blocks: Operation, Settings, Summary, Logs, and Timeline.
Operation block
The Operation block at the top carries the properties that summarize the run identity and outcome up to the abort.
| No. | Element | What it shows |
|---|---|---|
| 1 | Status | The state badge (Aborted, red). |
| 2 | Started At | Exact start timestamp. |
| 3 | Duration | How long the run lasted up to the abort. |
| 4 | Progress | Containers processed against total requested (often partial, for example 5 / 14). |
| 5 | Aborted By | The user who aborted the operation, or System when the platform stopped the Run automatically. Hover the tile to see the original user who launched the Run alongside the aborter. The Timeline block below also records both events with exact timestamps. |
| 6 | Schedule | The named schedule (or No schedule). |
| 7 | Remediation Strategy | Effective remediation strategy for the run. |
Settings block
The Settings block lists the scan settings used for the run (same fields as the row's Details section, minus the action buttons).
| No. | Setting | What it shows |
|---|---|---|
| 1 | Check Categories | Categories selected in Step 2 (for example, Metadata, Data_Integrity). |
| 2 | Incremental | Whether Incremental was the read strategy (Enabled/Disabled). |
| 3 | Read Record Limit | Per-container record cap (All if uncapped). |
| 4 | Archive Duplicate Anomalies | Setting from Step 4 (Enabled/Disabled). |
| 5 | Reactivate Recurring Anomalies | Setting from Step 4. |
| 6 | Auto-Resolve Anomalies | Setting from Step 4 (Full scans only). |
| 7 | Max Record Anomalies per Check | Rollup threshold used. |
| 8 | Max Source Examples per Anomaly | Source examples cap used. |
Together, the Operation and Settings blocks act as the canonical "what happened" snapshot of the run. If the operation looks wrong, this is the first place to check the inputs.
Summary block
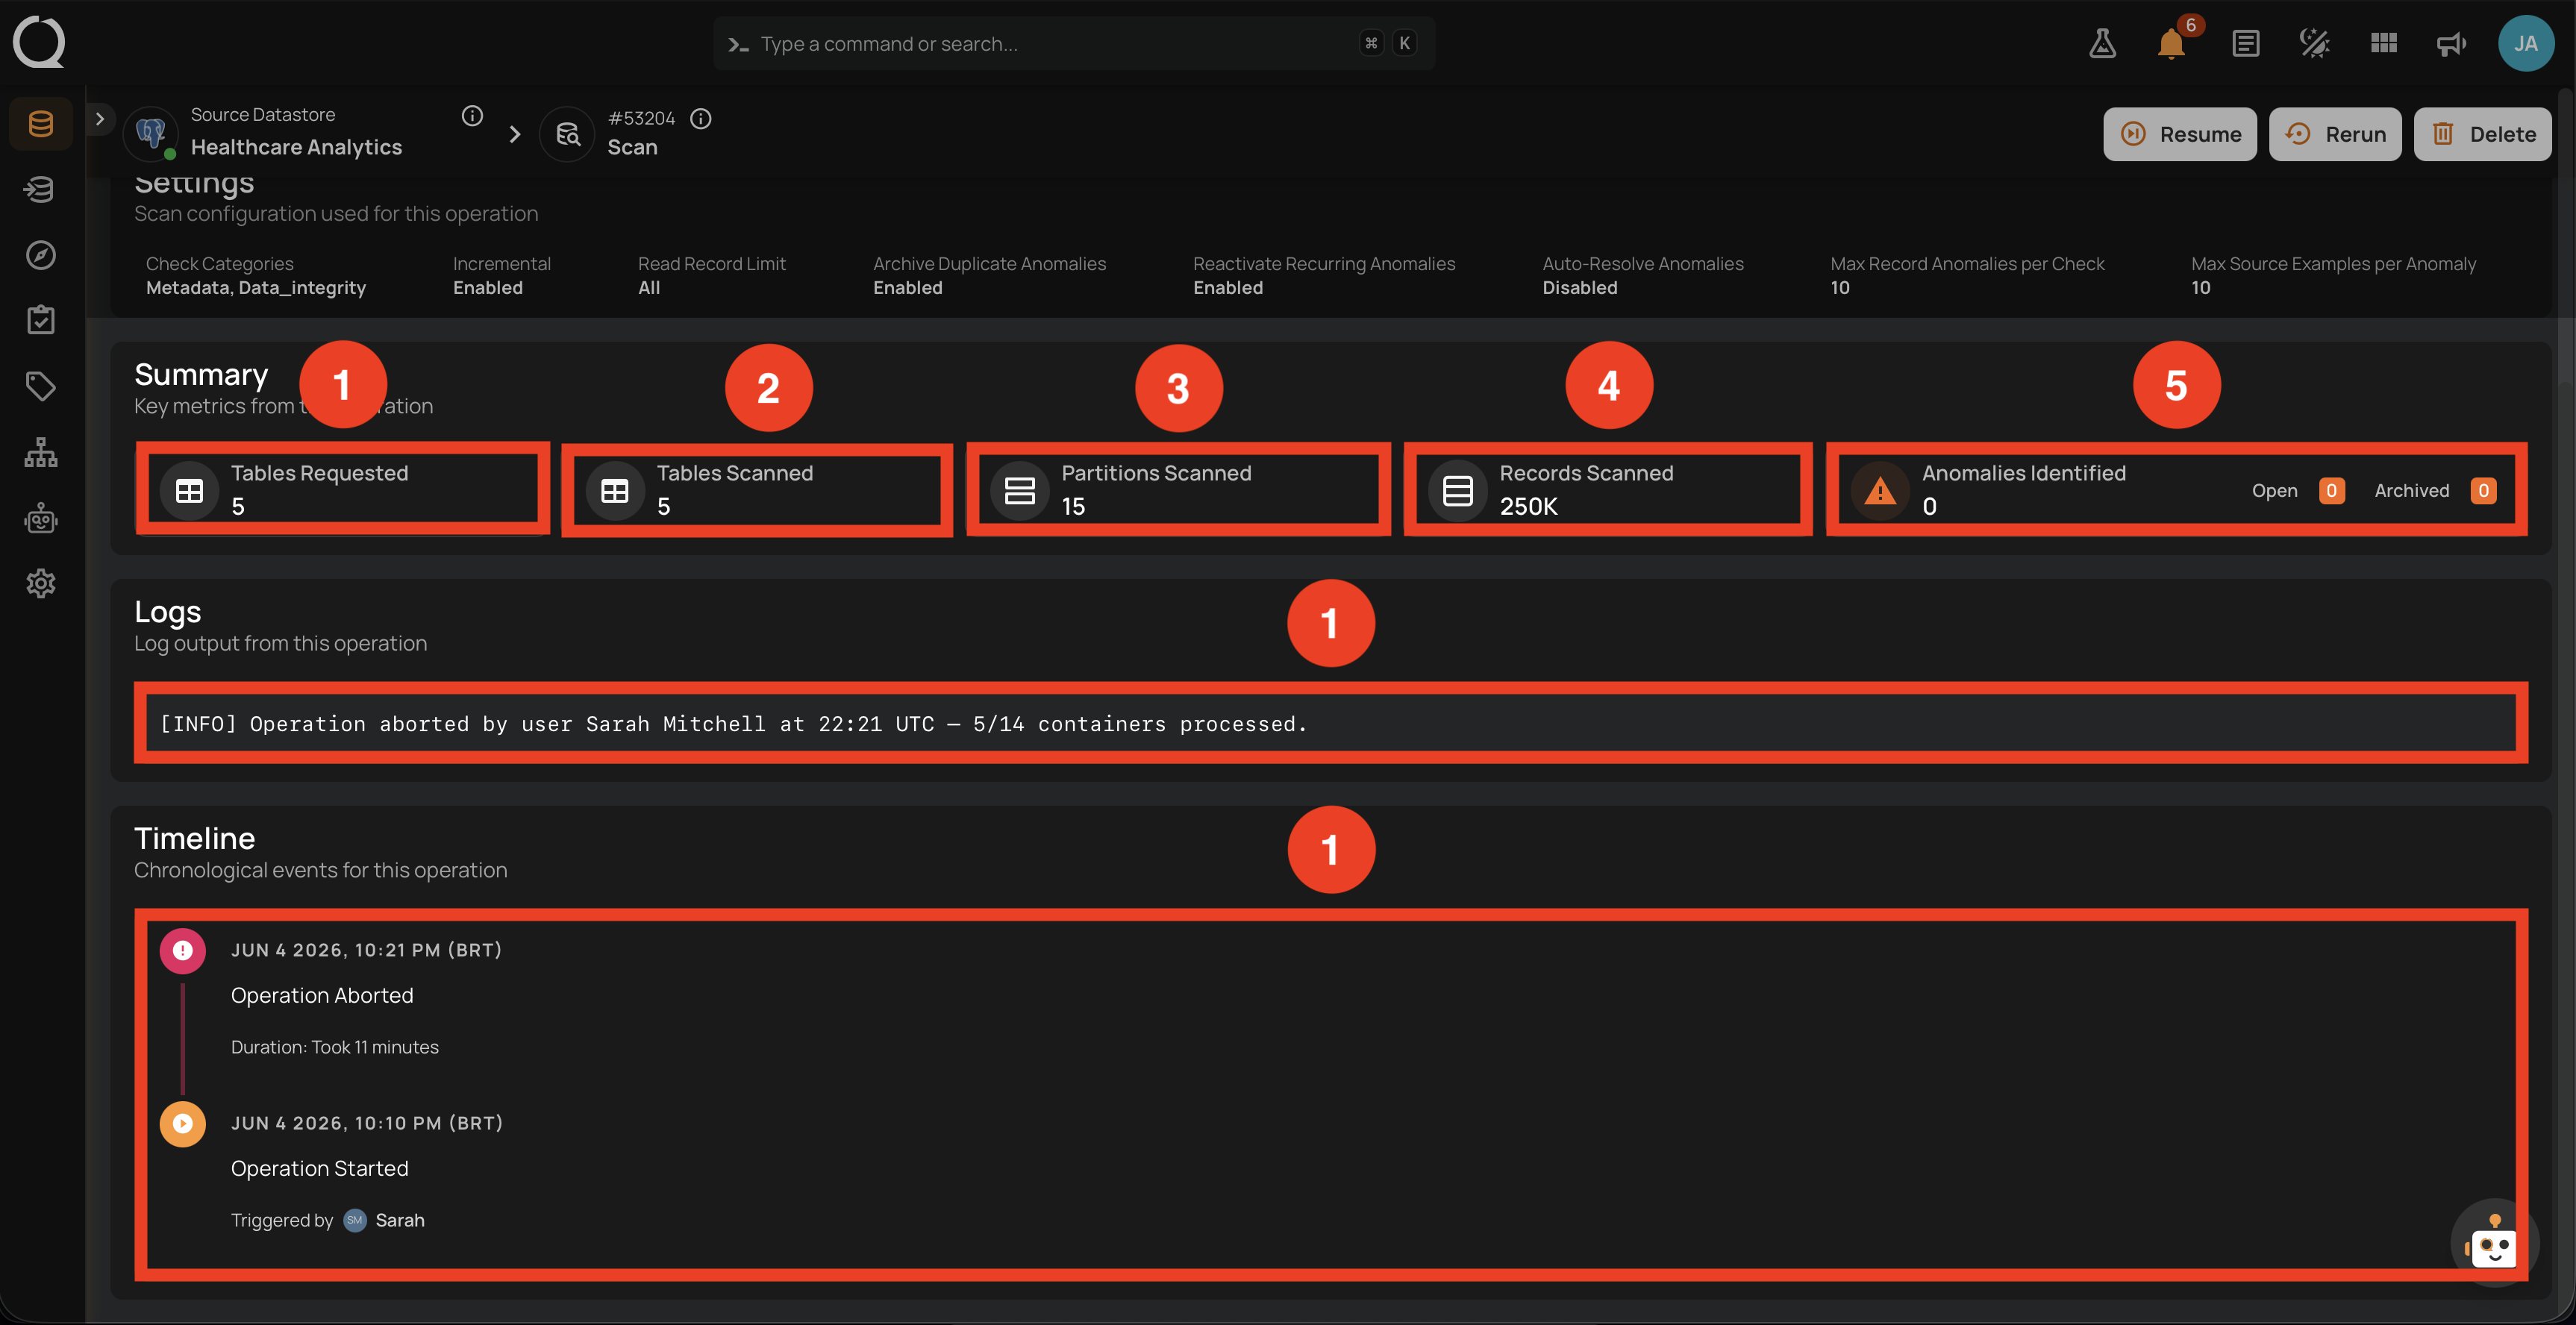
Scrolling down on the Overview tab shows the Summary block, which repeats the partial metrics from the expanded row. The screenshot below covers Summary, Logs, and Timeline in a single view.
| No. | Element | What it shows |
|---|---|---|
| 1 | Tables Requested | Total containers targeted (unchanged by the abort). |
| 2 | Tables Scanned | Containers that completed before the abort. |
| 3 | Partitions Scanned | Partitions read up to the abort. |
| 4 | Records Scanned | Records processed up to the abort. |
| 5 | Anomalies Identified | Anomalies detected on the containers that completed before the abort, split into Open and Archived. |
Logs block
The Logs block surfaces the same messages from the row's Logs section, in a wider full-screen-friendly view. For Aborted scans, the block usually ends with an [INFO] line confirming the abort actor and timestamp. Each log line has the following structure.
| Part | Element | What it shows |
|---|---|---|
| Severity tag | [INFO], [WARN], or [ERROR] |
Severity of the log line. Aborted operations typically emit [INFO] status confirmations ("Operation aborted by <user>") plus any [WARN]/[ERROR] lines accumulated before the abort. |
| Message | Human-readable text | The narrative explaining what the platform encountered. Examples: "Container scan started: customers", "Container scan completed: customers (50K records)", "Operation aborted by Sarah Mitchell at 2026-06-05 22:21 UTC". |
| Order | Position in the block | Lines are listed in chronological order from top (earliest) to bottom (most recent), mirroring the event sequence visible on the Timeline. |
Timeline block
The Timeline is critical for Aborted: it records the exact user (or system) who stopped the run and the time at which it happened. Each entry follows the same structure.
| Part | Element | What it shows |
|---|---|---|
| Status icon | Marker on the left | A marker colored by event type. See the legend below. |
| Timestamp | Date and time | When the event was recorded, in the viewer's timezone. Sorted from most recent at the top to oldest at the bottom. |
| Event title | Short label | The event identity (for example, Operation Started, Container scan completed, Operation Aborted by <user>, Operation Aborted). |
| Event detail | Context line | Additional information specific to the event: duration, the user who triggered the operation, the container name involved, the abort actor, or other event-specific data. |
Timeline icon legend:
- Operation Success terminal entry.
- Operation Failure terminal entry.
- Operation Aborted terminal entry.
- Operation In Progress (Queued or Running, animated in the UI).
- Operation Started.
- Per-container entries inherit the same icon and color based on each container's own outcome (Success/Failure/Aborted/Running).
For an Aborted scan, the typical events are:
Operation Abortedat the top, with the abort timestamp and total elapsed time.Operation Aborted by <user>, with the avatar and name of the user who stopped the run. The row already shows this user in the Aborted By tile and in the row tooltip; the Timeline entry adds the exact abort timestamp for the audit record.- One
Container scan completedentry per container that finished before the abort. Operation Startedat the bottom, withTriggered by <user>.
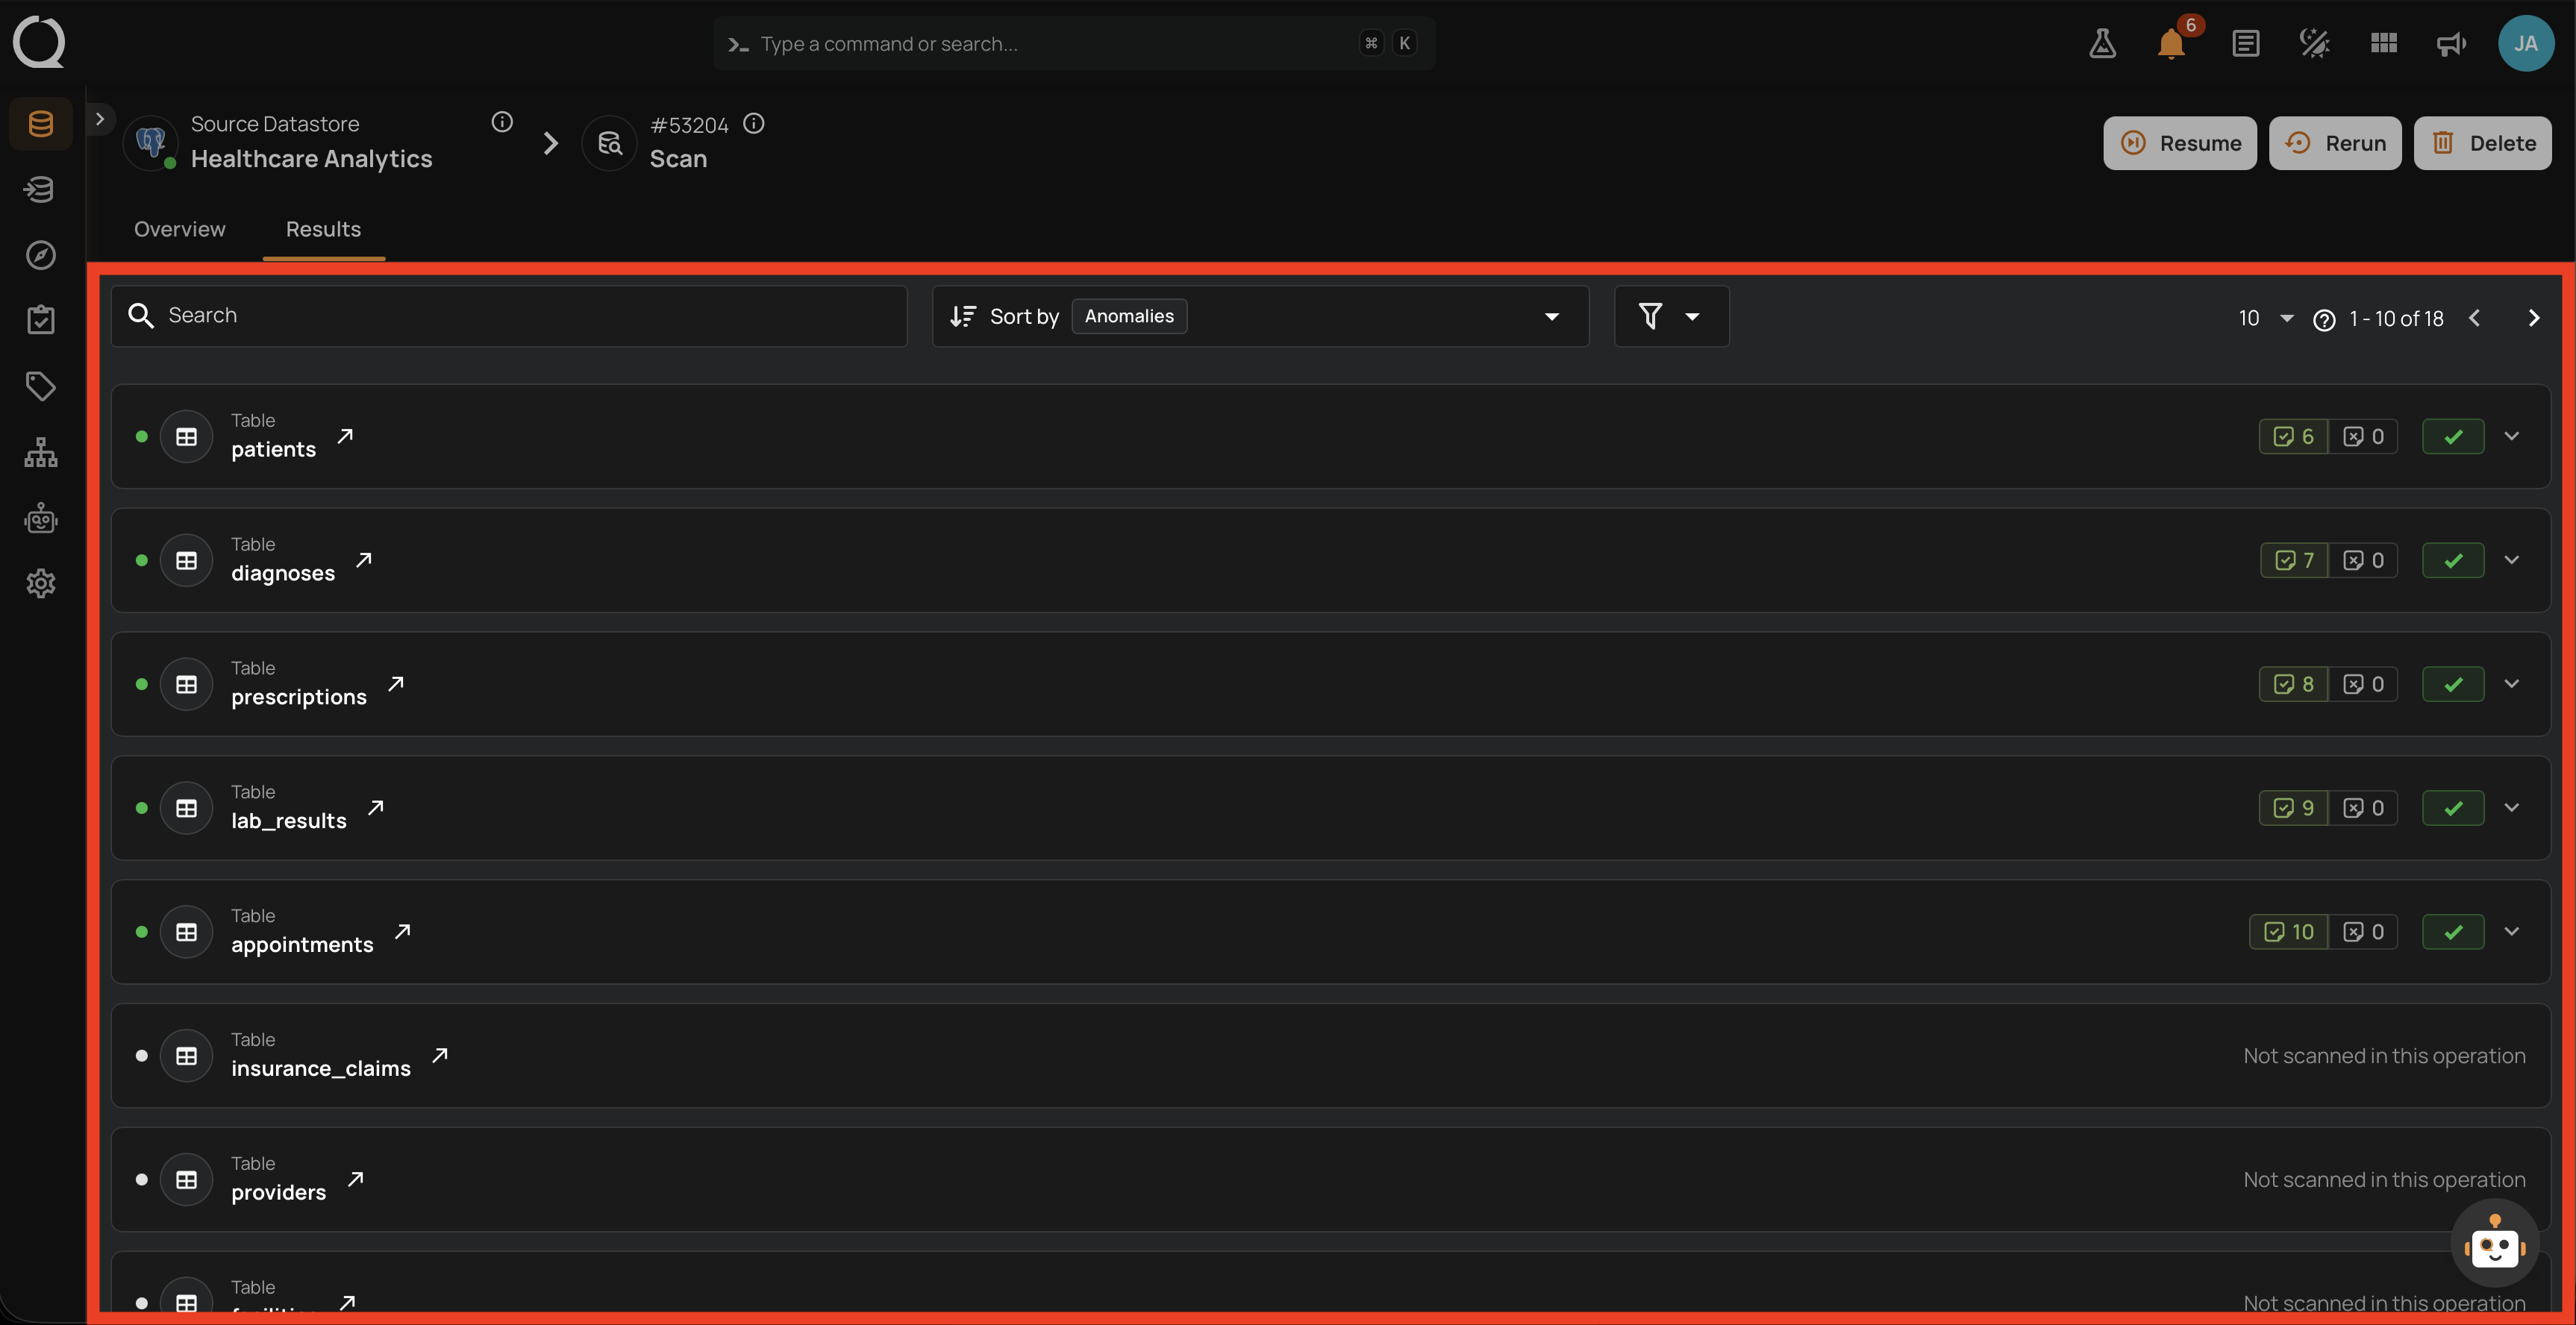
Results tab
The Results tab lists only the containers that completed before the abort. Each row links to the container's detail page.
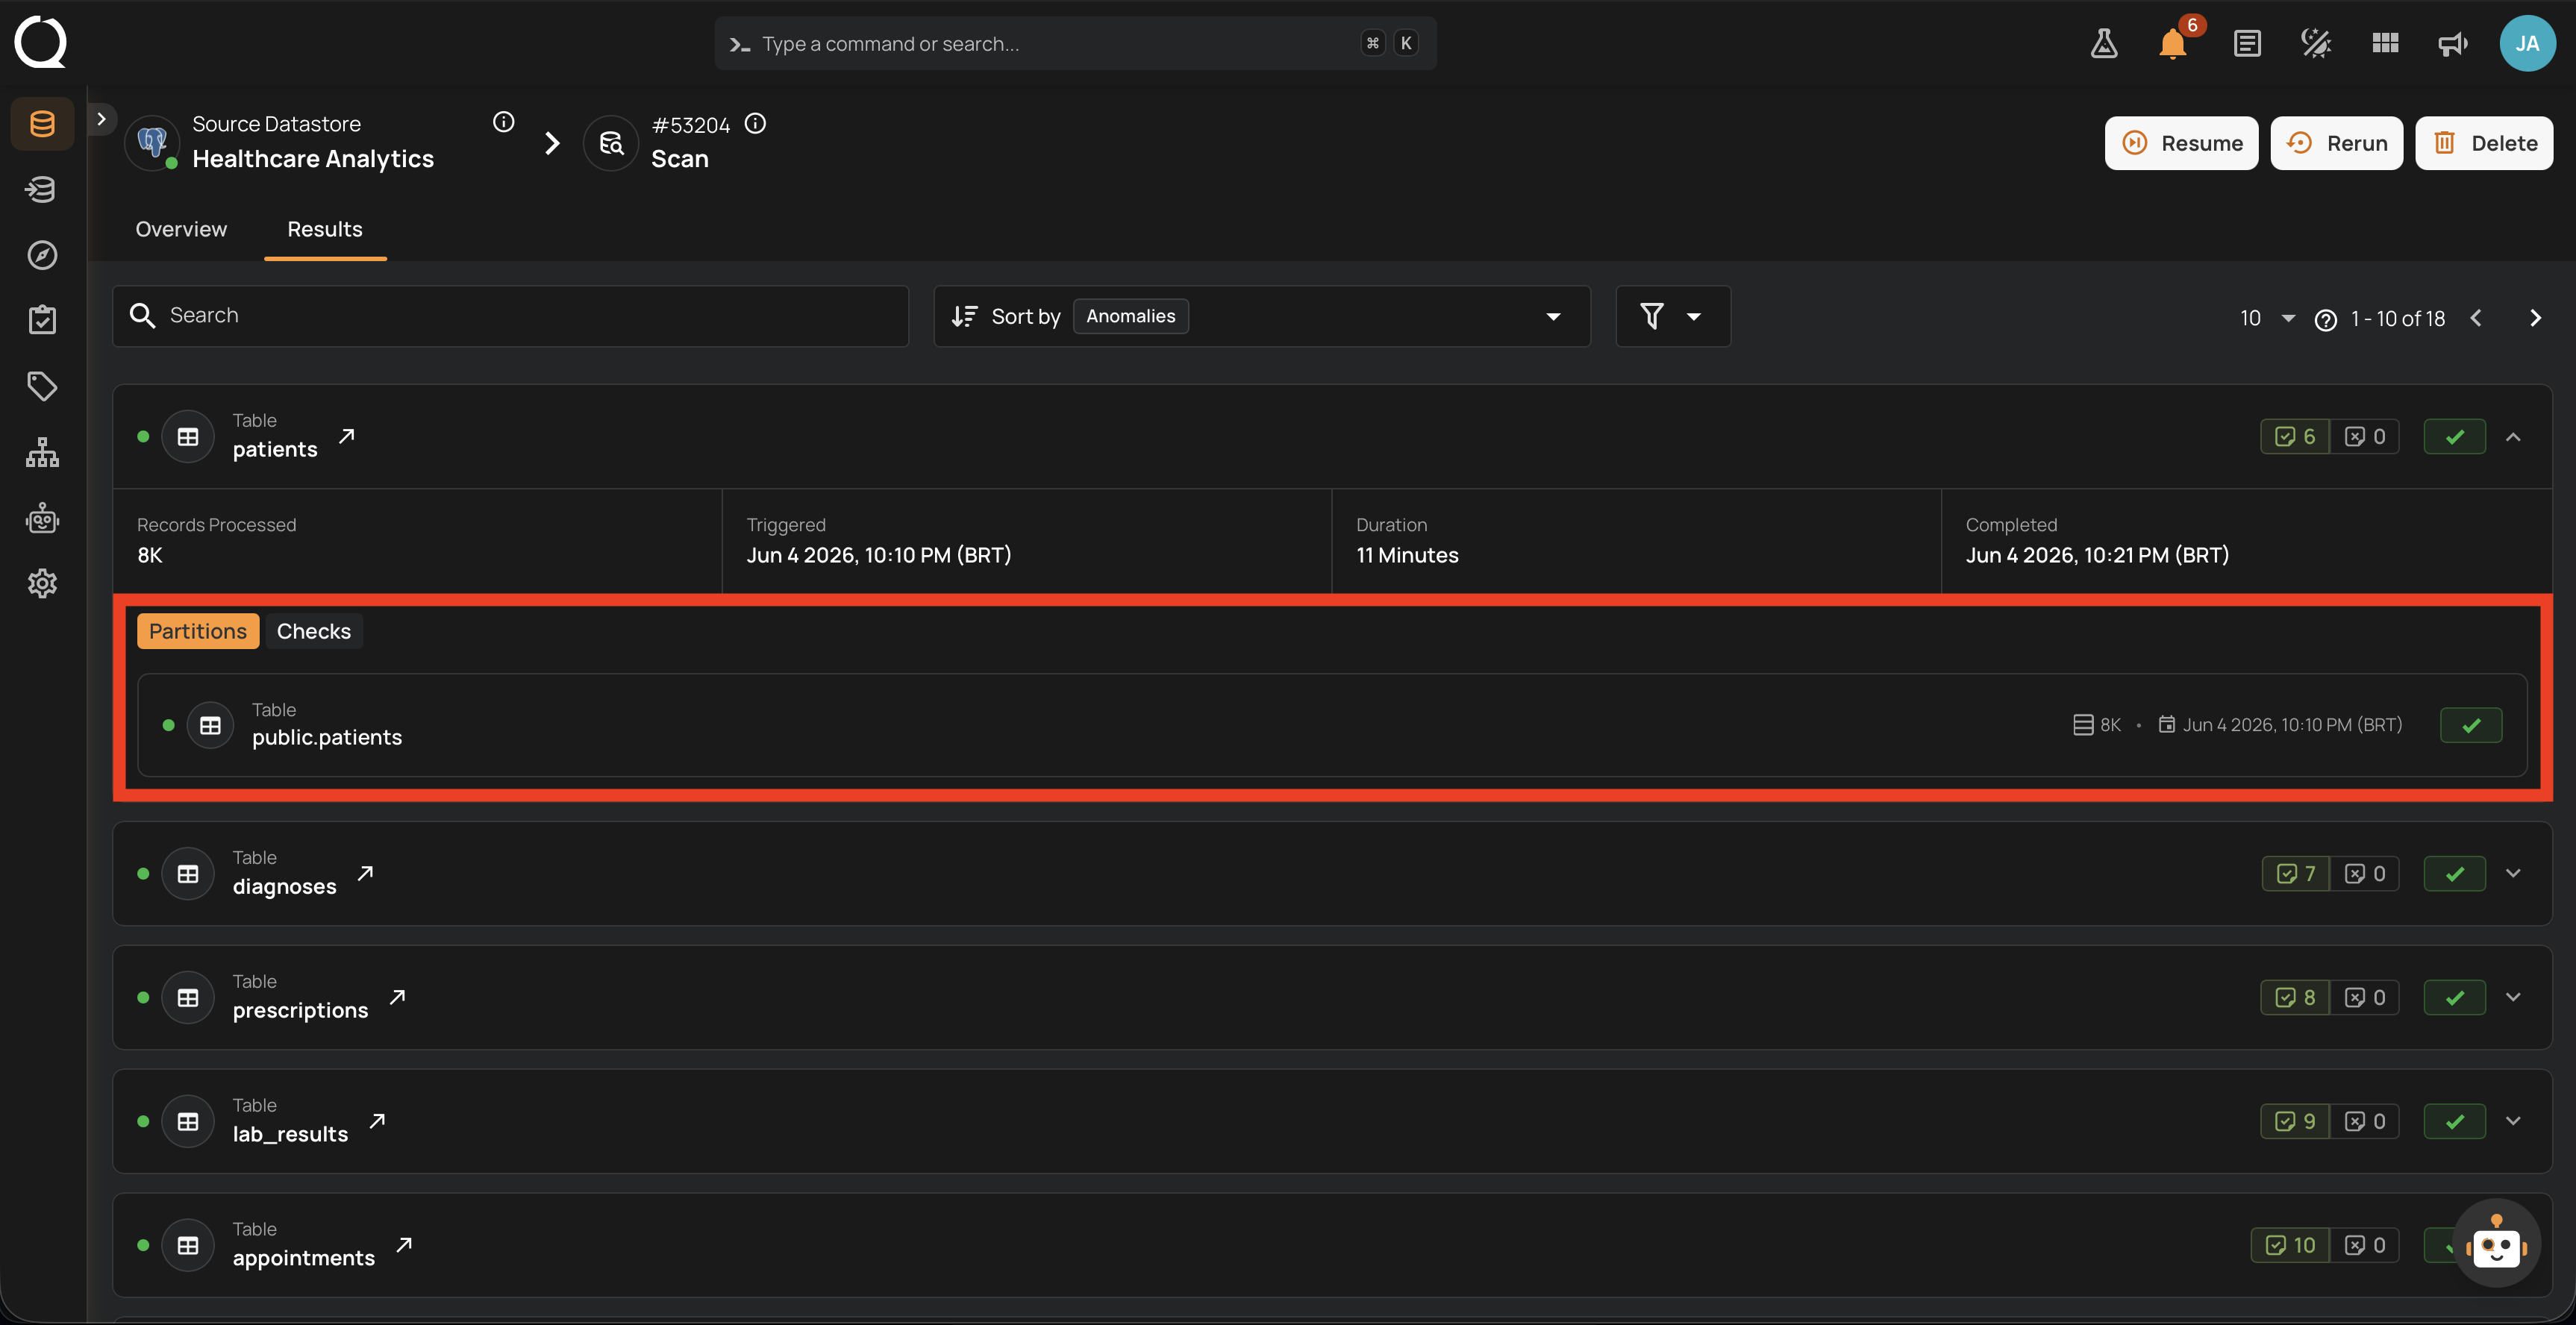
Container sub-tabs
Expanding a container row reveals two sub-tabs that drill into the per-container results captured before the abort. A Source Records sub-tab is not exposed for Aborted operations.
Partitions
Lists every partition read for this container before the abort, with size, read timestamp, completion time, and per-partition counters (records processed, anomalies emitted). Use this view to confirm exactly how much of each container was actually read prior to the abort.
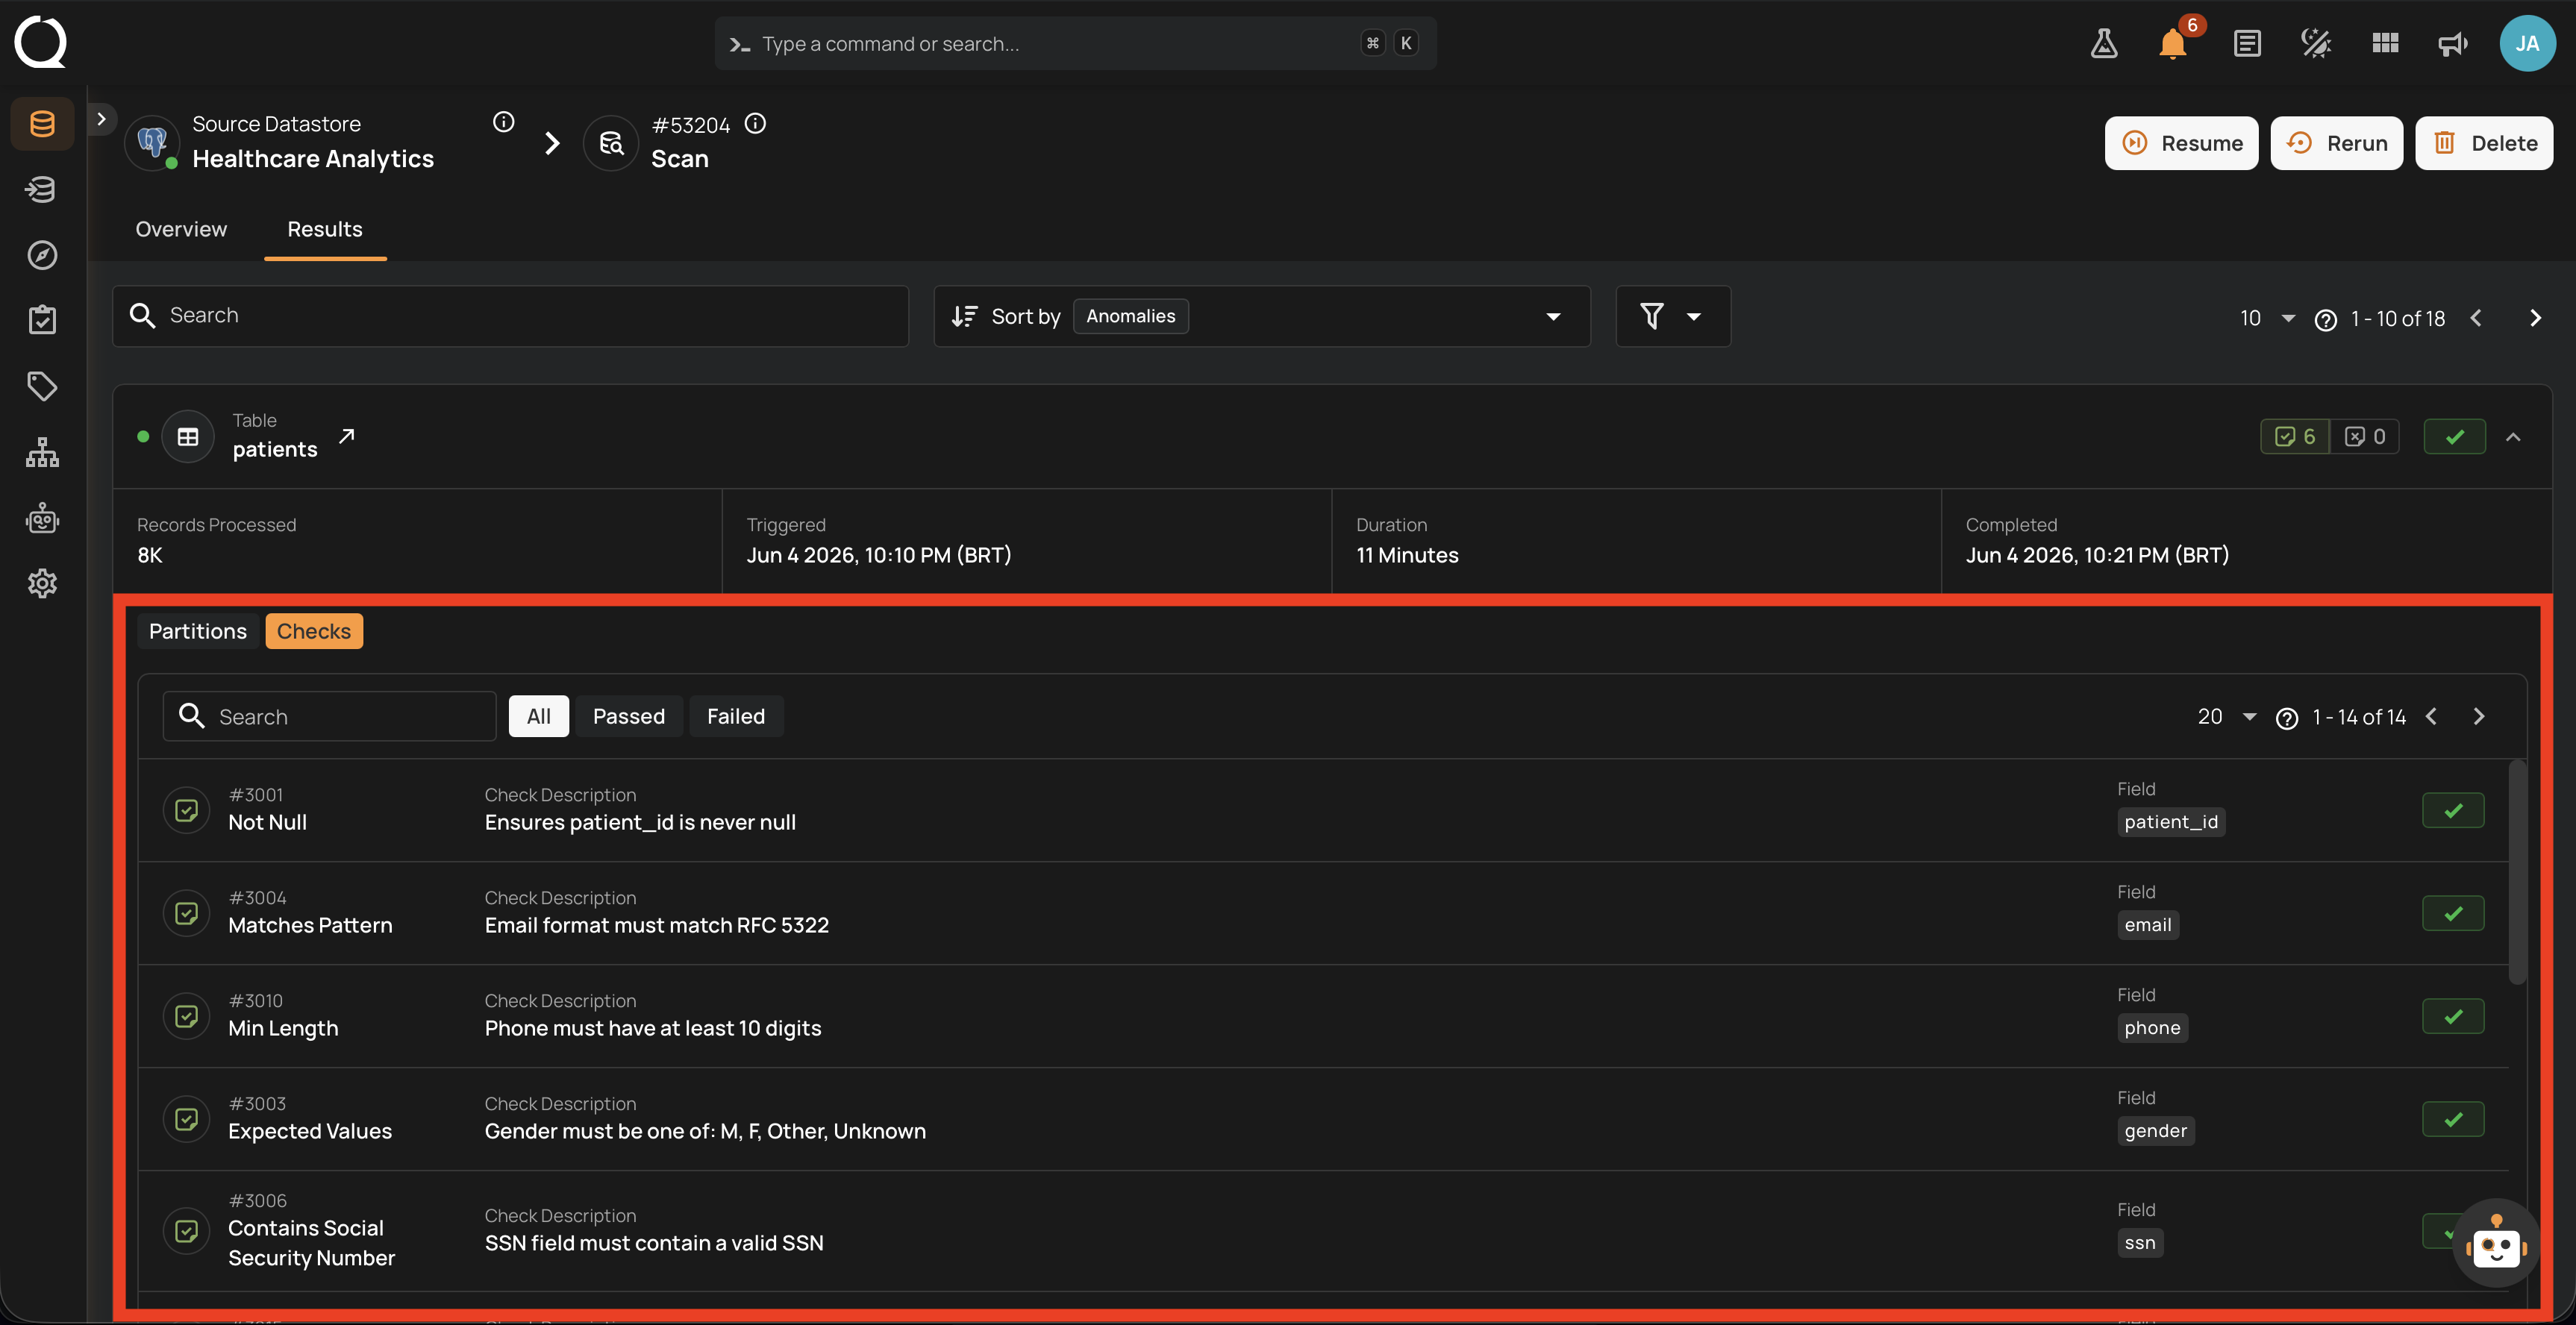
Checks
Lists every check that was asserted against this container, with check ID, name, description, target field, and pass/fail status. Filters at the top (All / Passed / Failed) let you focus on the checks that did not pass. For Aborted scans, this view reflects only the checks completed against the partitions read before the abort.
See also
-
Success
The Run finished cleanly with full results.
-
Success with Warning
The Run finished cleanly but the worker recorded log entries during execution.
-
Failure
The Run stopped because of an unrecoverable error.
-
Running
A worker is actively processing the Run; counters update live.
-
Queued
The Run is registered but no worker has picked it up yet.
-
Lifecycle
State diagram, transitions, and per-operation-type lifecycle.
-
Available Actions
Abort, Resume, Rerun, and Delete: when each one is shown.