Source Records
The Source Records page provides a detailed view of all records from your dataset that have failed data quality checks and been identified as anomalies. It serves as the primary interface for reviewing anomalous data at the row level, with visual highlights indicating the specific fields that triggered the anomalies. All displayed records are sourced from the linked Enrichment Datastore, which stores the results of data quality scans along with relevant metadata.
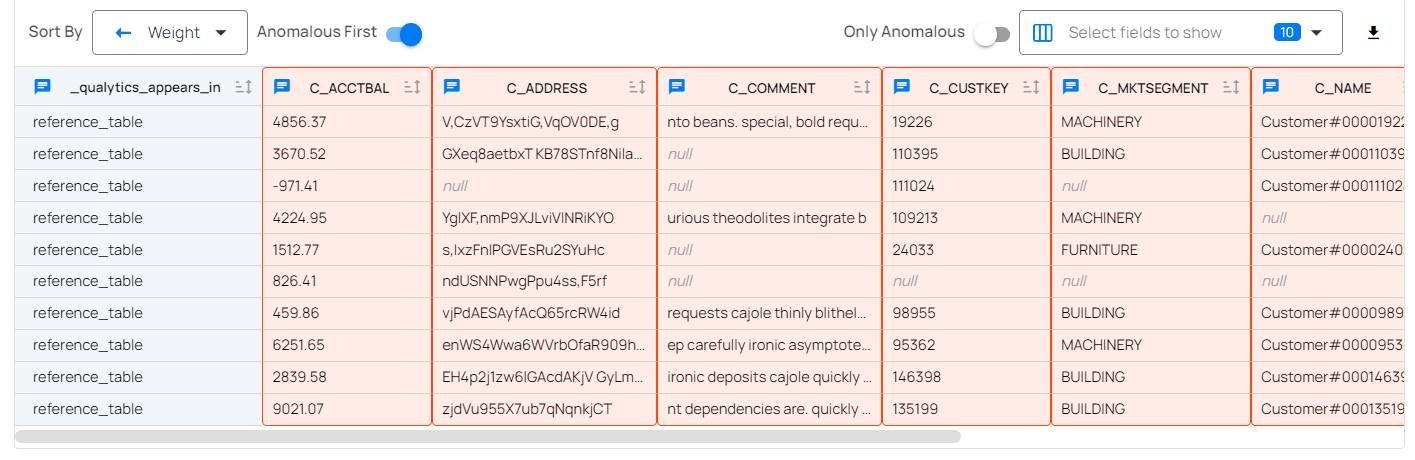
If the Anomaly Type is Shape, you will find the highlighted column(s) having anomalies in the source record.
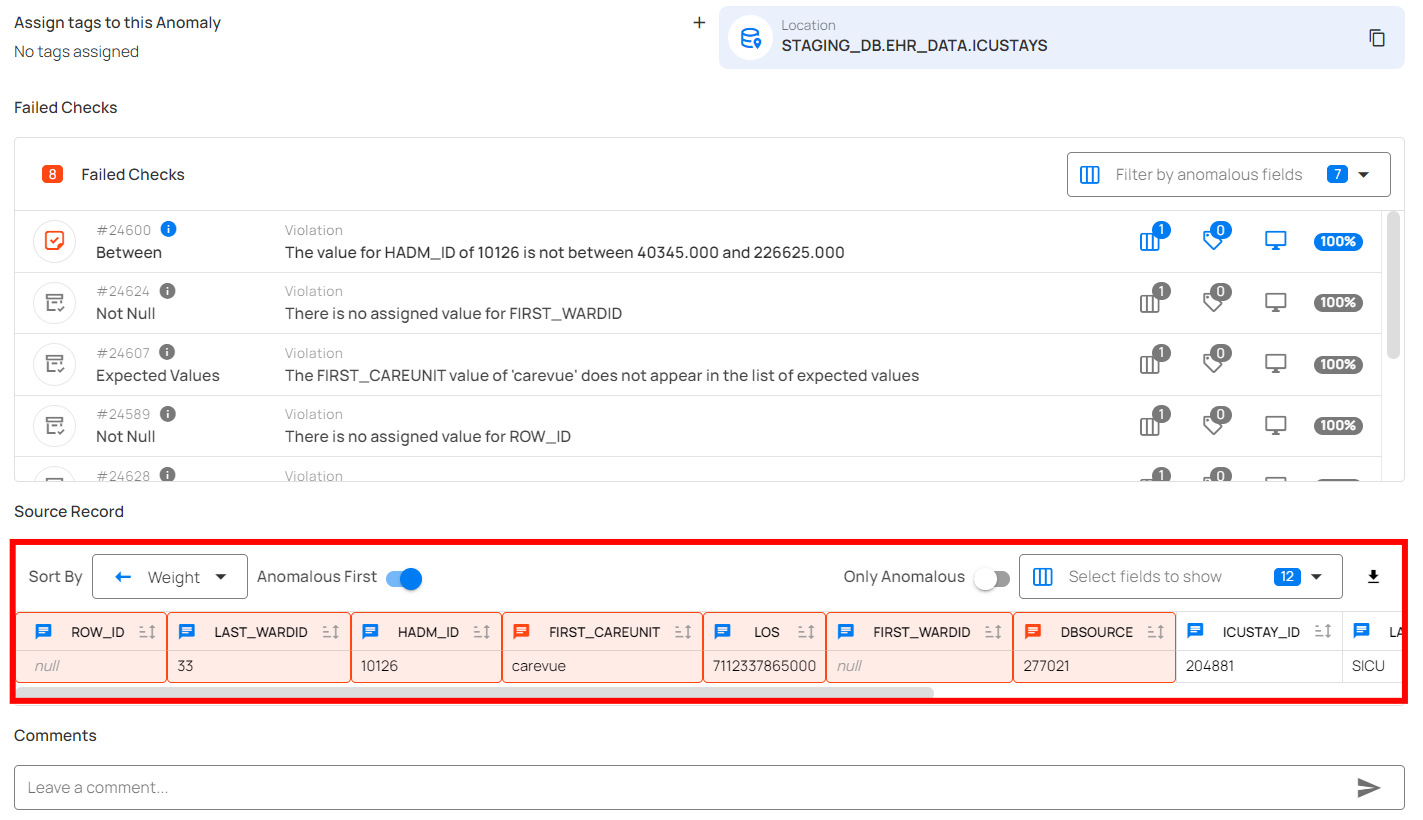
If the Anomaly Type is Record, you will find the highlighted row(s) in the source record indicating failed checks.
Note
In anomaly detection, source records are displayed as part of the Anomaly Details. For a Record anomaly, the specific record is highlighted. For a Shape anomaly, 10 samples from the underlying anomalous records are highlighted.
Source Record Visualization
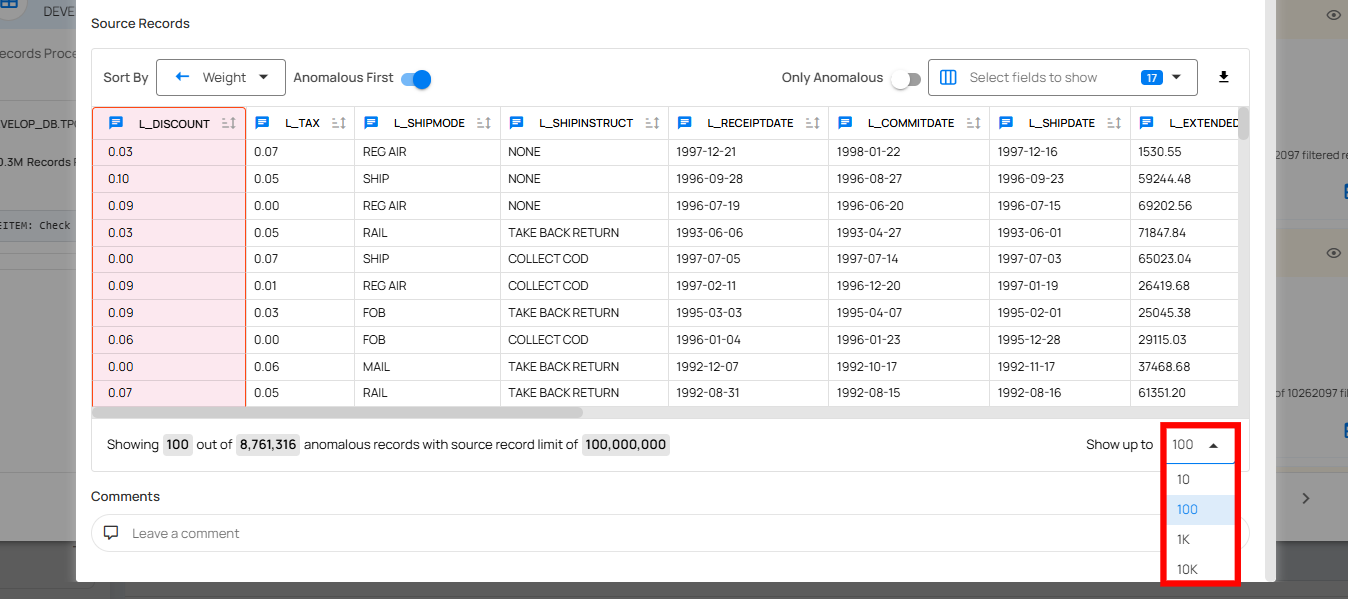
Users can view source records with selectable display limits of 10, 100, 1,000, or 10,000 records for comprehensive dataset analysis. The interface includes sticky headers that remain visible when scrolling through large datasets, making navigation easier during data review.
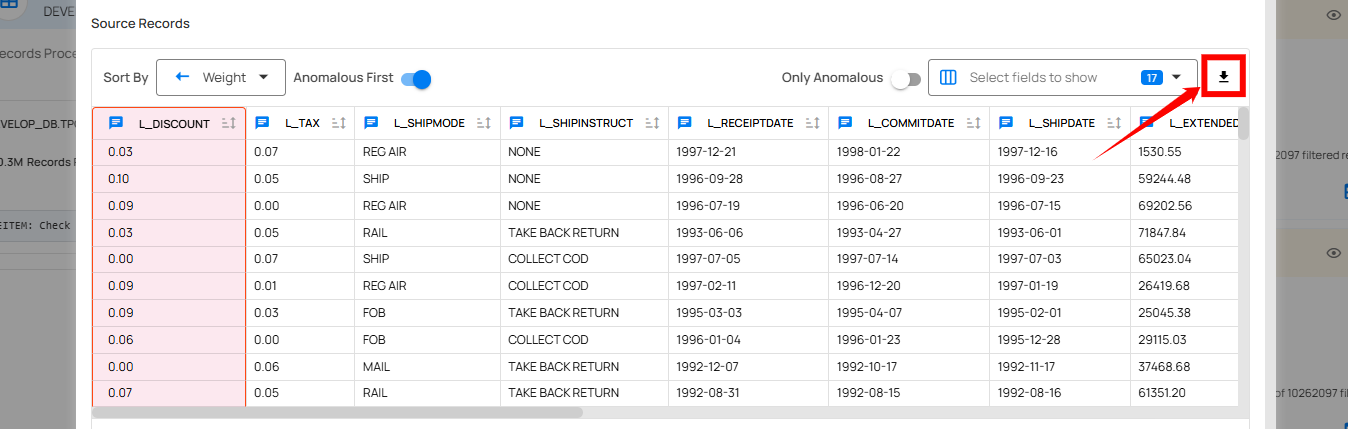
Download Source Record
User can download the source records that were captured for an anomaly during the scan run. The download always includes only the records that were selected to be stored in the scan settings at the time the scan was configured.
For example, if the user selected 100 as the maximum number of source records per anomaly, then 100 anomalous records will be shown on the Source Records page and the same 100 records will be available for download. If the user selected 10, only those 10 records will be displayed and downloadable. If the user needs to download more source records, the limit must be increased in the scan settings and the scan must be re-run, as records that were not captured during the scan cannot be downloaded later.
Masked Fields in Source Records
If a container contains masked fields, their values are obfuscated by default in source records.
Users with Editor permission can reveal masked values for an anomaly using the reveal toggle. Toggling reveal shows all source records attached to that anomaly at once — reveal is per-anomaly, not per-record. Every reveal action is recorded in the masking audit log with the user identity, timestamp, IP address, and the specific fields accessed — this log is reviewable by Administrators.
Info
To protect sensitive data consistently, masking also applies to anomaly assertion context (the values embedded in check detail descriptions). That surface does not support inline reveal — use the source record reveal toggle to investigate specific values.
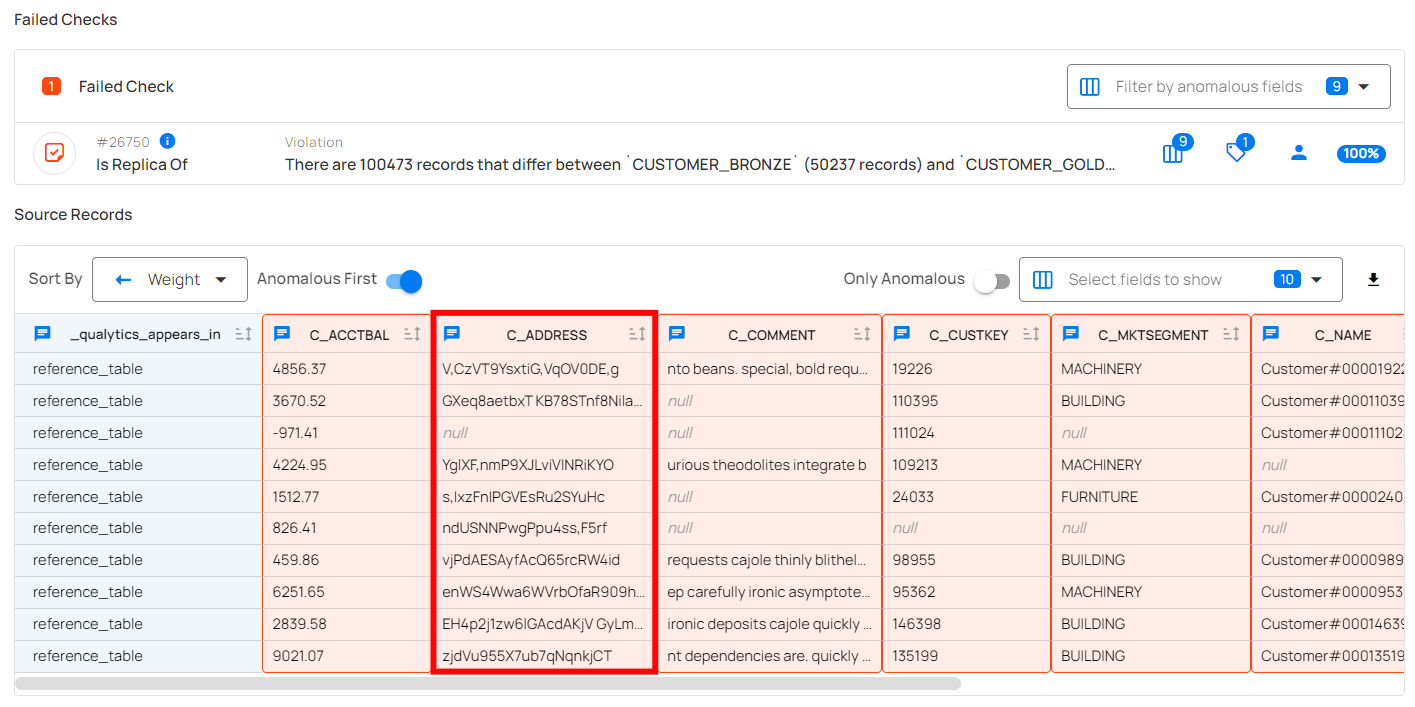
Comparison Source Records
Anomalies identified by the Data Diff rule type, configured with Row Identifiers, are displayed with a detailed source record comparison. This visualization highlights differences between rows, making it easier to identify specific discrepancies.