Quick Start Guide
Welcome to Qualytics! This guide will help you quickly get up and running with the platform, from initial setup through your first data quality operations. Whether you're a business user or technical administrator, you'll find everything needed to start managing data quality at scale.
Let's get started 🚀
Deployment Access
Each Qualytics deployment is a single-tenant, dedicated cloud instance, configured to your organization's requirements. Your deployment will be accessible via a custom URL (e.g., https://acme.qualytics.io), with corresponding API documentation at /api/docs.
Onboarding Process
The Qualytics onboarding process ensures your environment is perfectly tailored to your needs:
1. Screening and Criteria Gathering
Our team works with you to understand your specific needs, including:
- Evaluating sample data requirements.
- Identifying primary success criteria.
- Exploring relevant use cases for your environment.
- Determining deployment specifications.
2. Environment Setup
Based on your requirements, we:
- Create your custom deployment URL.
- Configure your preferred cloud provider and region.
- Set up initial security parameters.
- Establish integration endpoints.
3. User Access
Once deployment is complete:
- Team members receive email invitations.
- Roles are assigned based on your specifications.
- Access credentials are securely distributed.
Tip
Please check your spam folder if you don't see the invite.
See our onboarding page for a more detailed view of what to expect during onboarding!
Signing In
Qualytics supports two authentication methods:
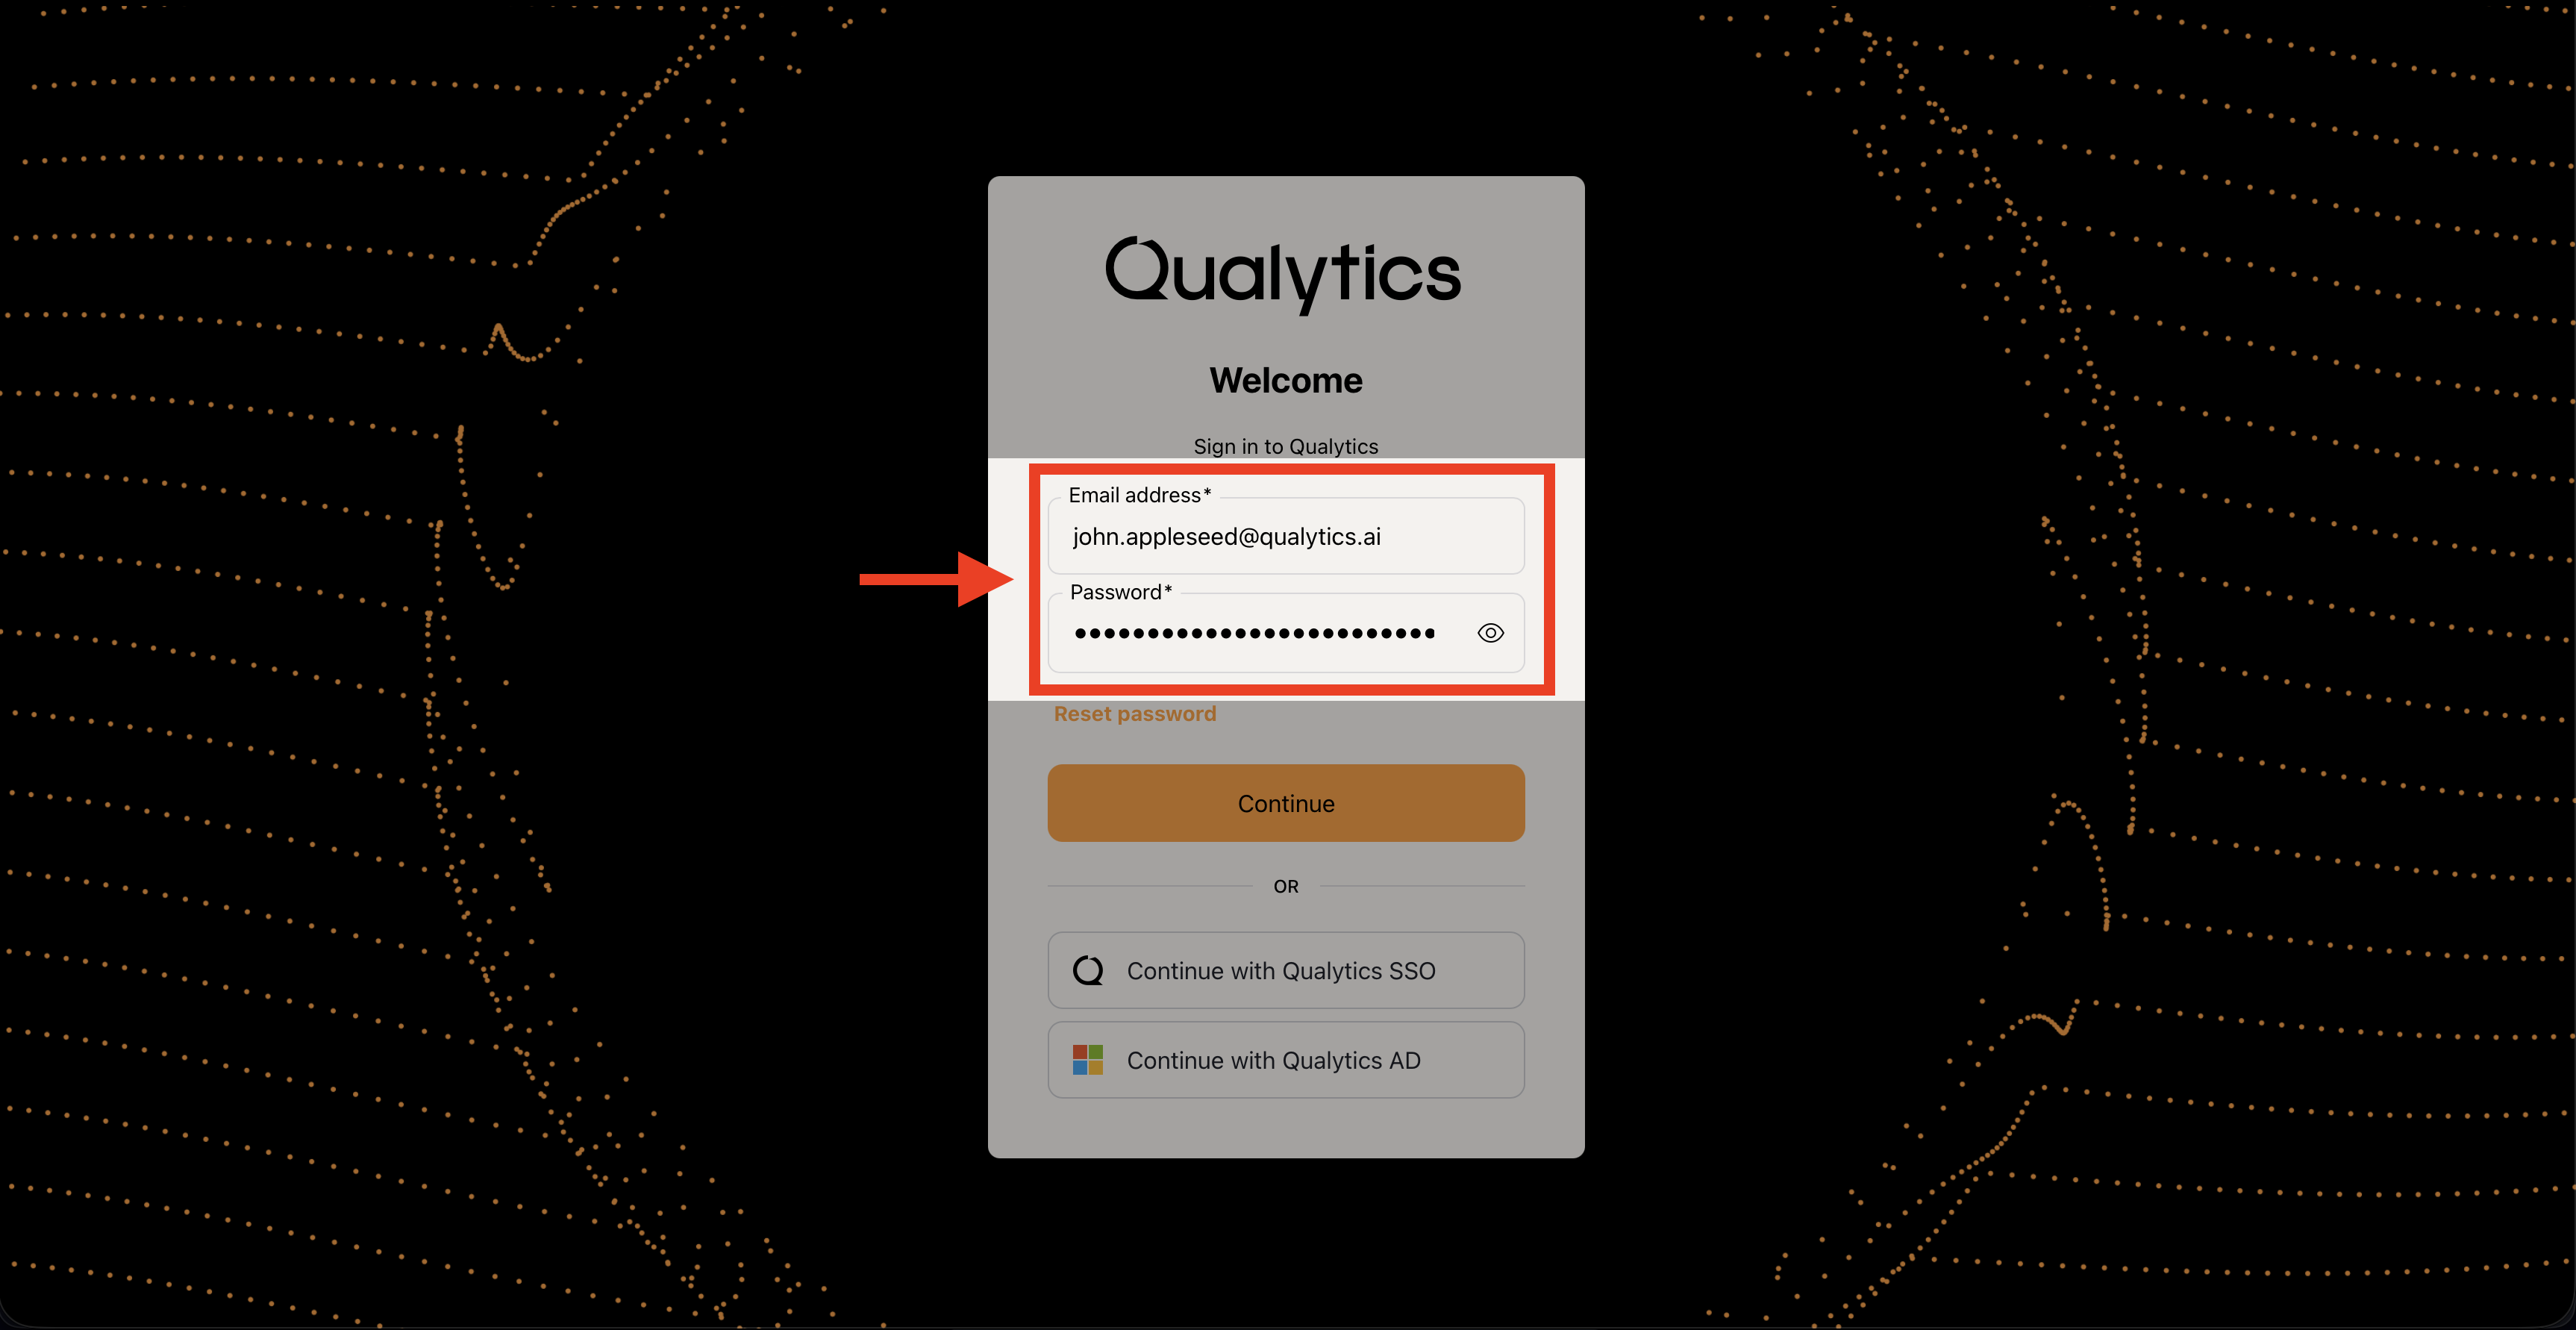
Method 1: Direct Credentials
Ideal for:
- Initial platform evaluation.
- Proof of Concept (POC) phases.
- Environments without SSO integration.
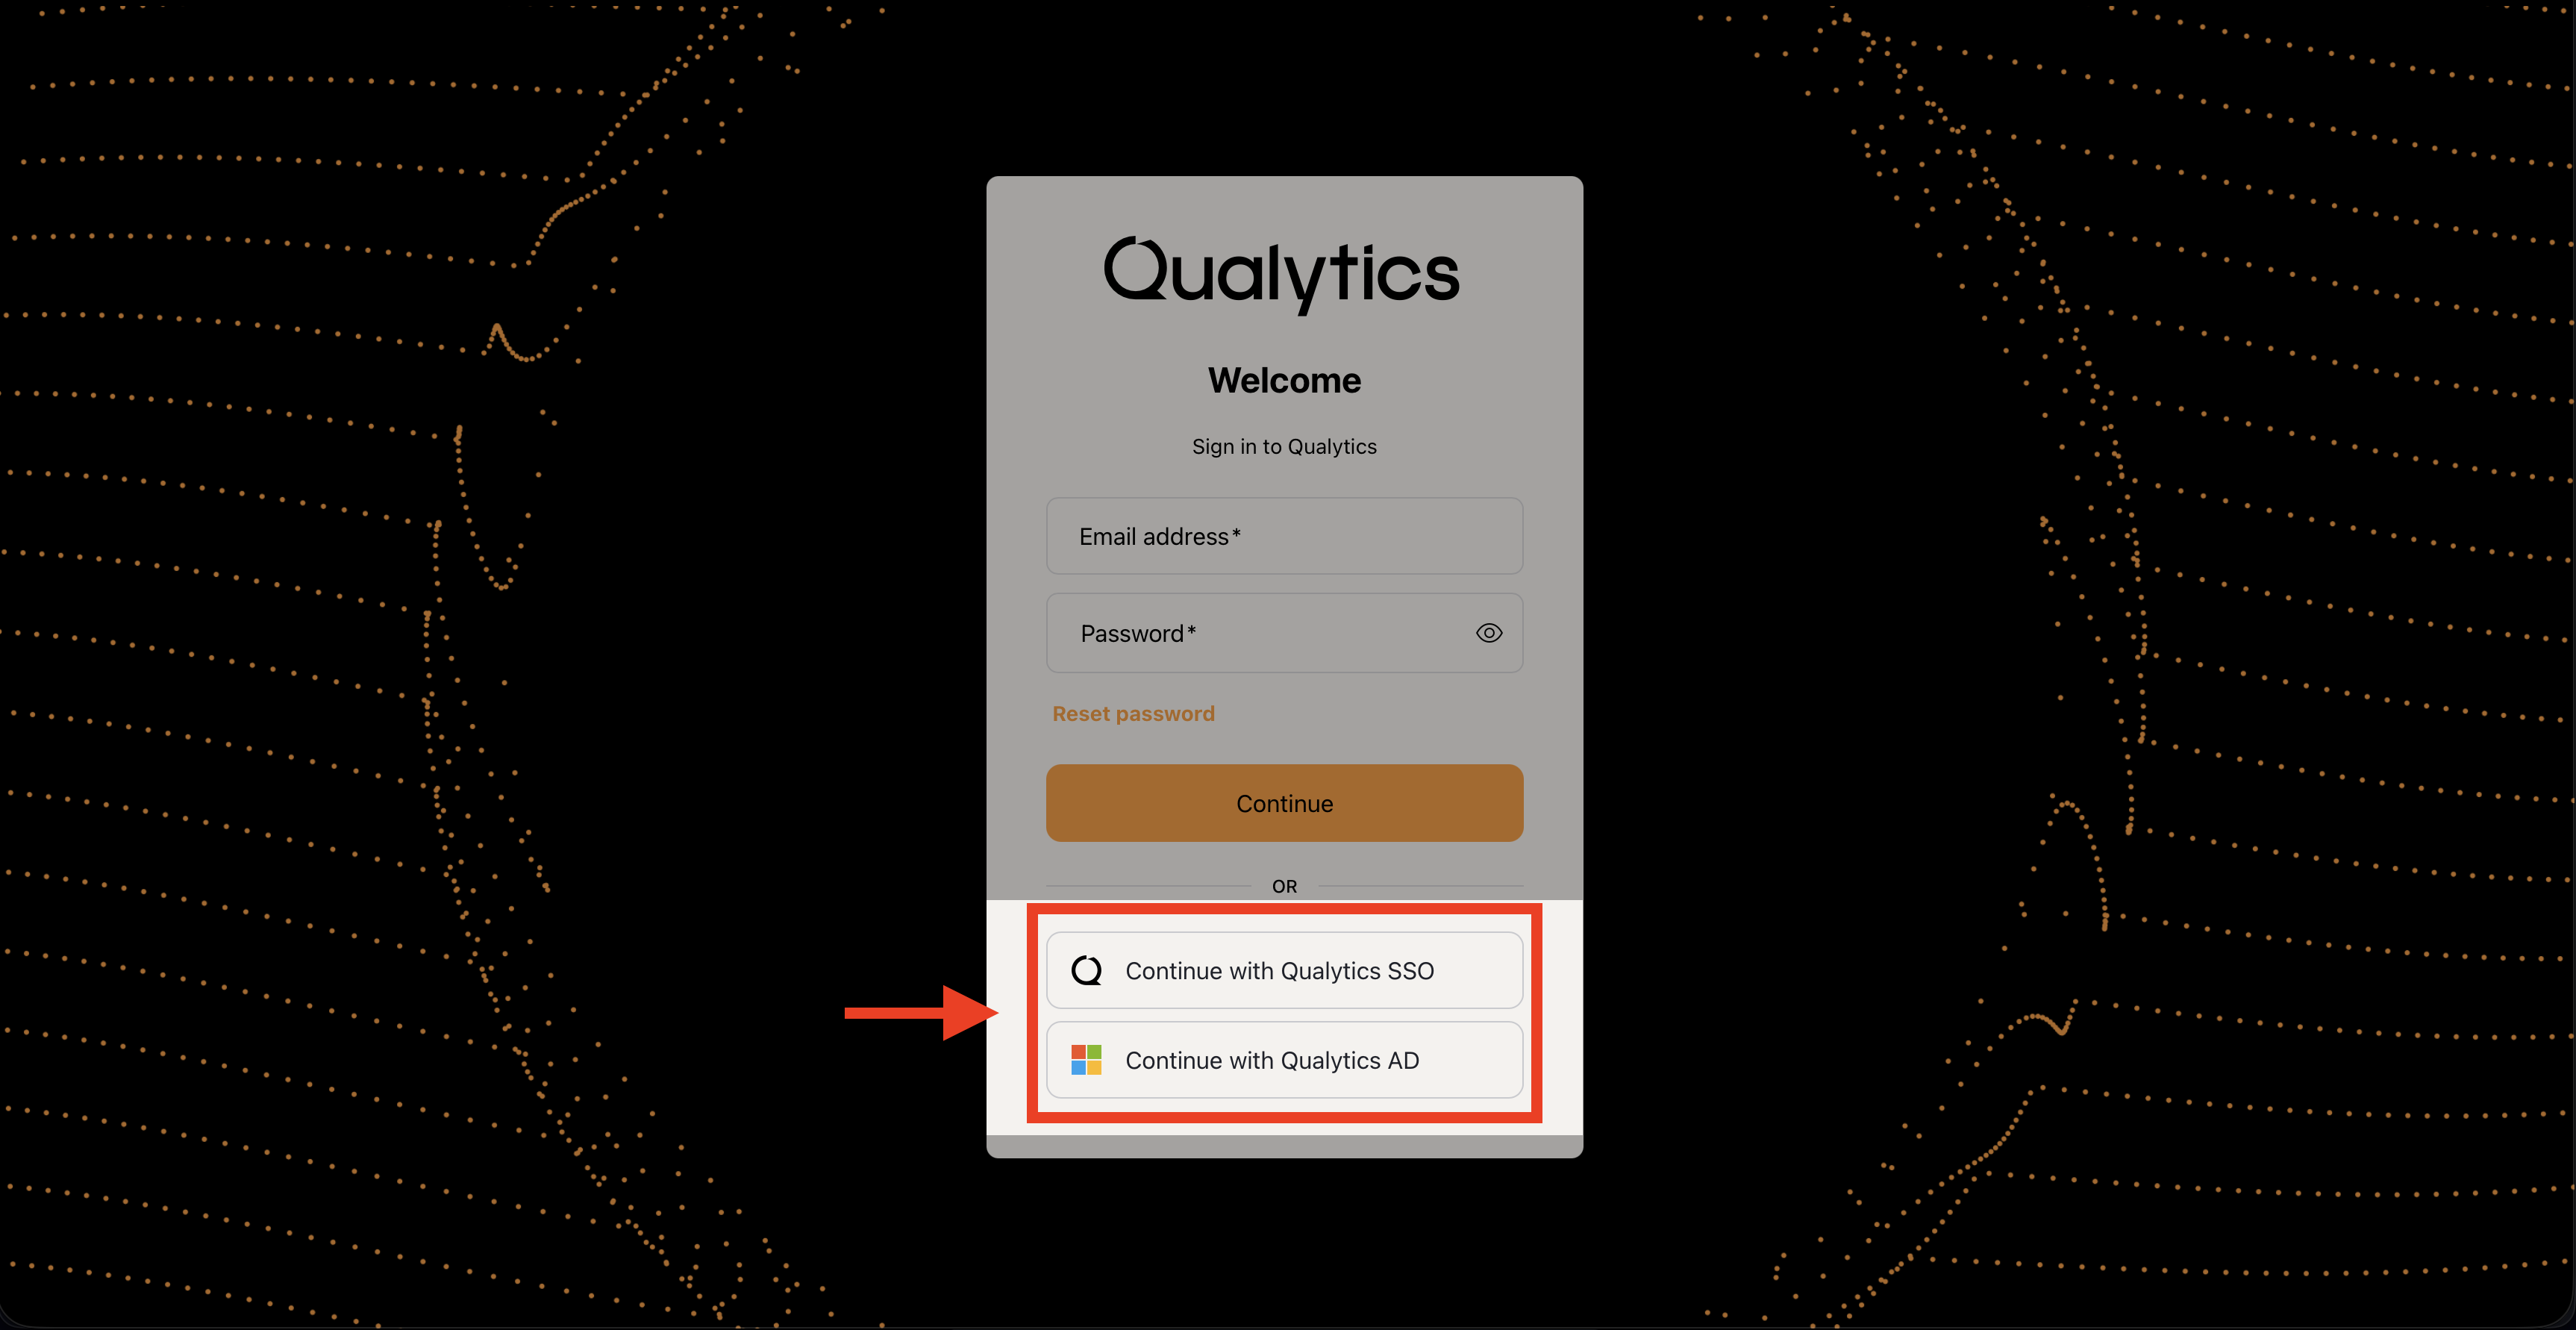
Method 2: Enterprise SSO
For production deployments:
- Integrates with your organization's Identity Provider.
- Supports standard SSO protocols.
- Provides seamless access management.
Getting Started Checklist
To begin using Qualytics, you'll complete these key steps:
- Connect Your First Datastore.
- Run Initial Profile Operation.
- Review Generated Quality Checks.
- Configure Monitoring & Alerts.
Let's walk through each step in detail.
Understanding Datastores
In Qualytics, a Datastore represents your data source connection. Qualytics provides verified connectors for a wide range of data sources, including:
JDBC Datastores
- Traditional relational databases (RDBMS).
- Data warehouses.
- Analytical databases.
Distributed File System (DFS) Datastores
- Cloud storage (AWS S3, Azure Blob, GCP).
- Raw files (CSV, XLSX, JSON, Avro, Parquet).
- Local file systems.
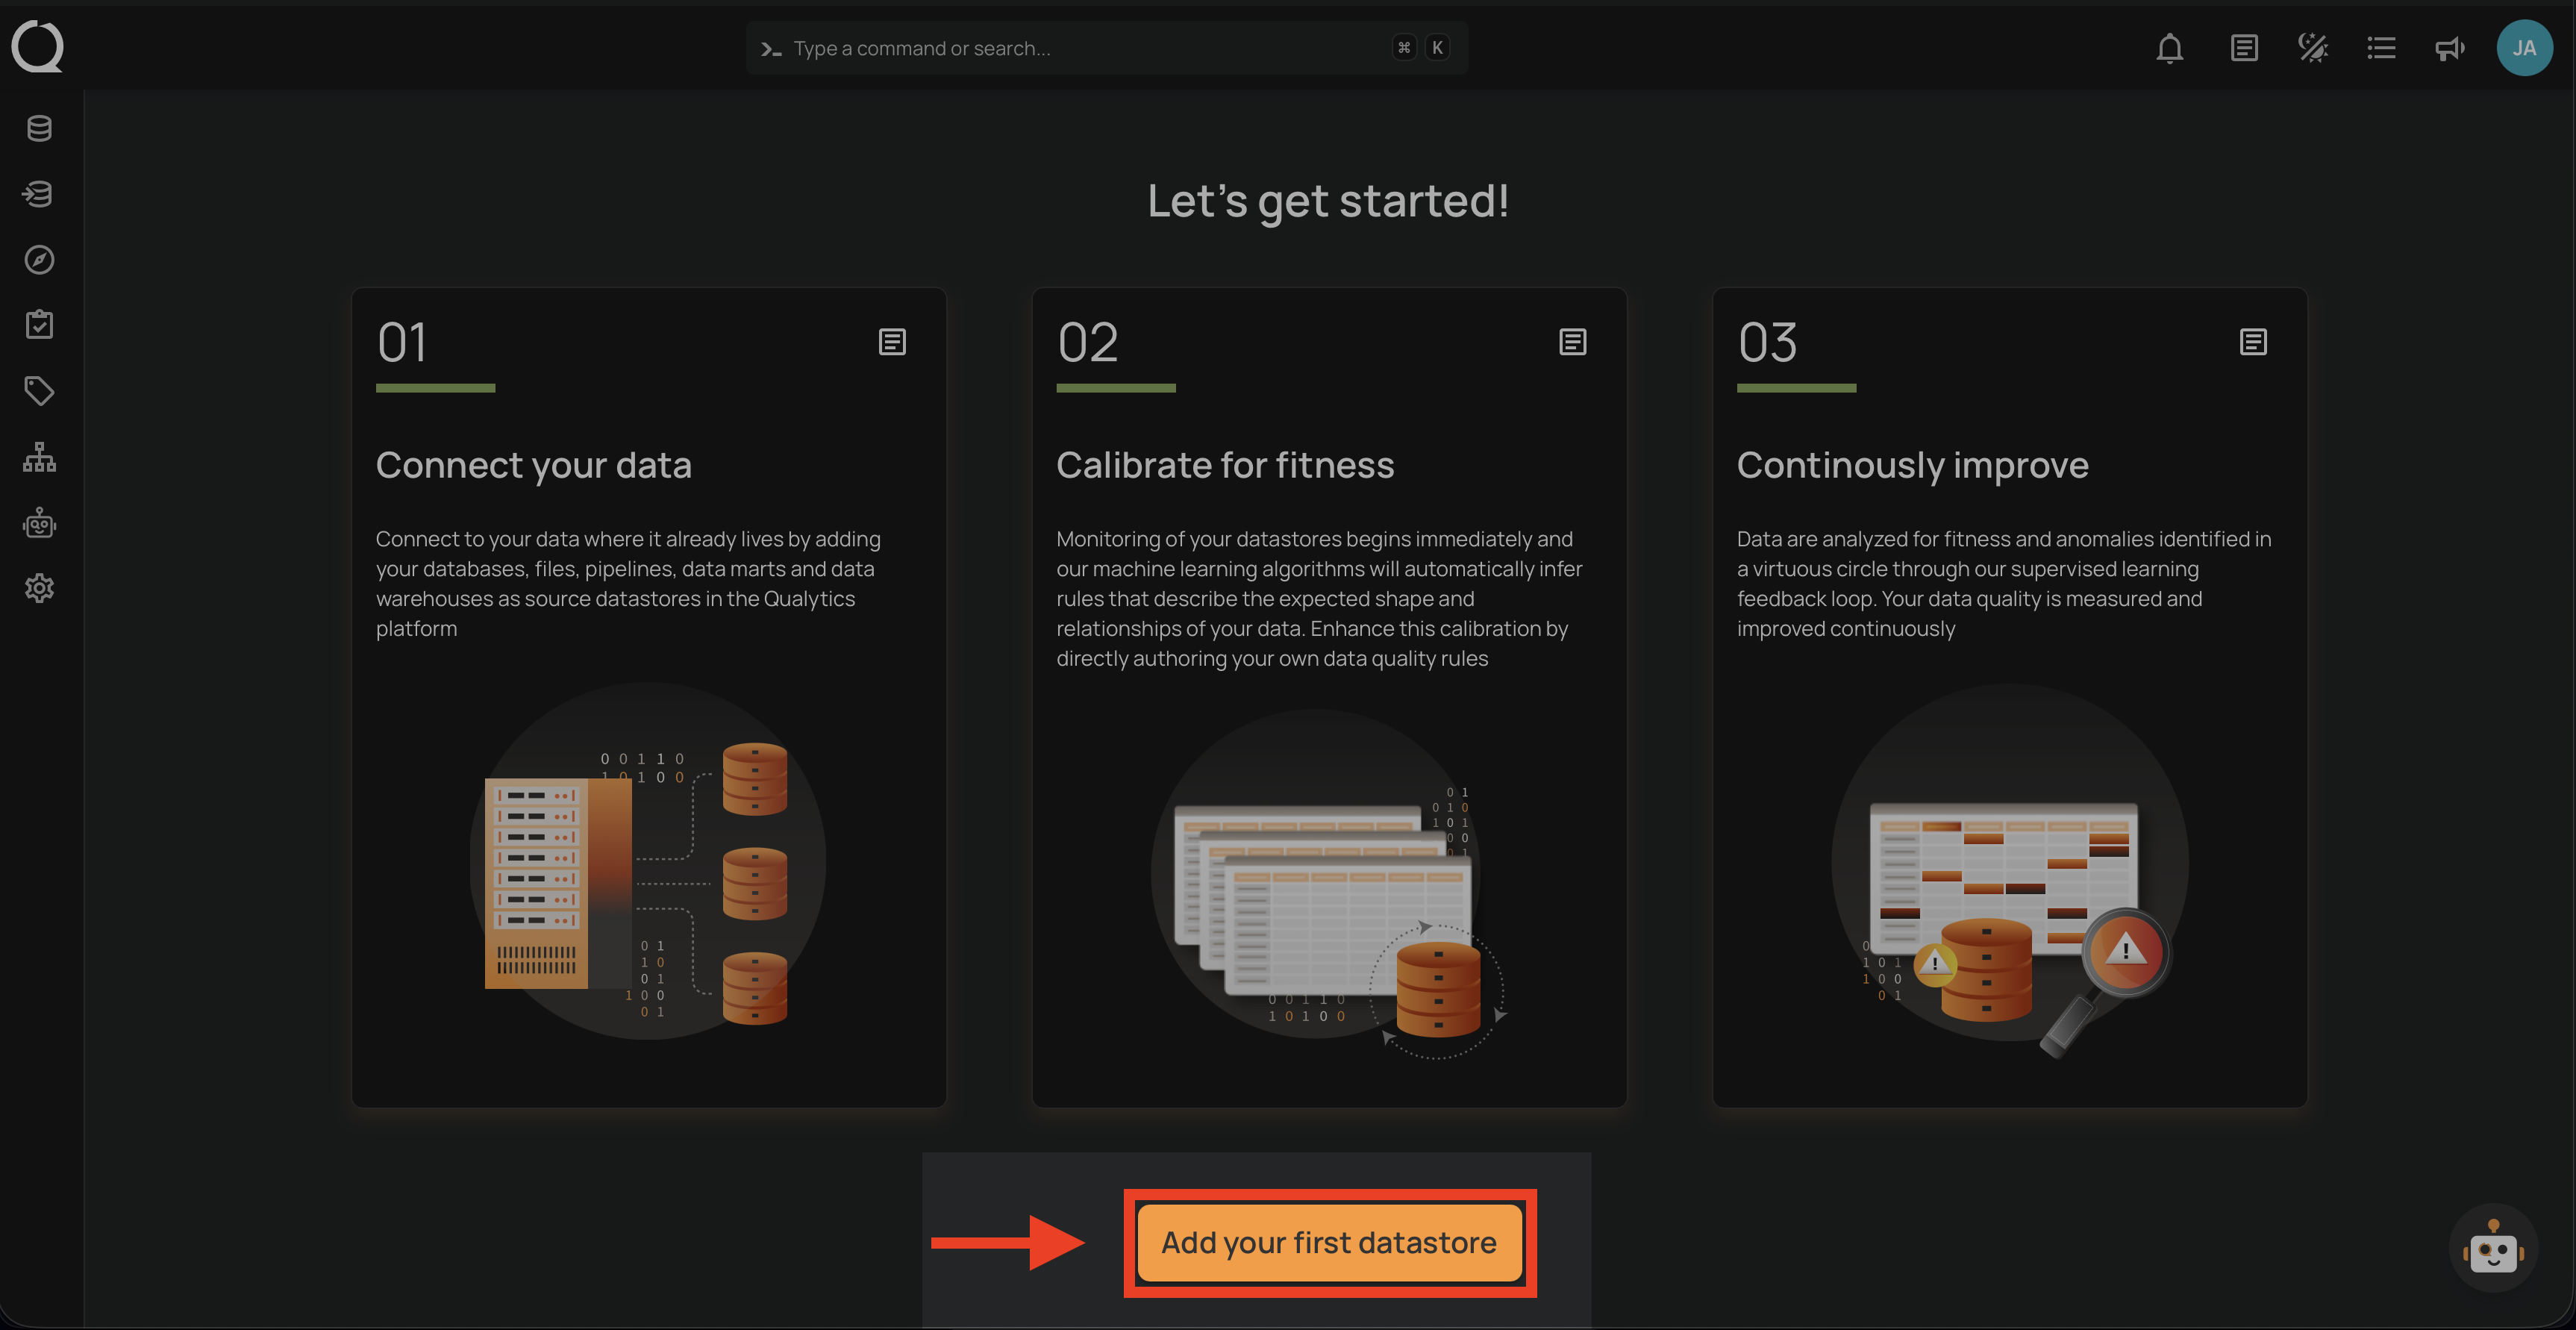
Connecting Your First Datastore
Adding a Source Datastore
- From the main menu, select "Add Source Datastore":
- Select your datastore type.
- Provide connection details.
- Test connectivity.
- Configure an Enrichment Datastore (strongly recommended).
Warning
While optional, not configuring an Enrichment Datastore limits platform capabilities.
Enrichment Datastores
An Enrichment Datastore serves as the storage location for:
- Anomaly detection results.
- Metadata and profiling information.
- Quality check outcomes.
- Historical analysis data.
You can either:
- Configure a new Enrichment Datastore.
- Select an existing Enrichment Datastore from the dropdown.
Core Operations
After connecting your datastore, three fundamental operations manage data quality:
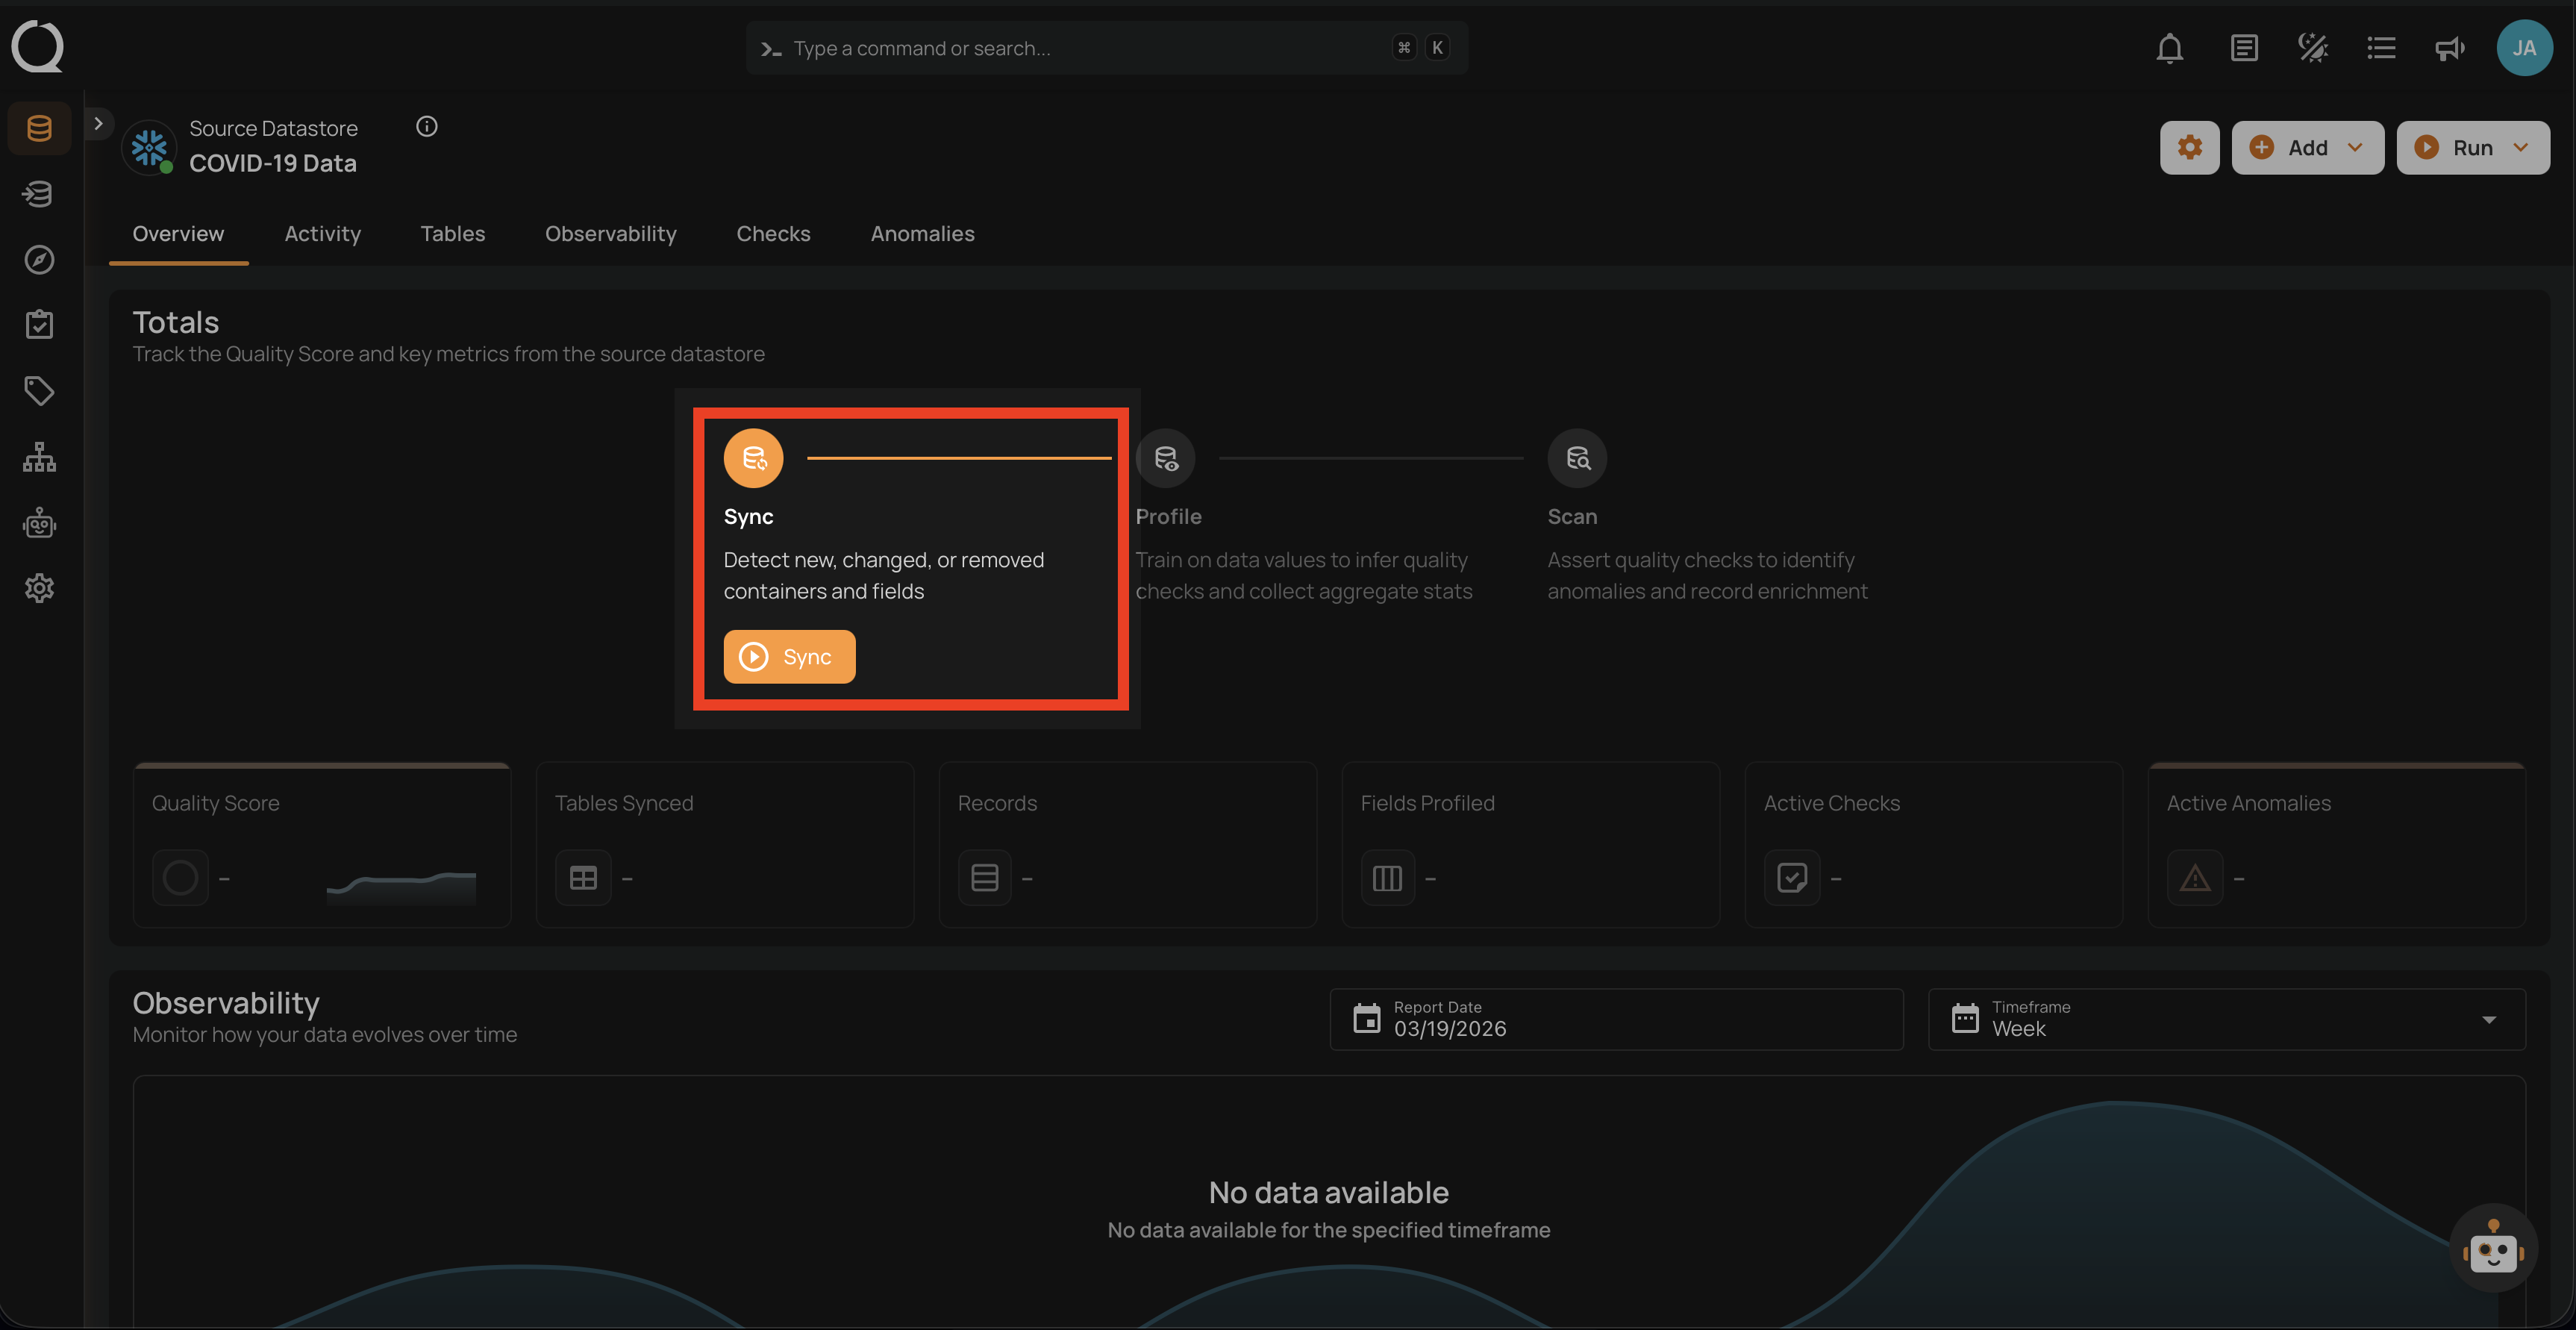
1. Sync Operation
The first step in understanding your data:
- Detects new, changed, or removed containers and fields.
- Works incrementally, only processing differences since the last sync.
- Prepares for profiling and scanning.
- Runs automatically on datastore creation.
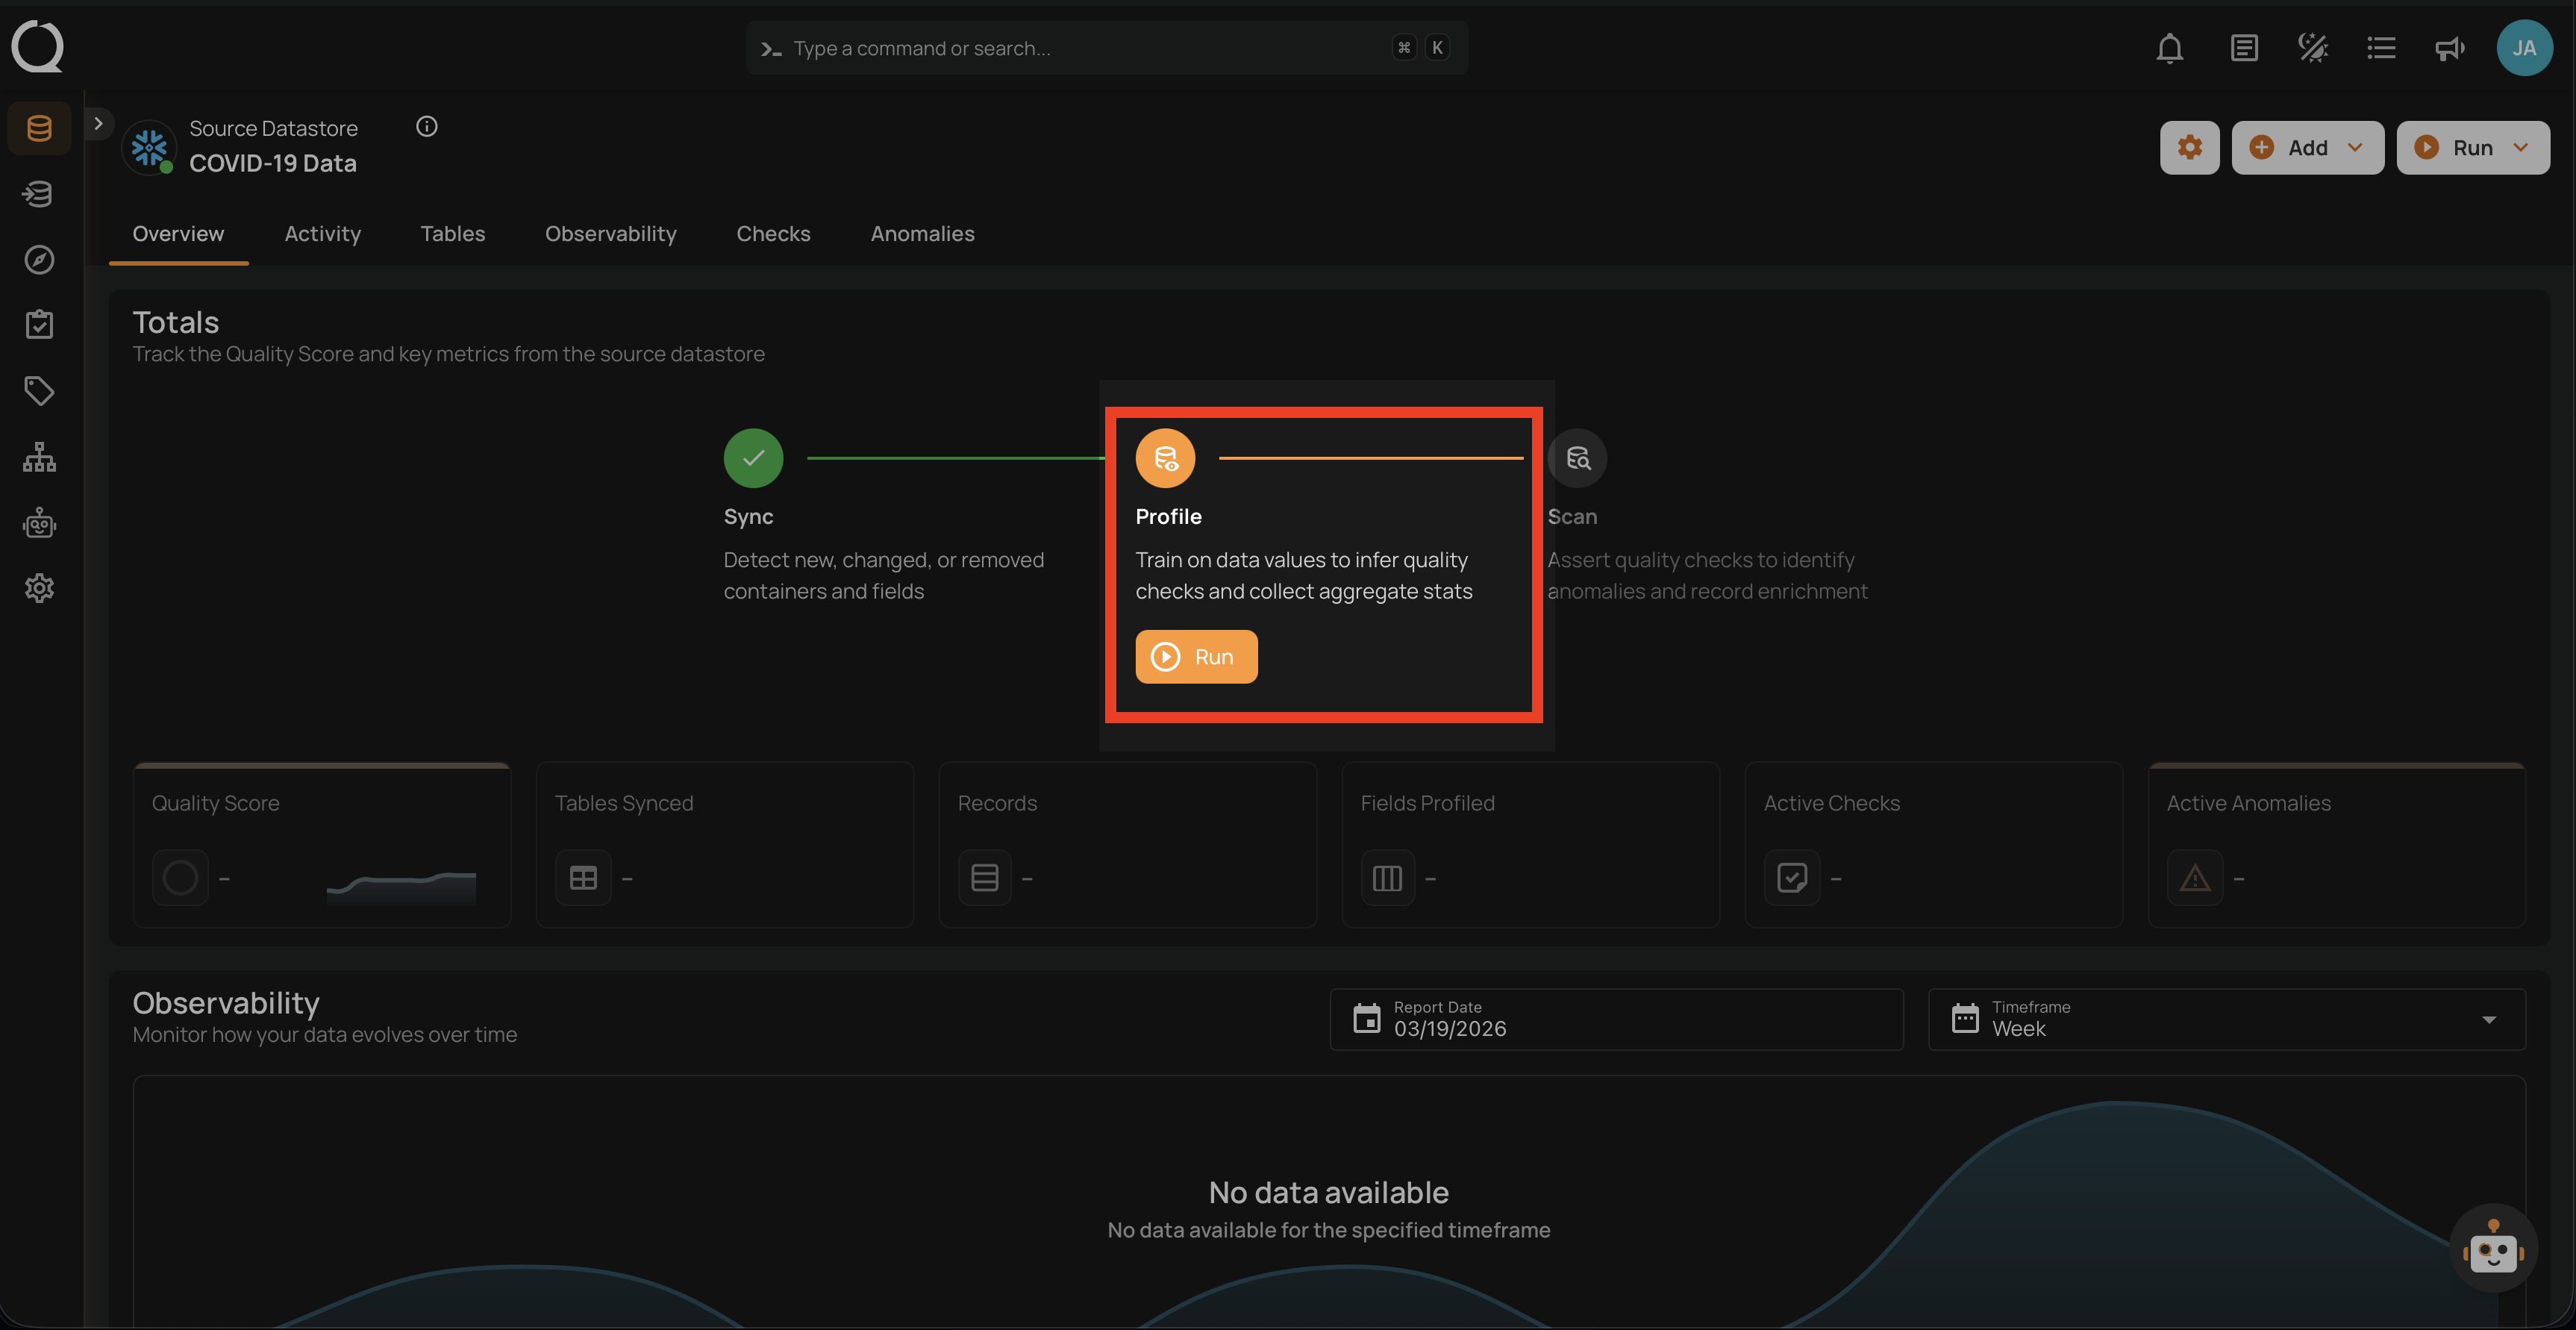
2. Profile Operation
The Profile operation performs deep analysis of your data:
- Generates comprehensive metadata.
- Calculates statistical measures:
- Basic metrics (type, min/max, and lengths).
- Advanced analytics (skewness, kurtosis, and correlations).
- Value distributions and patterns.
- Automatically infers data quality rules.
- Uses machine learning for pattern detection.
Our profiling engine analyzes:
- Field types and patterns.
- Value distributions.
- Statistical relationships.
- Data quality patterns.
- Structural consistency.
The engine uses machine learning to:
- Identify column data types.
- Discover relationships.
- Generate quality rules.
- Detect anomaly patterns.
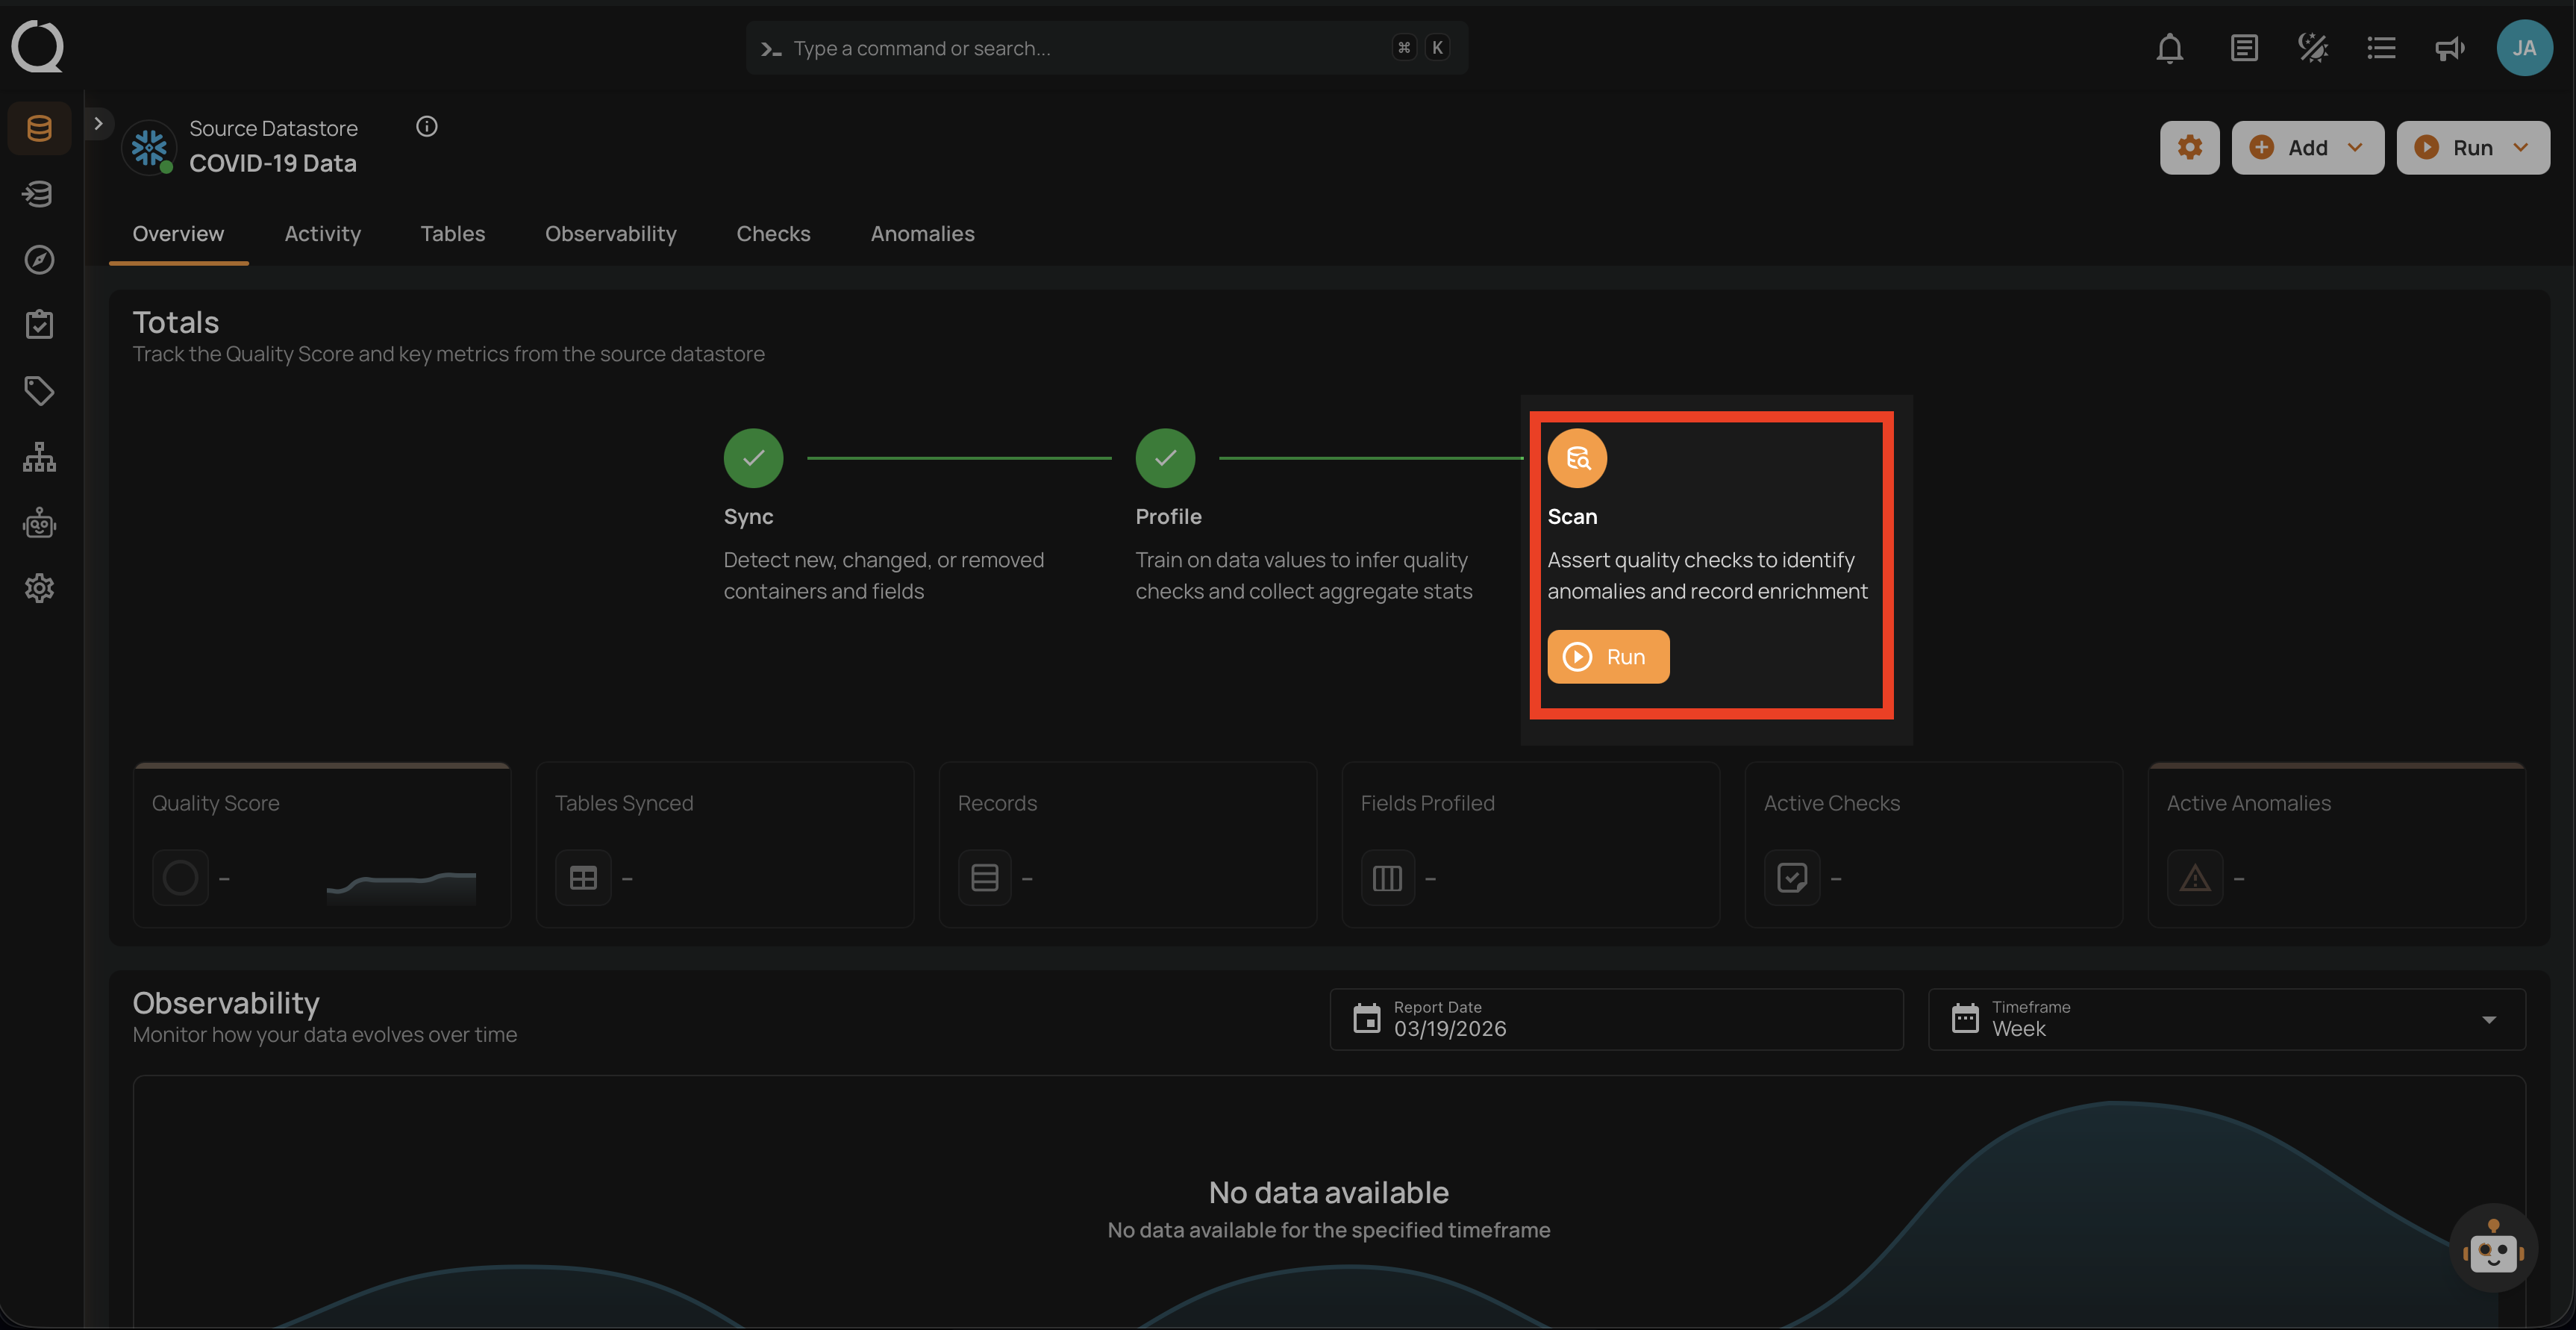
3. Scan Operation
The Scan operation actively monitors data quality:
- Asserts all defined quality checks.
- Identifies anomalies and violations.
- Records results in the Enrichment Datastore.
- Generates quality scores.
The first scan runs as a "Full" scan to establish baselines. After completion, you can review:
- Start and finish times.
- Records processed.
- Anomalies detected.
- Quality scores.
Managing Data Quality
Quality Checks
Qualytics uses two types of quality checks:
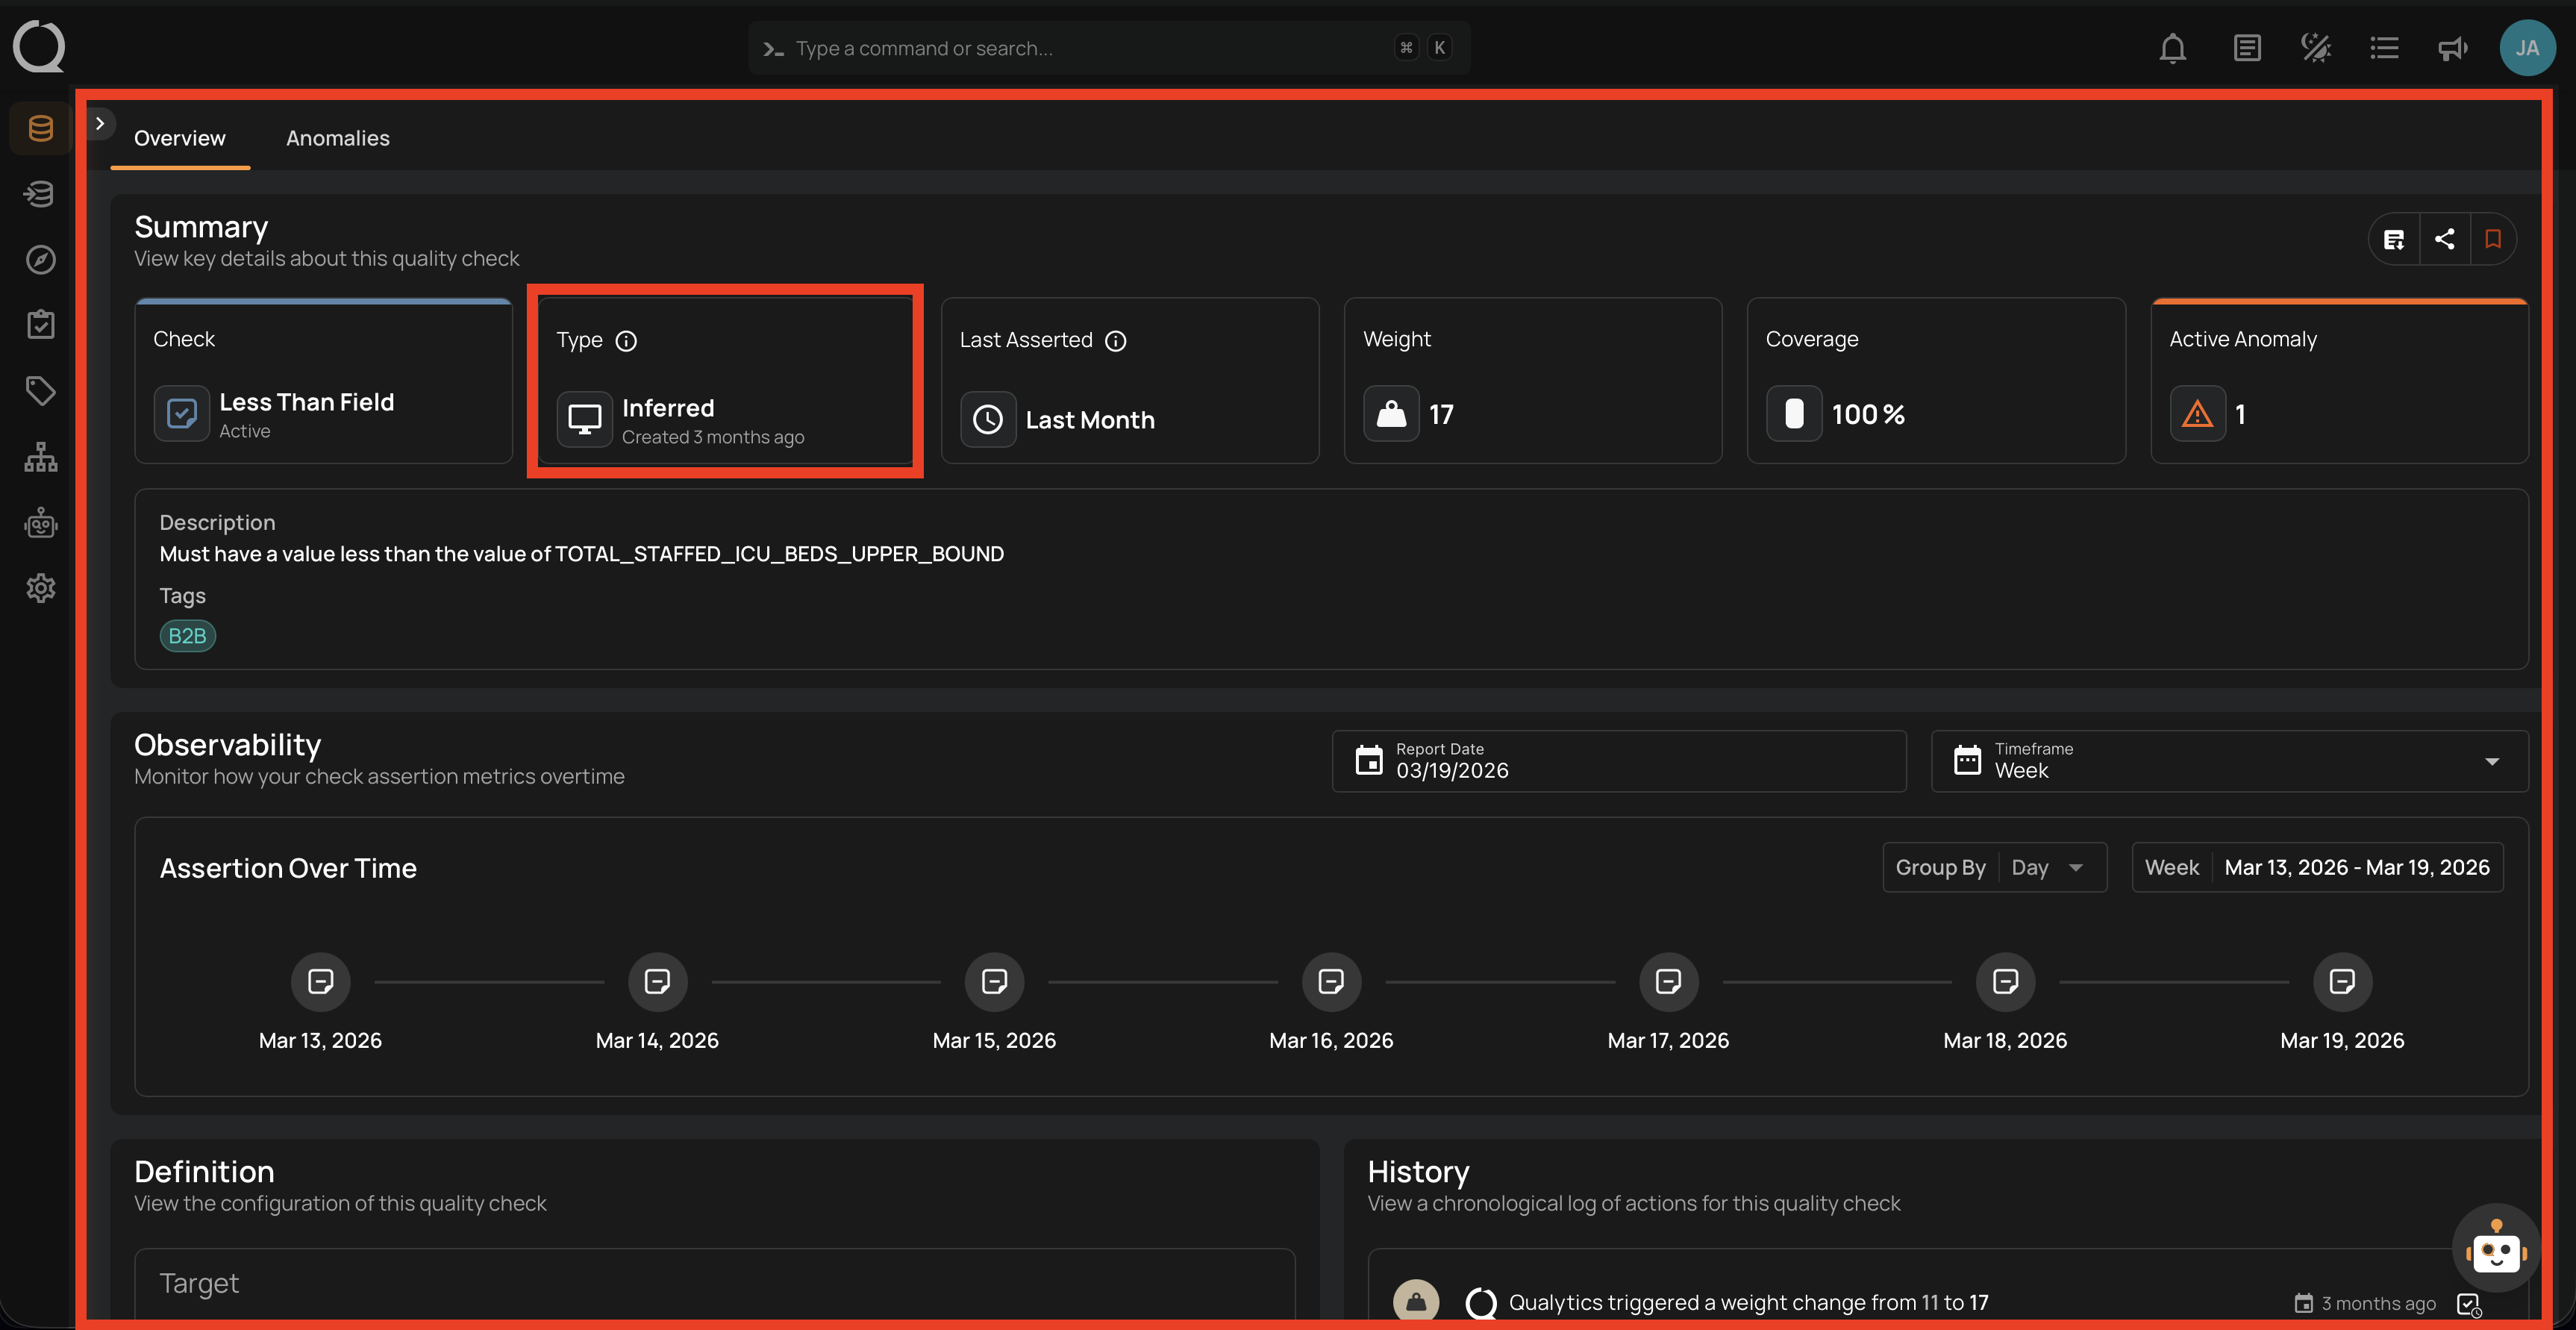
1. Inferred Checks
- Automatically generated during profiling.
- Cover 80-90% of common quality rules.
- Based on statistical analysis and ML.
- Continuously refined through operation.
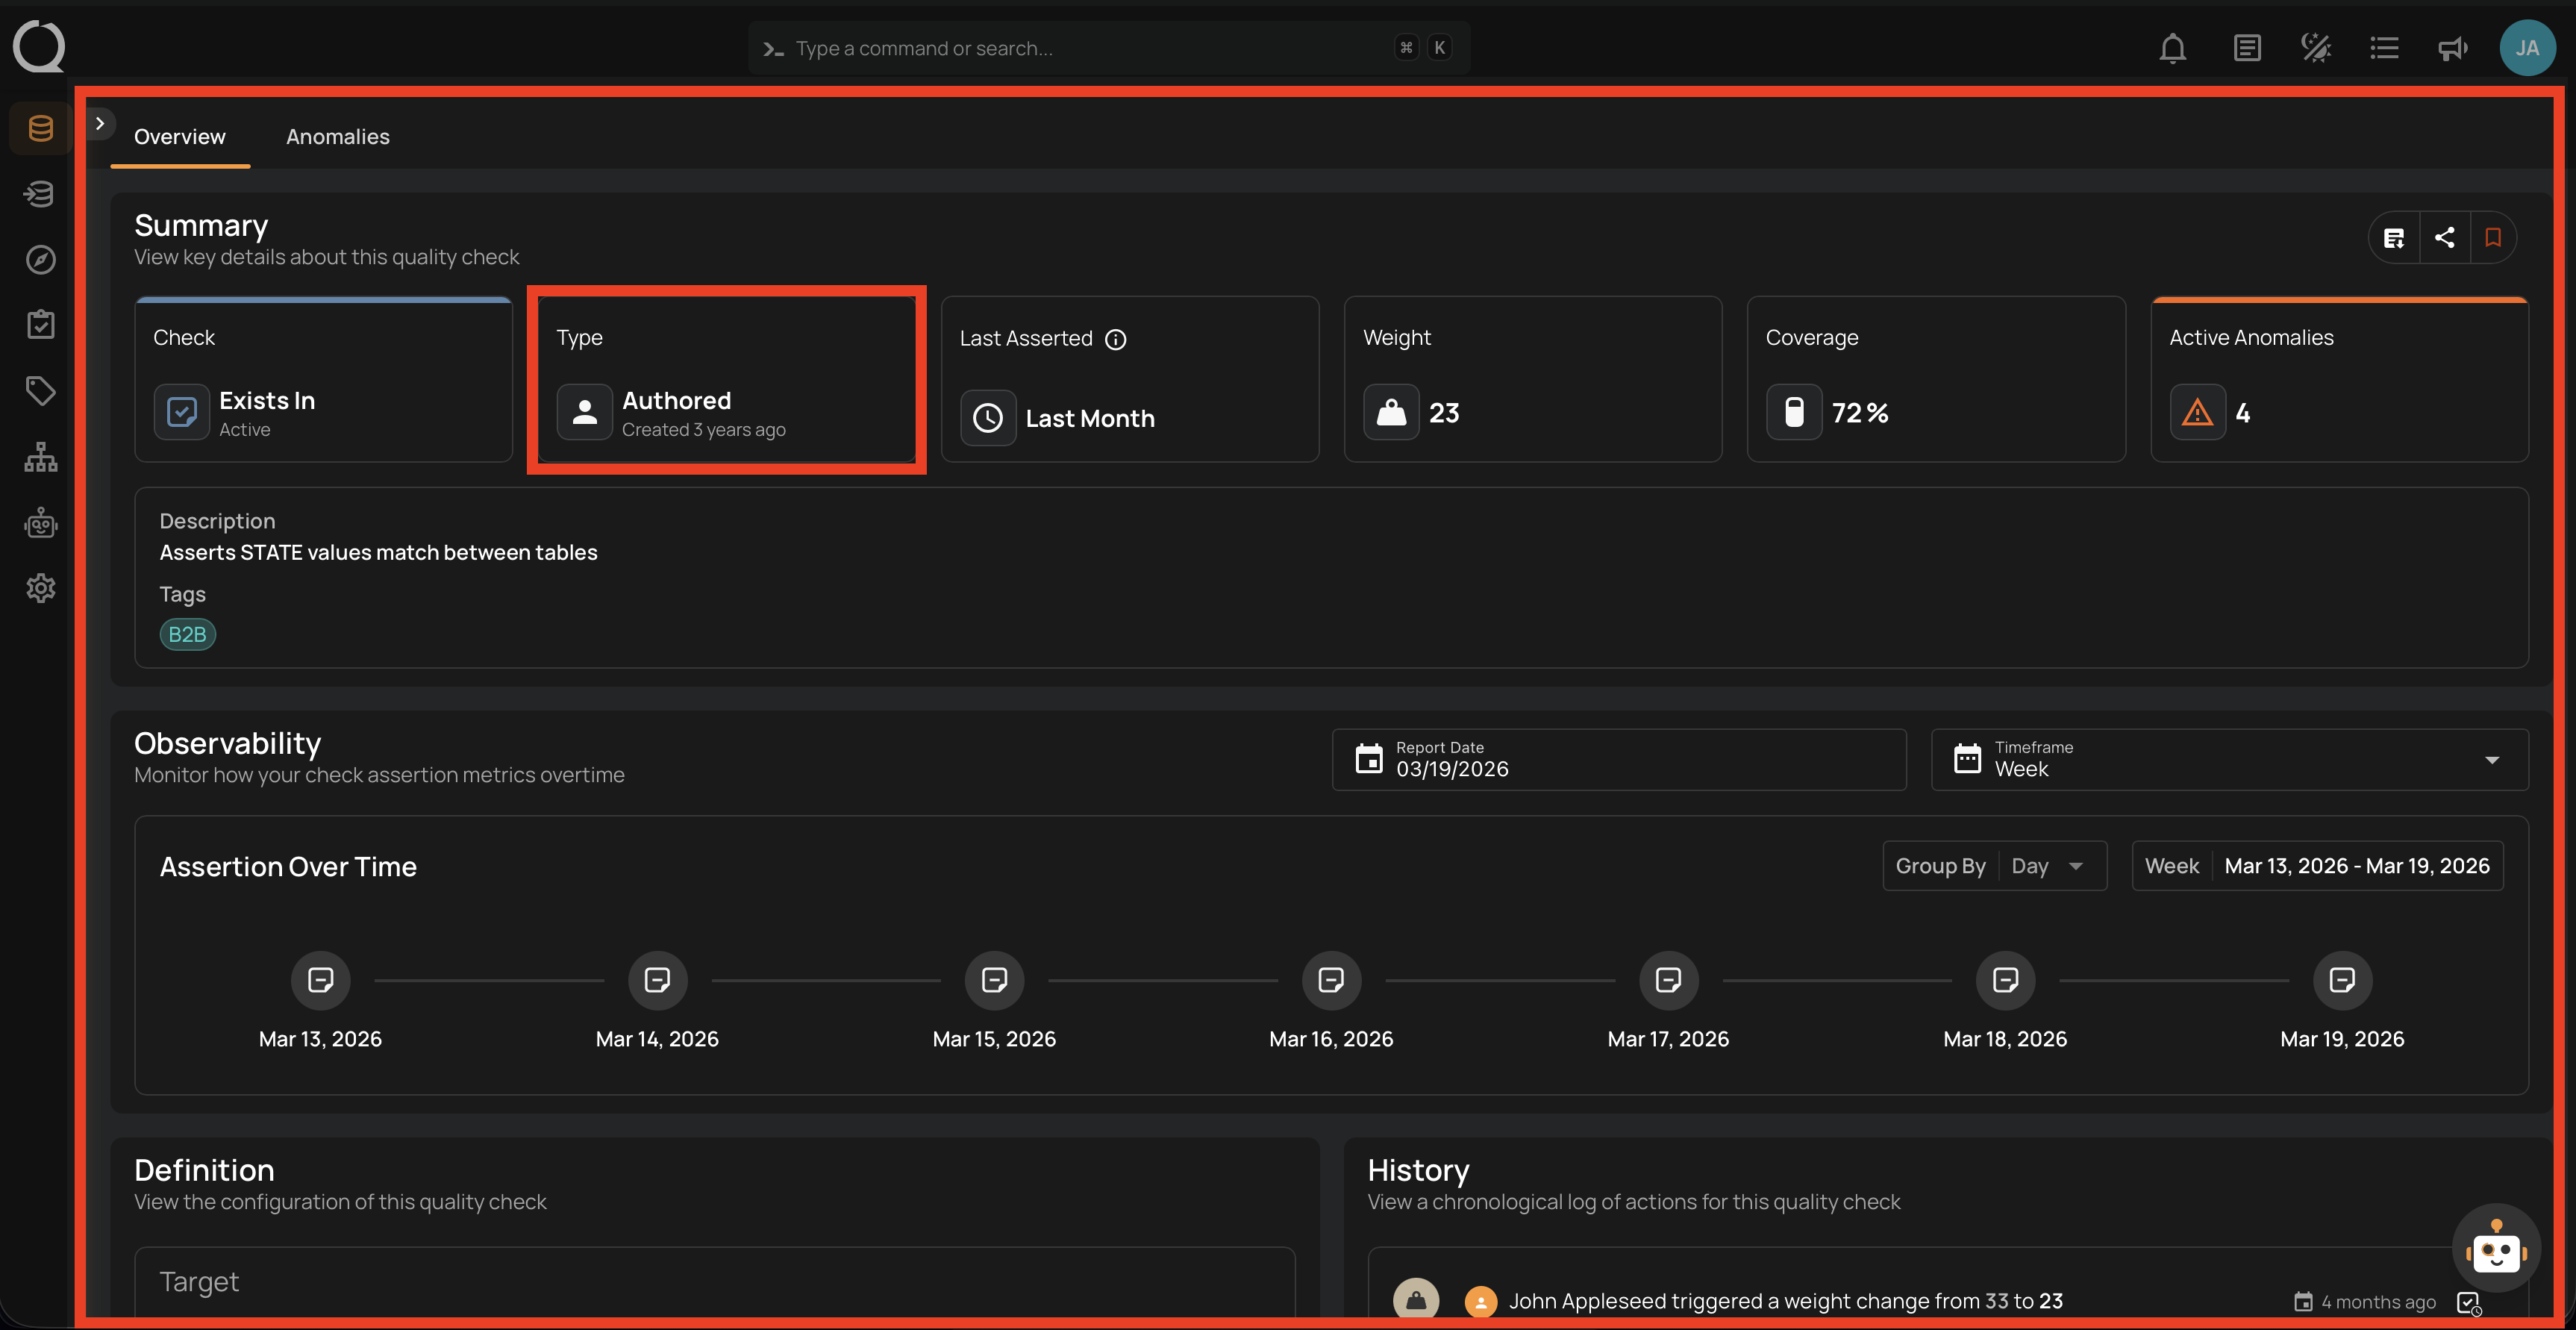
2. Authored Checks
- Manually created by users.
- Support complex business rules.
- Use Spark SQL or Scala UDFs.
- Can be templated and shared.
Platform Navigation
Explore Dashboard
The Explore interface provides comprehensive visibility:
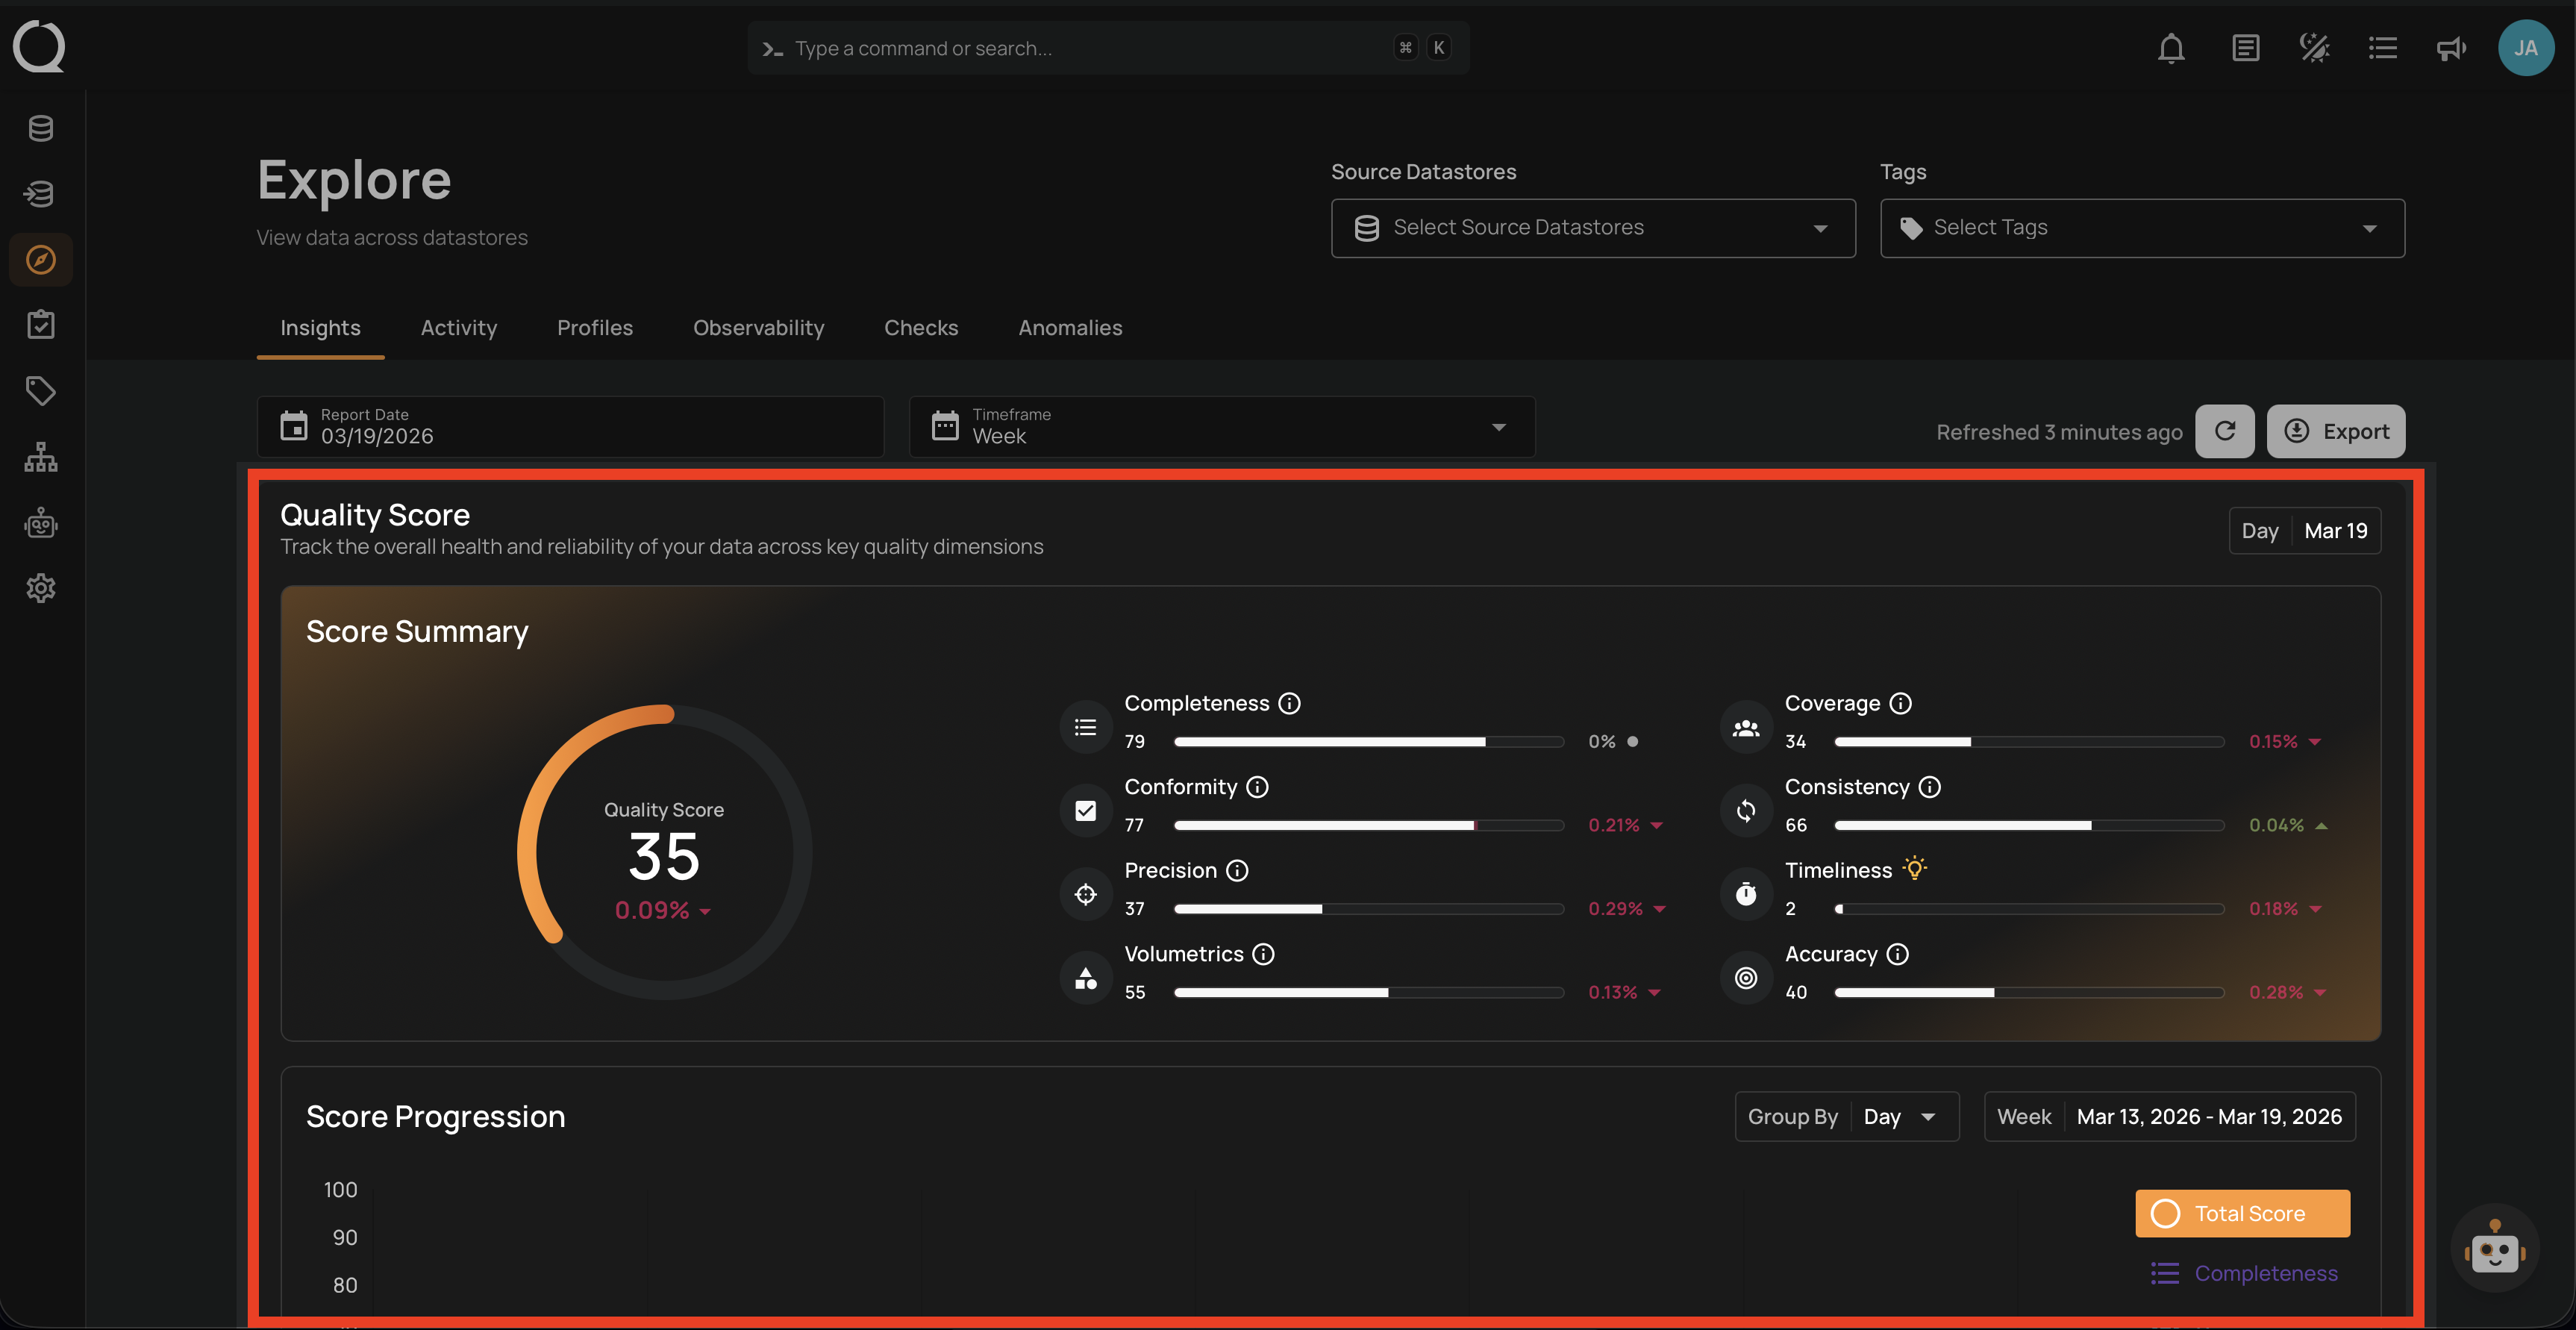
1. Insights
- Overview of anomaly detection.
- Quality monitoring metrics.
- Filterable by source, tags, and dates.
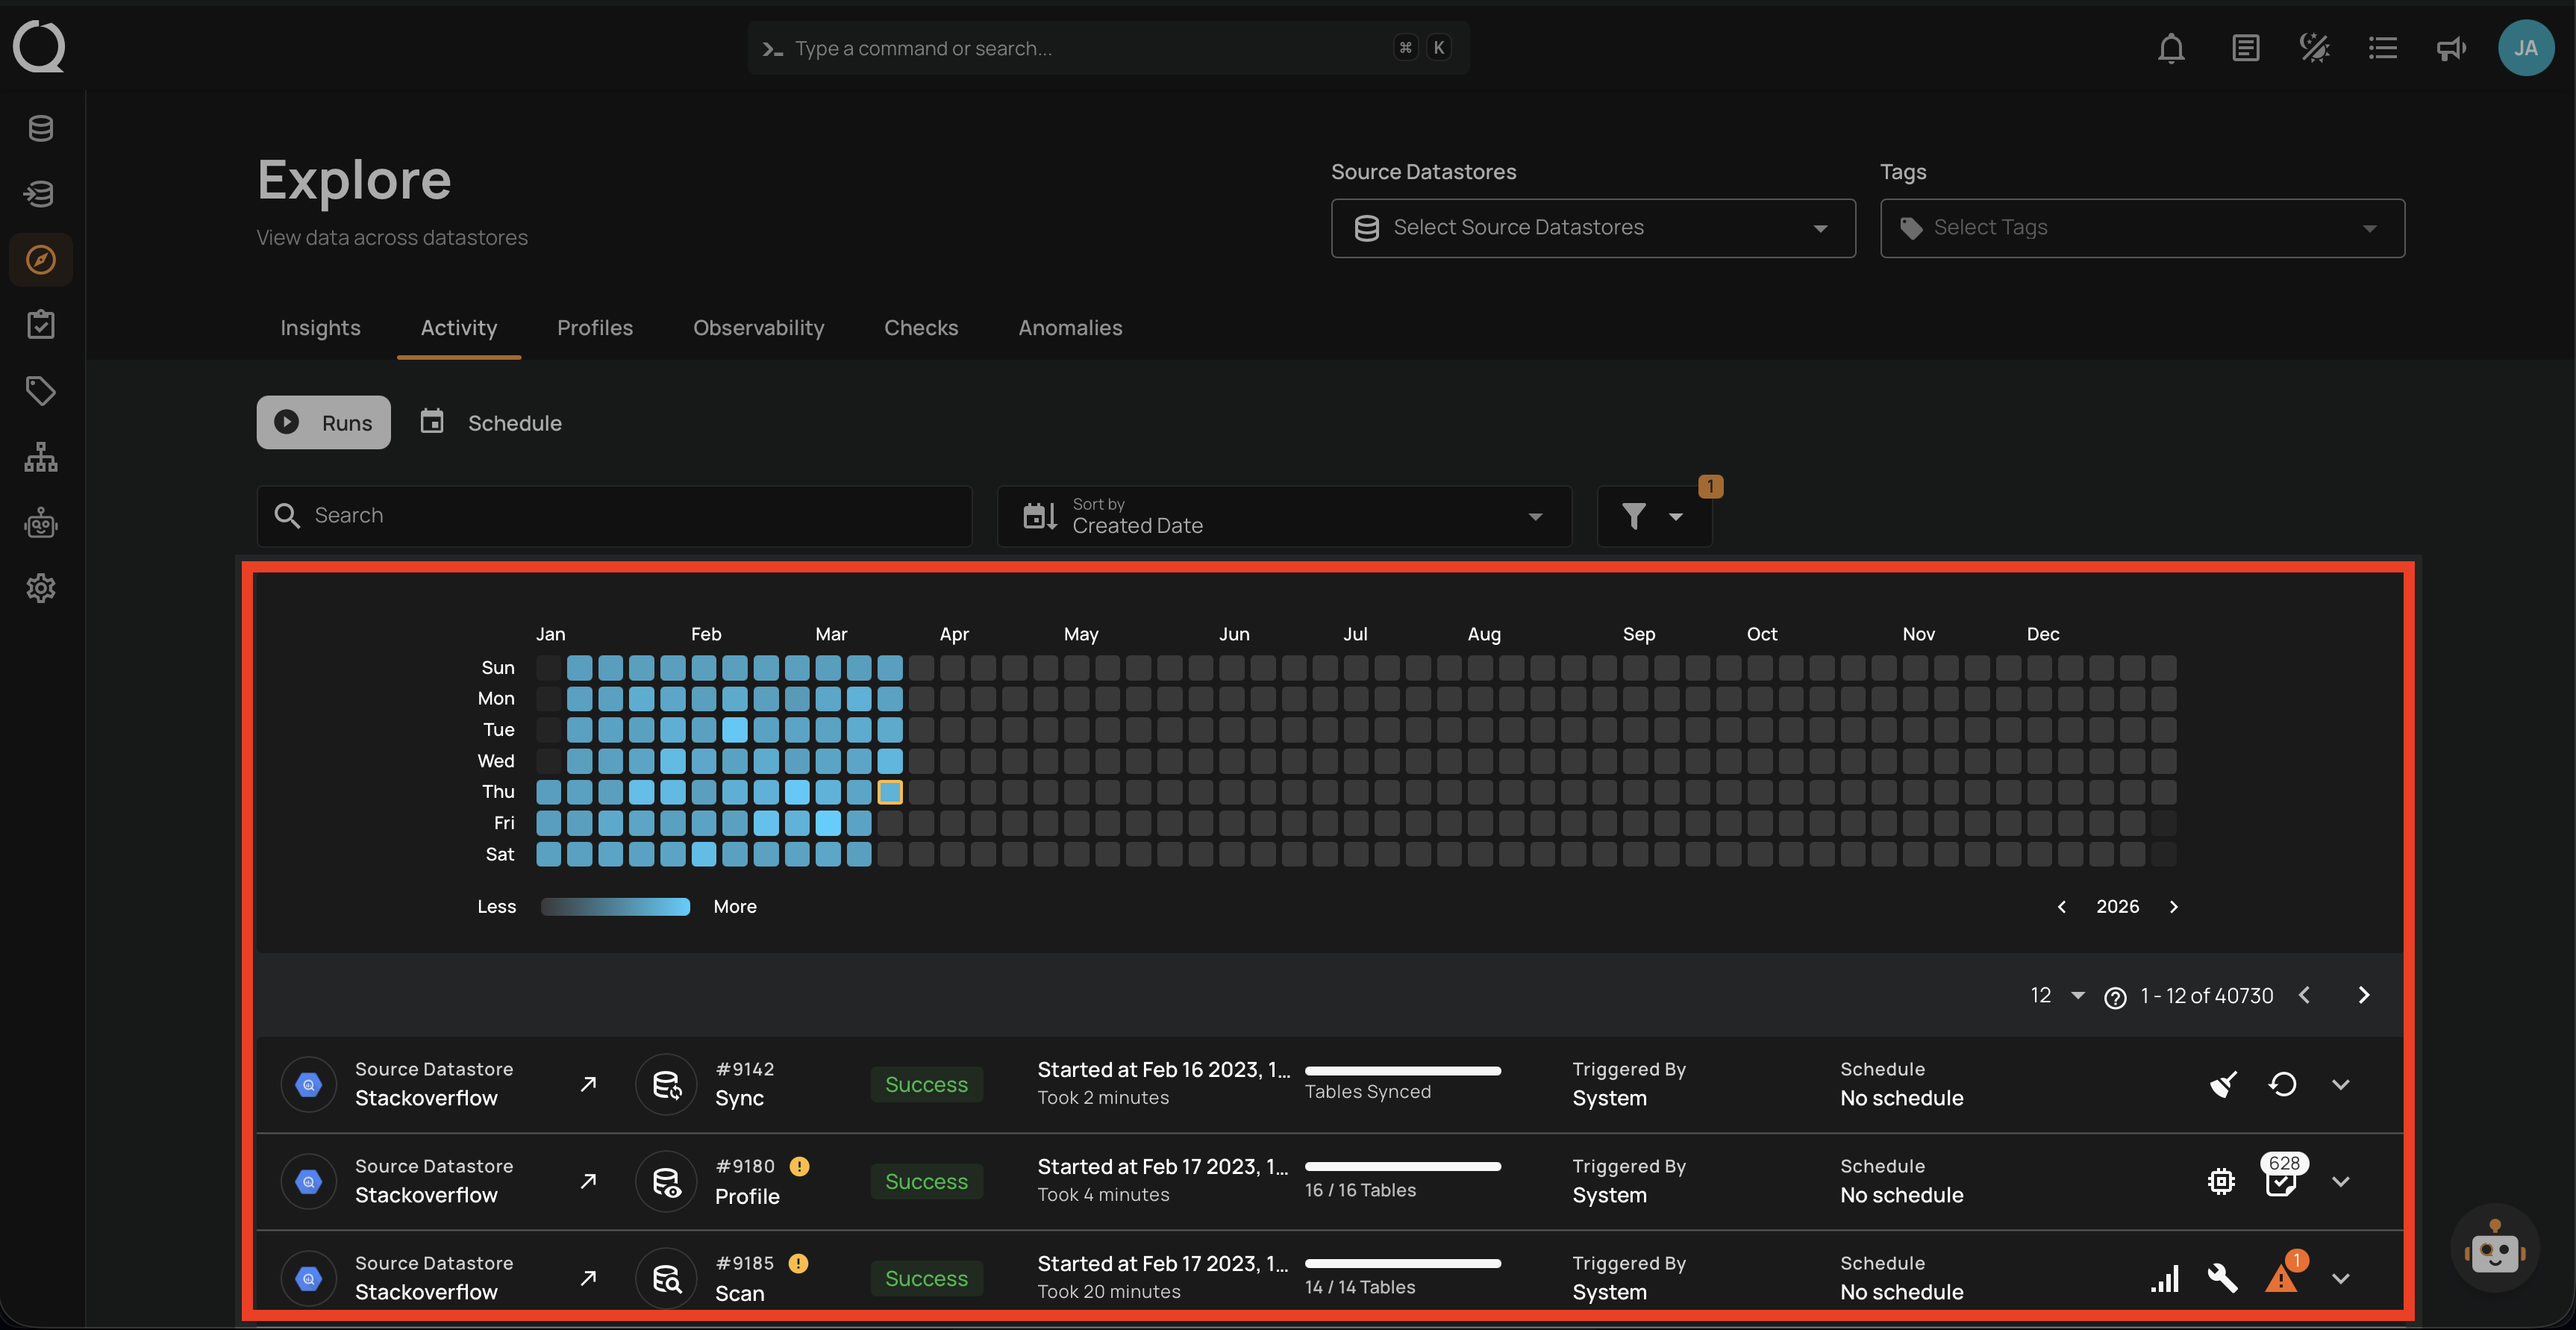
2. Activity
- Operation history and status.
- Data volume heatmaps.
- Anomaly tracking.
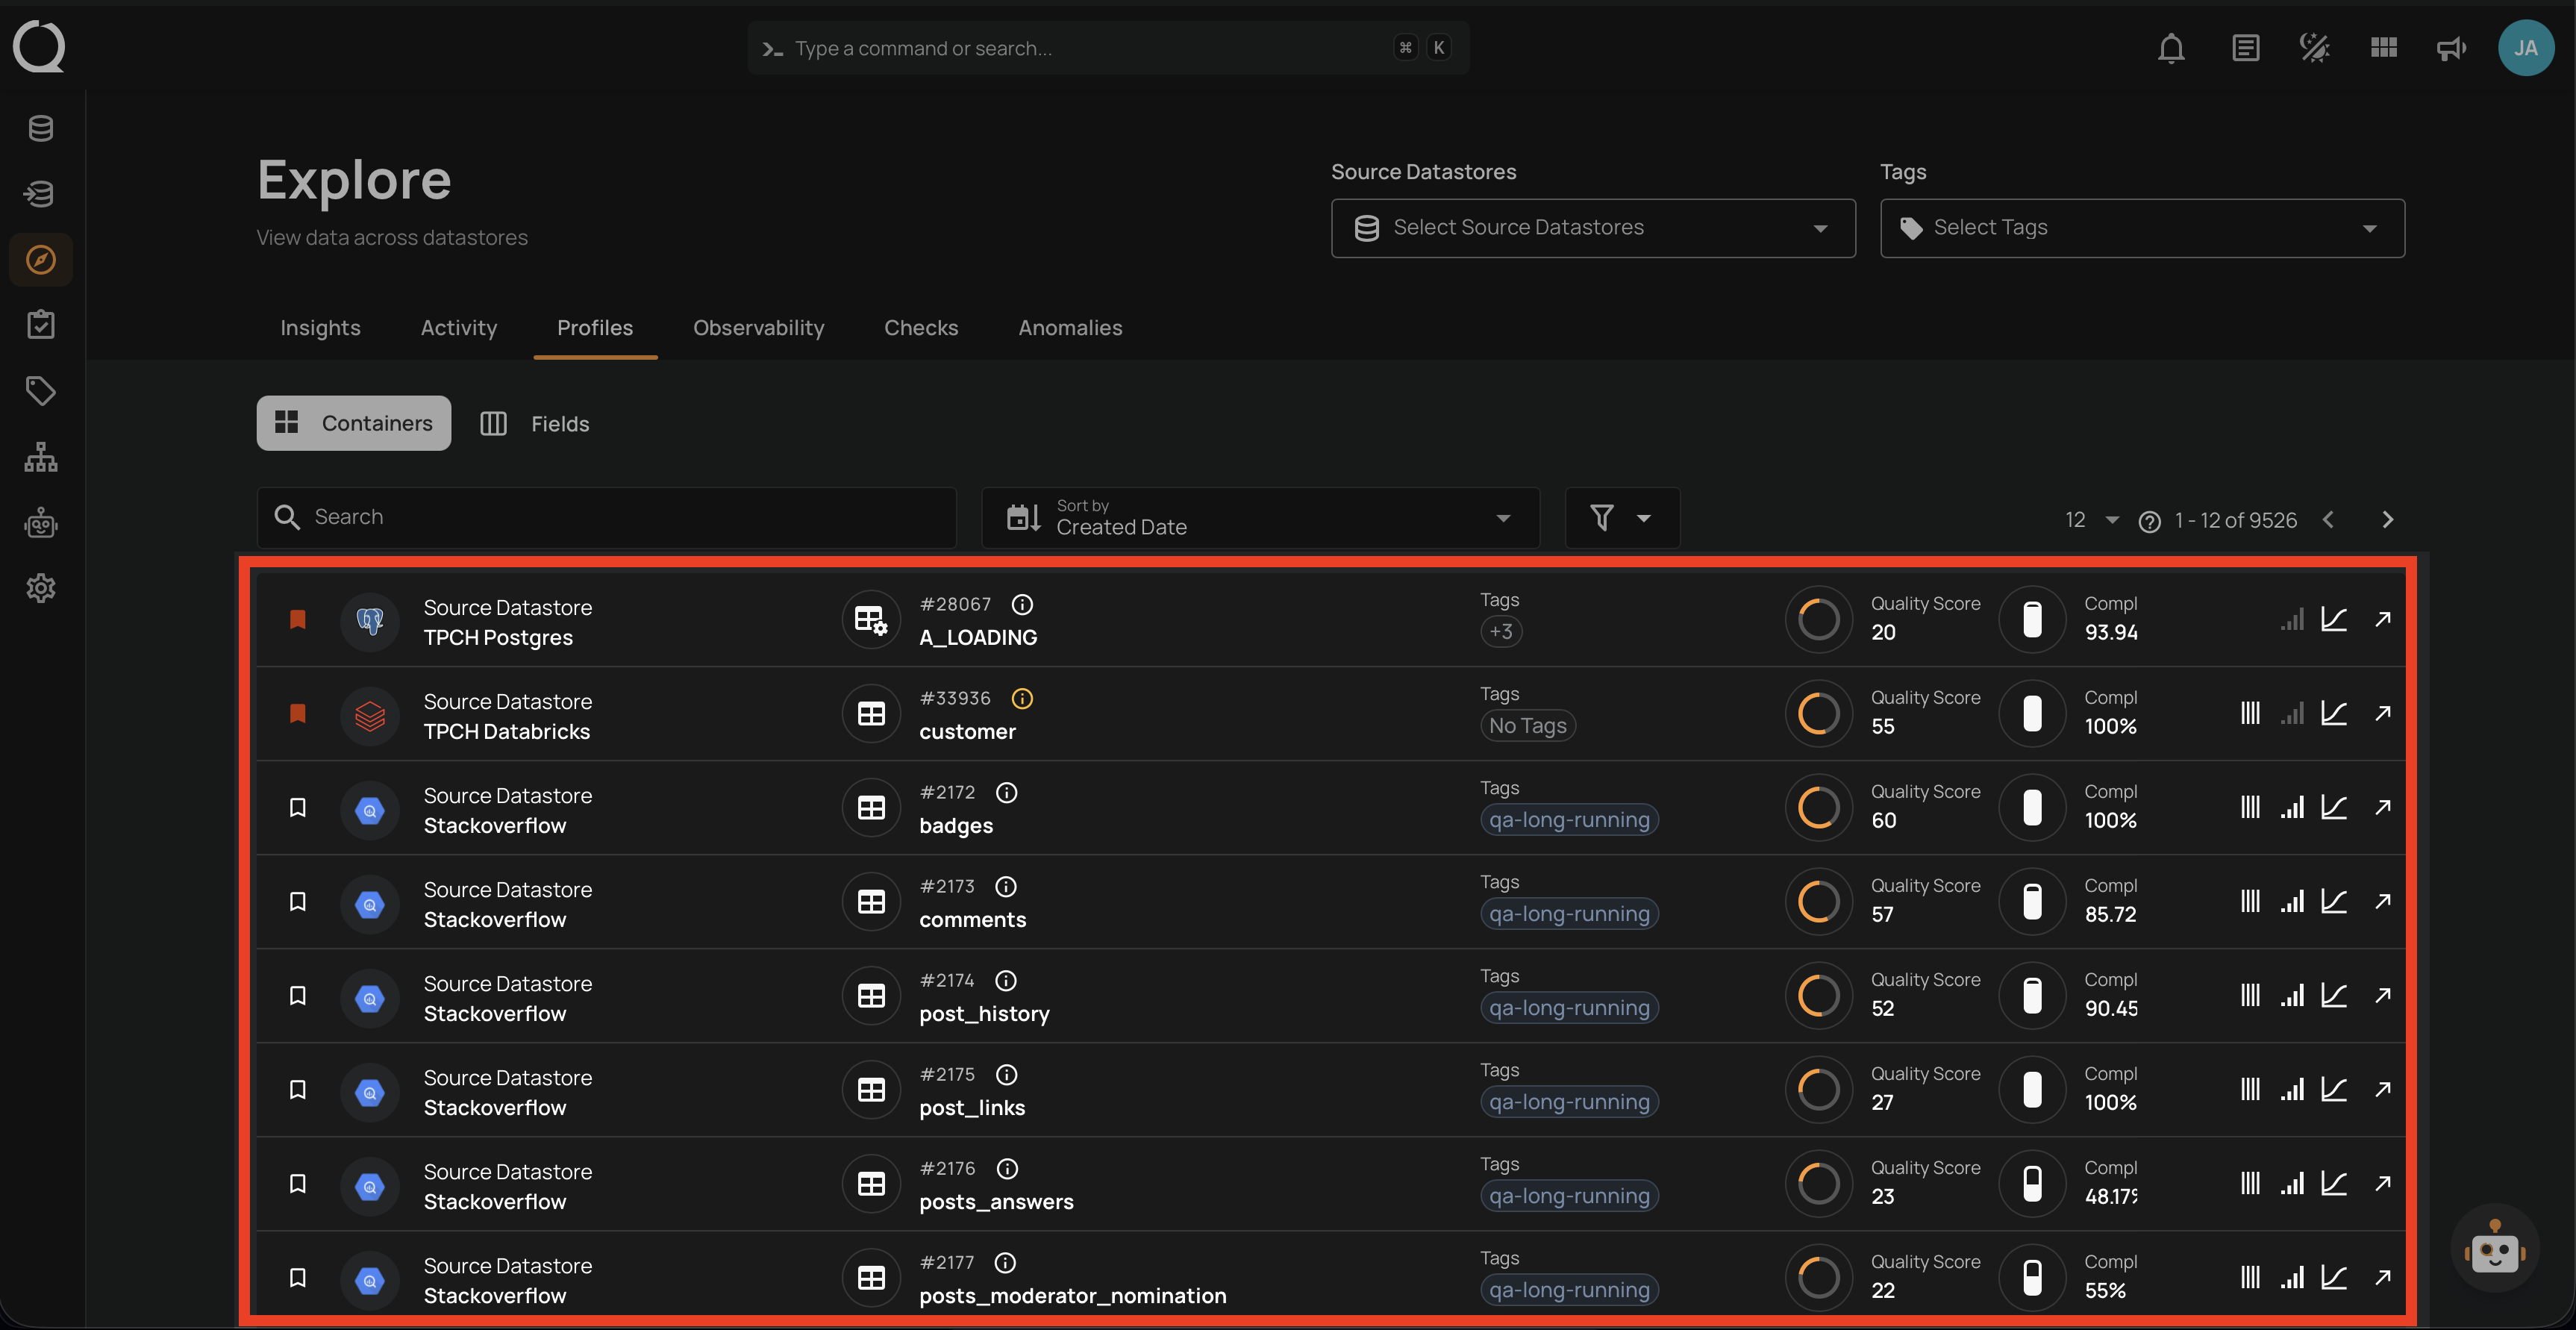
3. Profiles
Unified view of all data assets:
- Tables and Views.
- Computed Assets.
- Field-level Details.
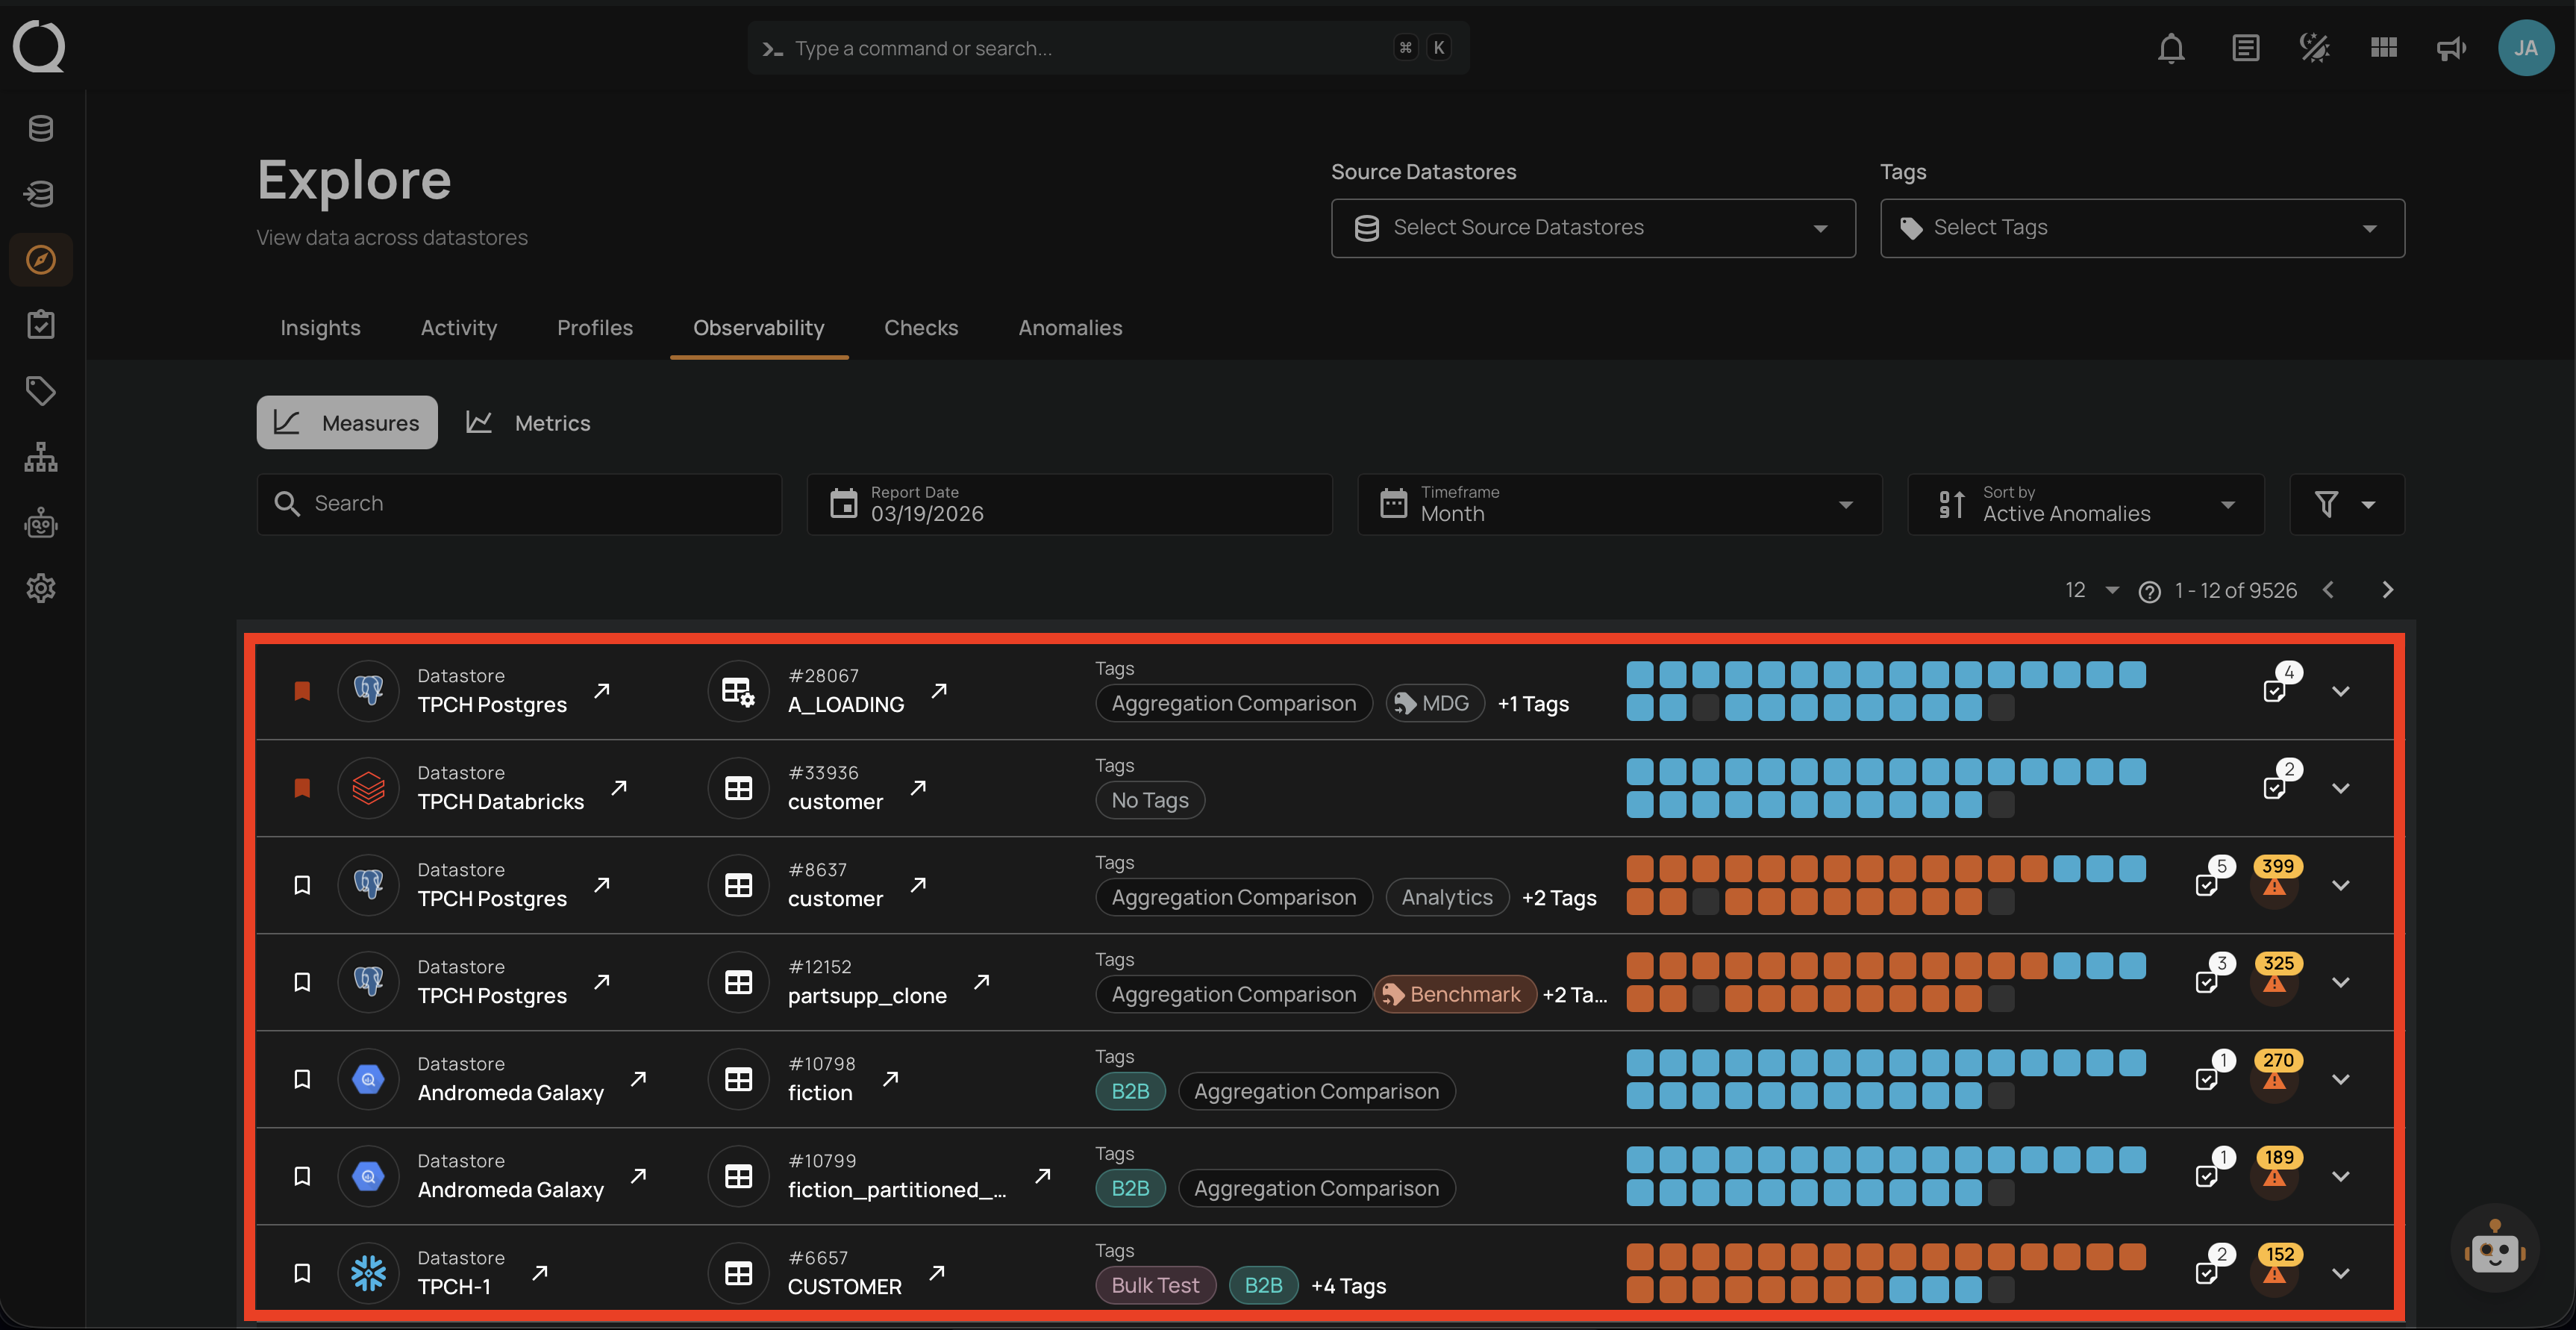
4. Observability
Monitor platform health and performance:
- Volume metrics.
- Quality trends.
- System health.
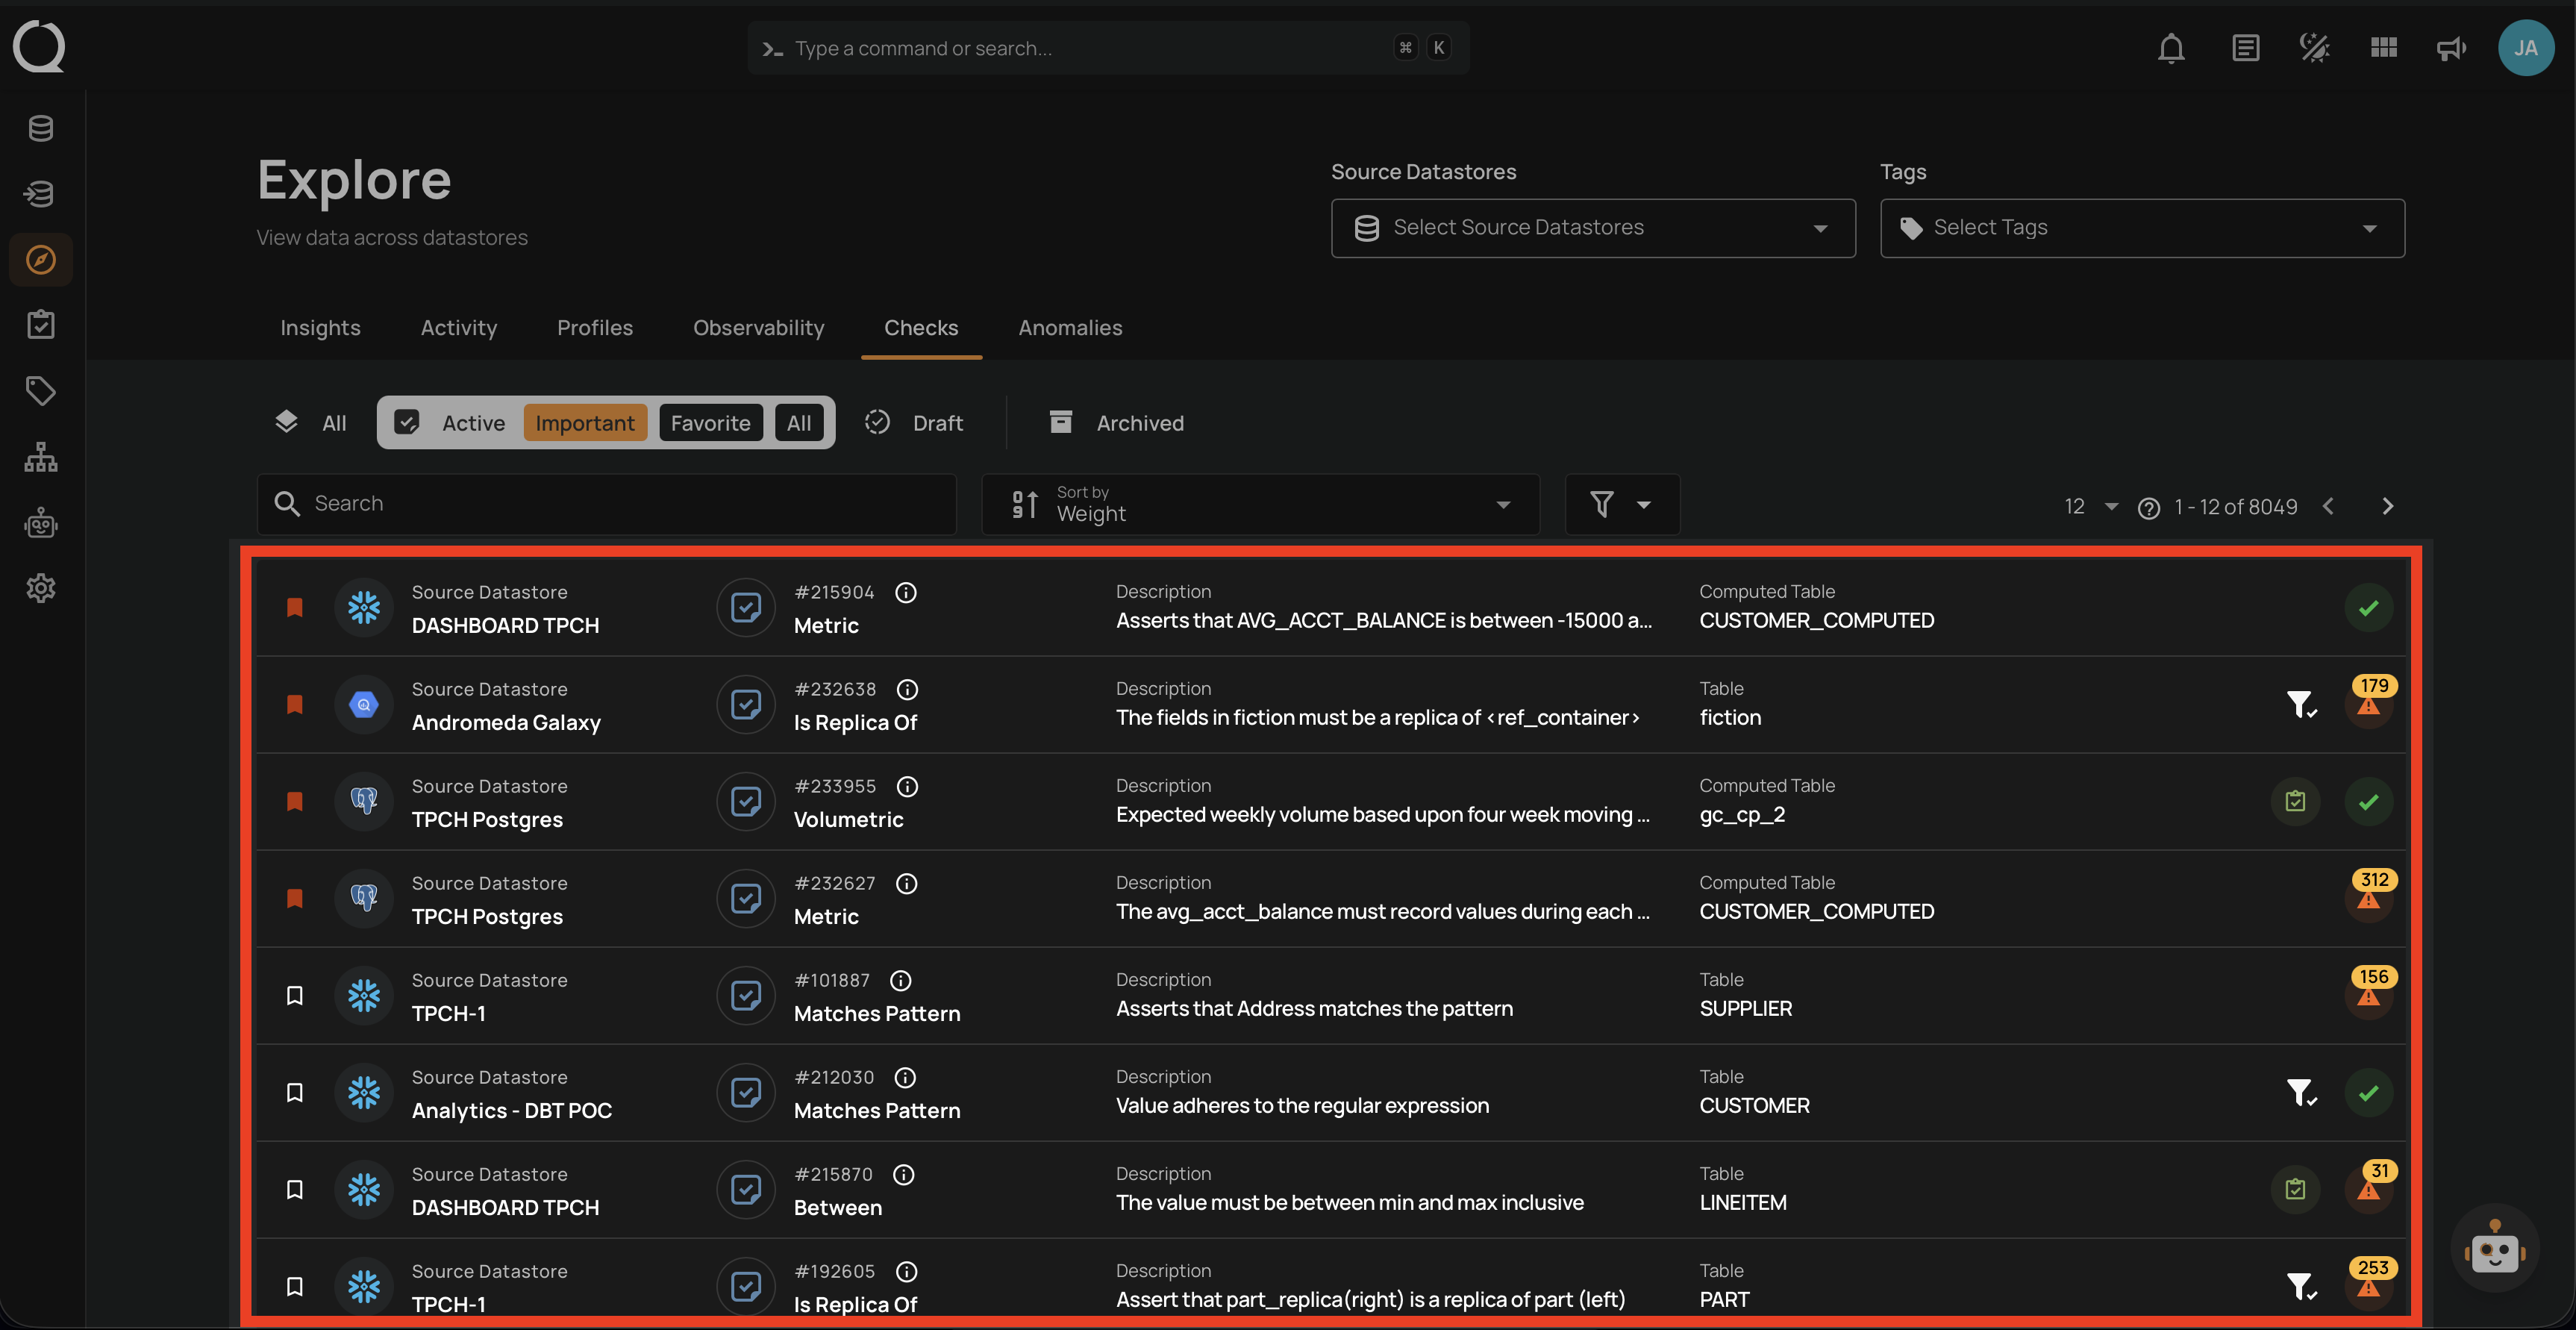
5. Checks
Unified view of all data quality validations across datastores:
- Active, Draft, Favorite, and Archived checks.
- Filter by Source Datastore, Tags, or Importance.
- View validation results by table and field, including pass/fail status and anomaly counts.
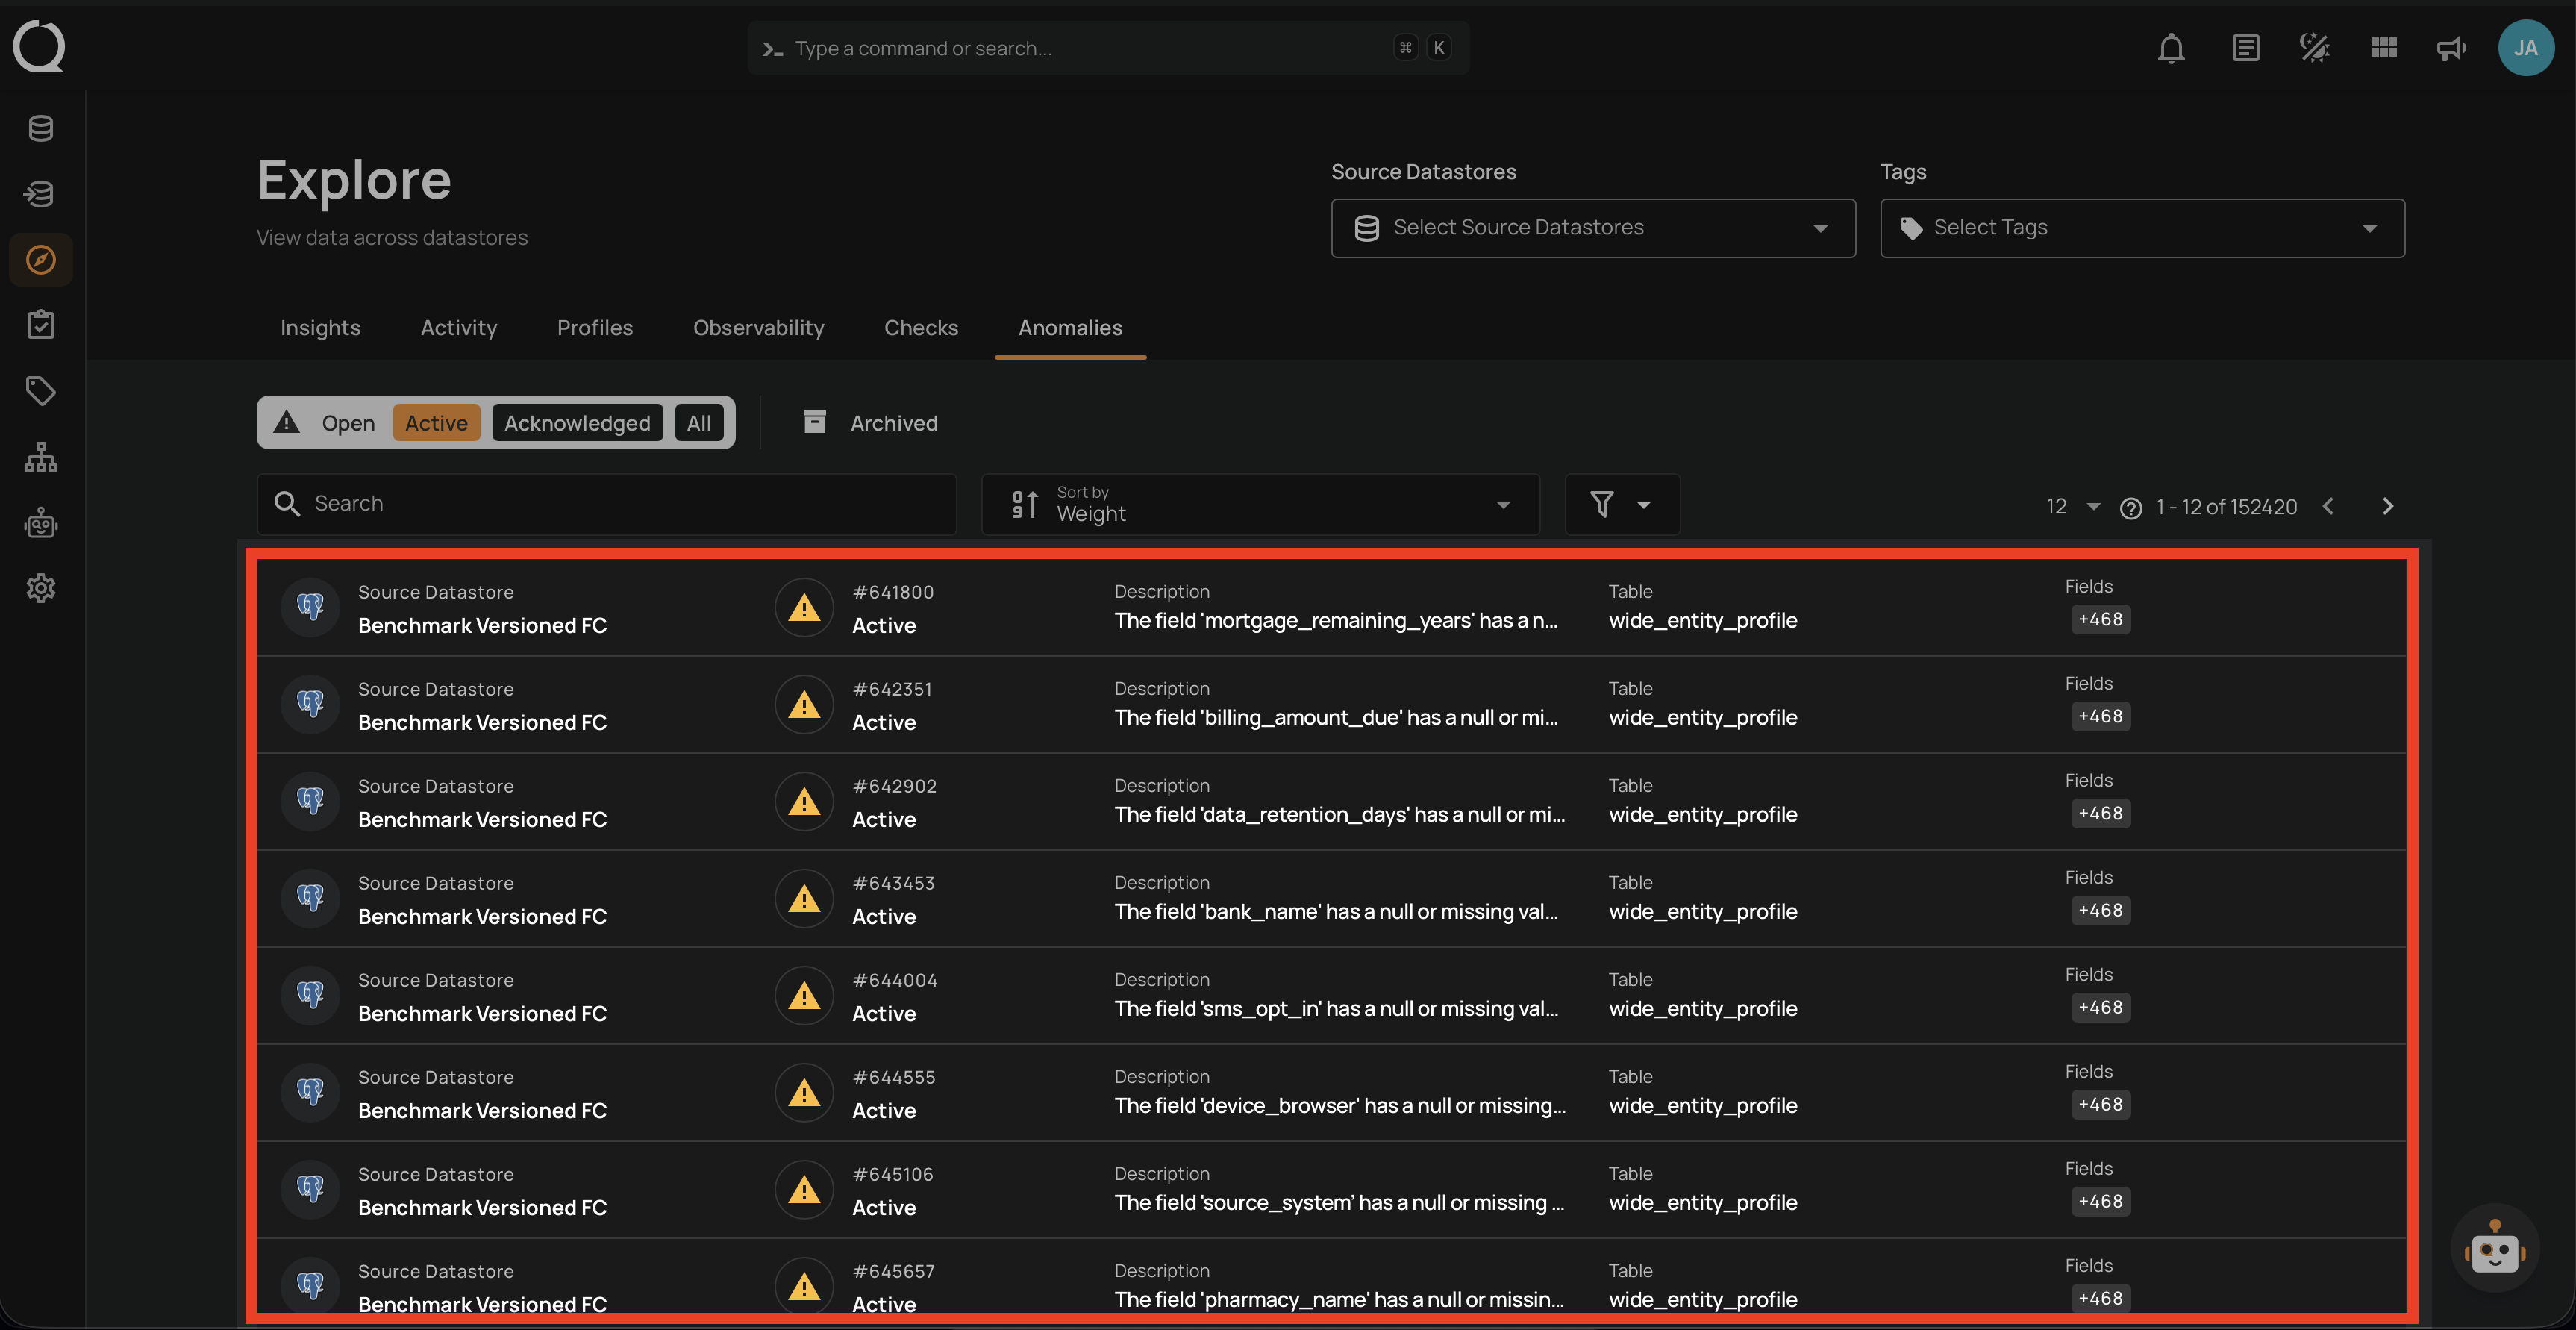
6. Anomalies
Centralized view of all detected data issues across datastores:
- Filter anomalies by status — Open, Active, Acknowledged, or Archived.
- View details including datastore, table, affected fields, rules triggered, and detection date.
- Track anomaly trends and weights to prioritize investigation and resolution.
Configuration & Management
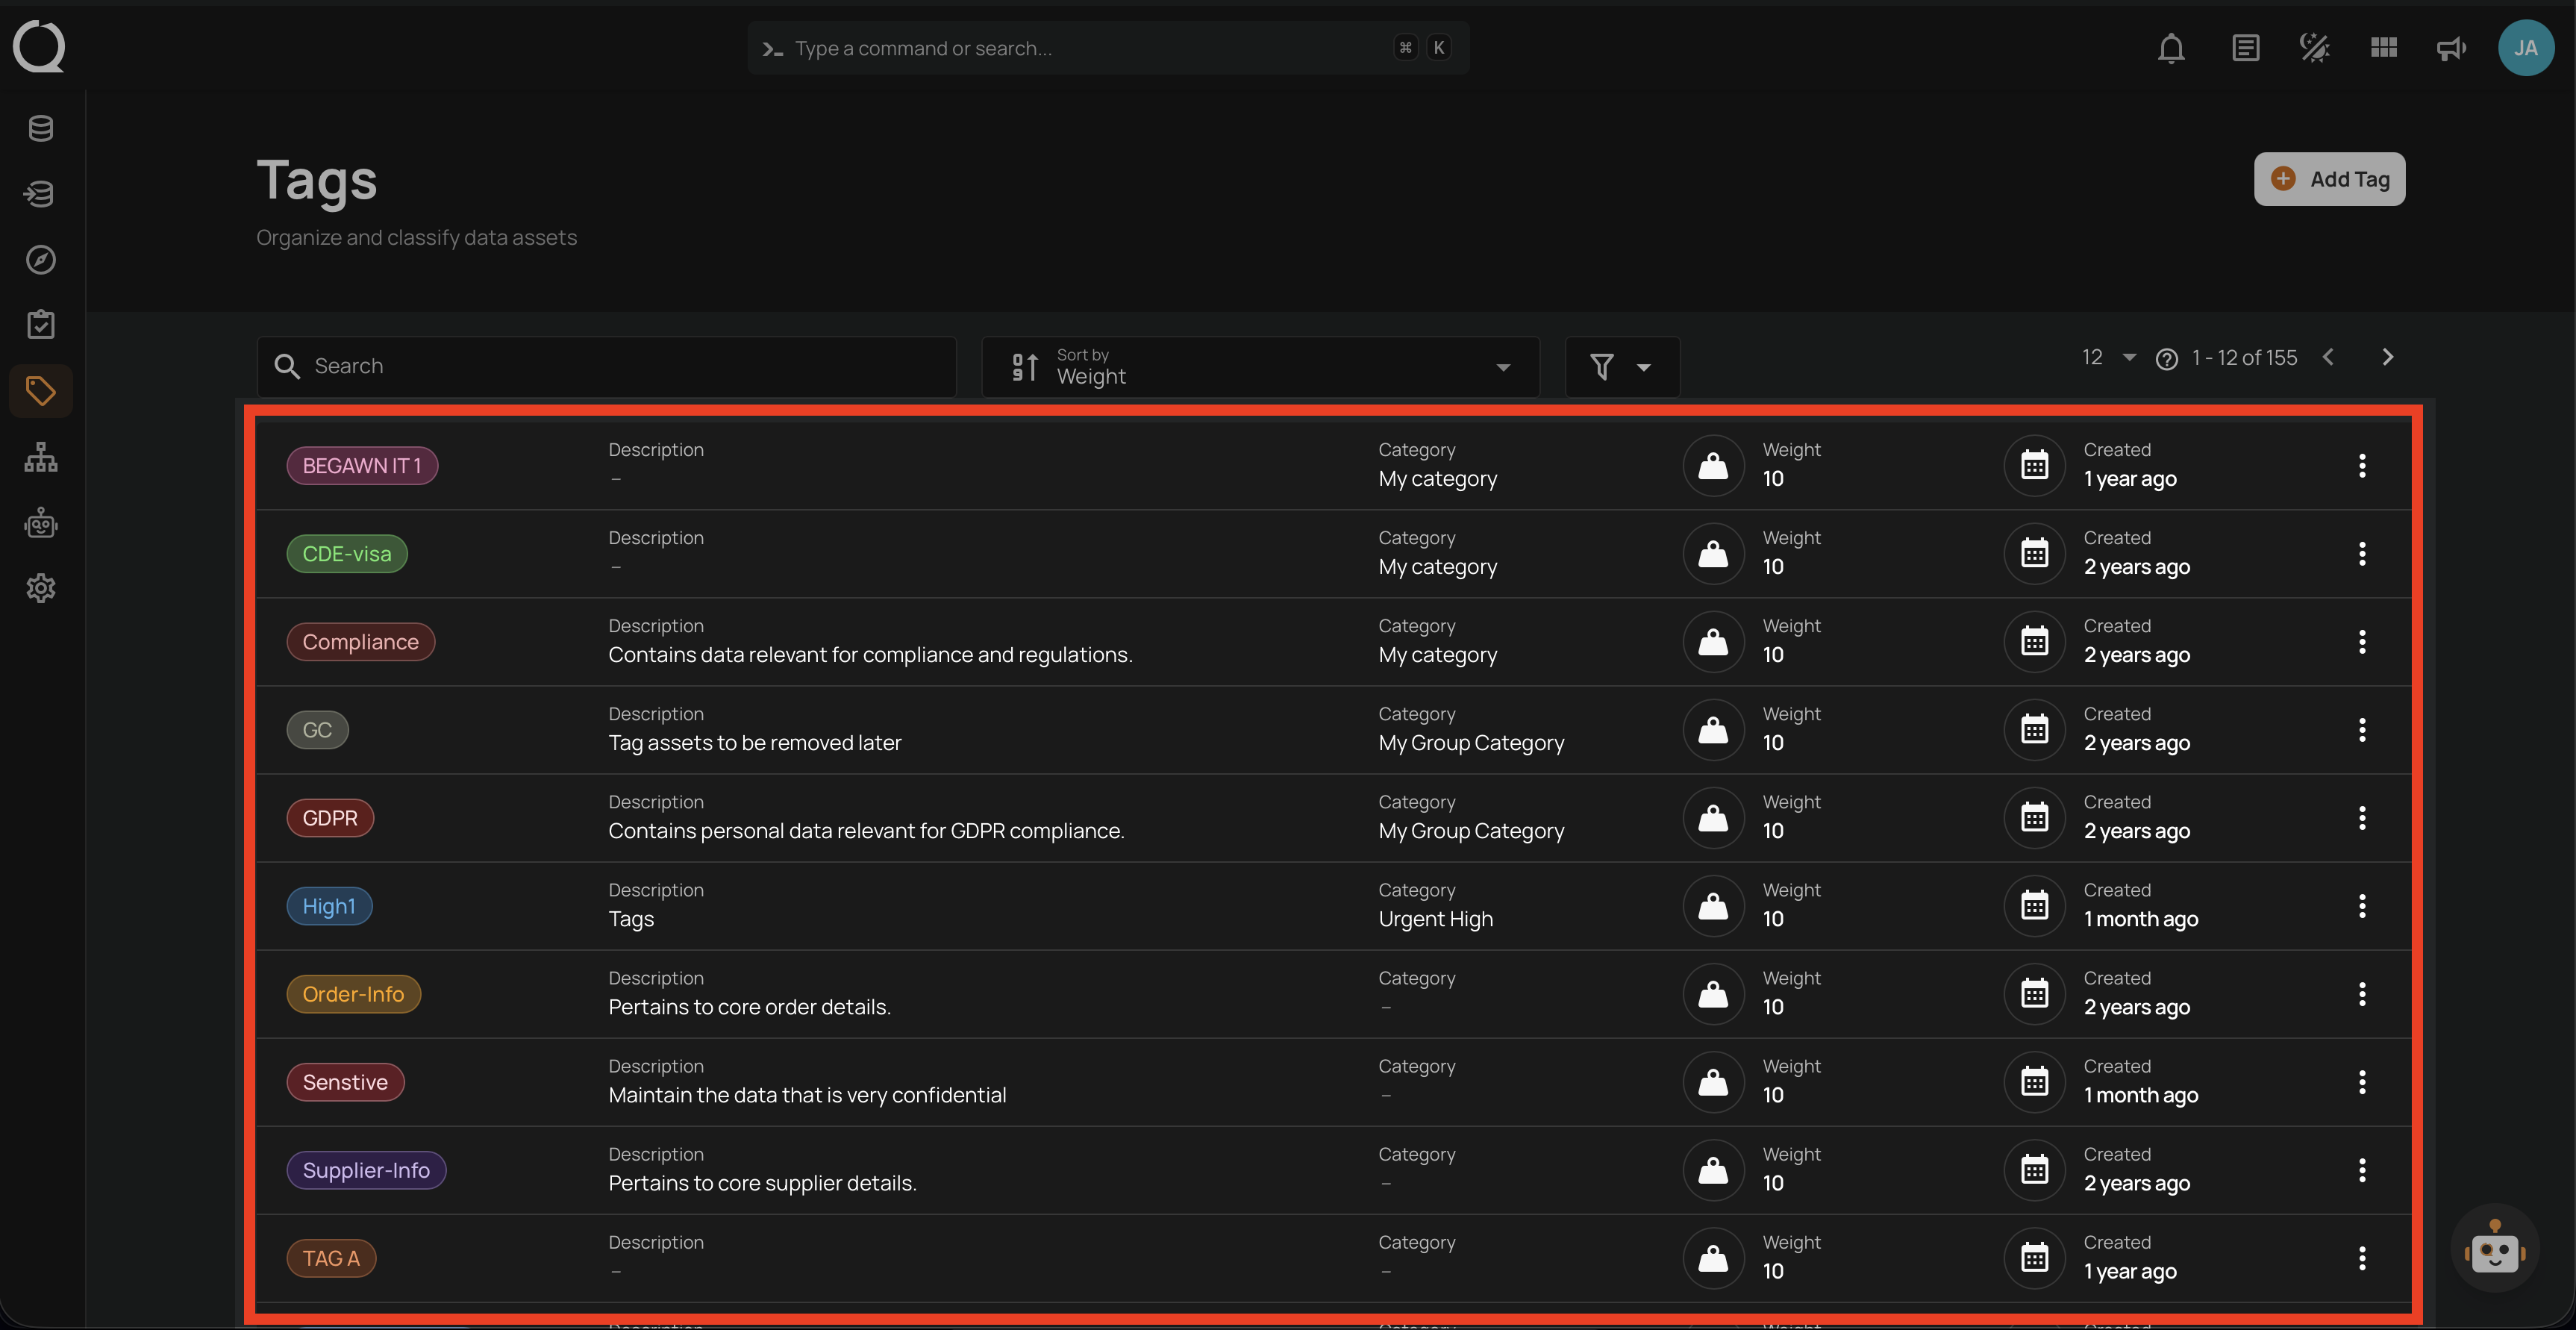
Tags
Organize and prioritize:
- Categorize data assets.
- Drive notifications.
- Weight importance.
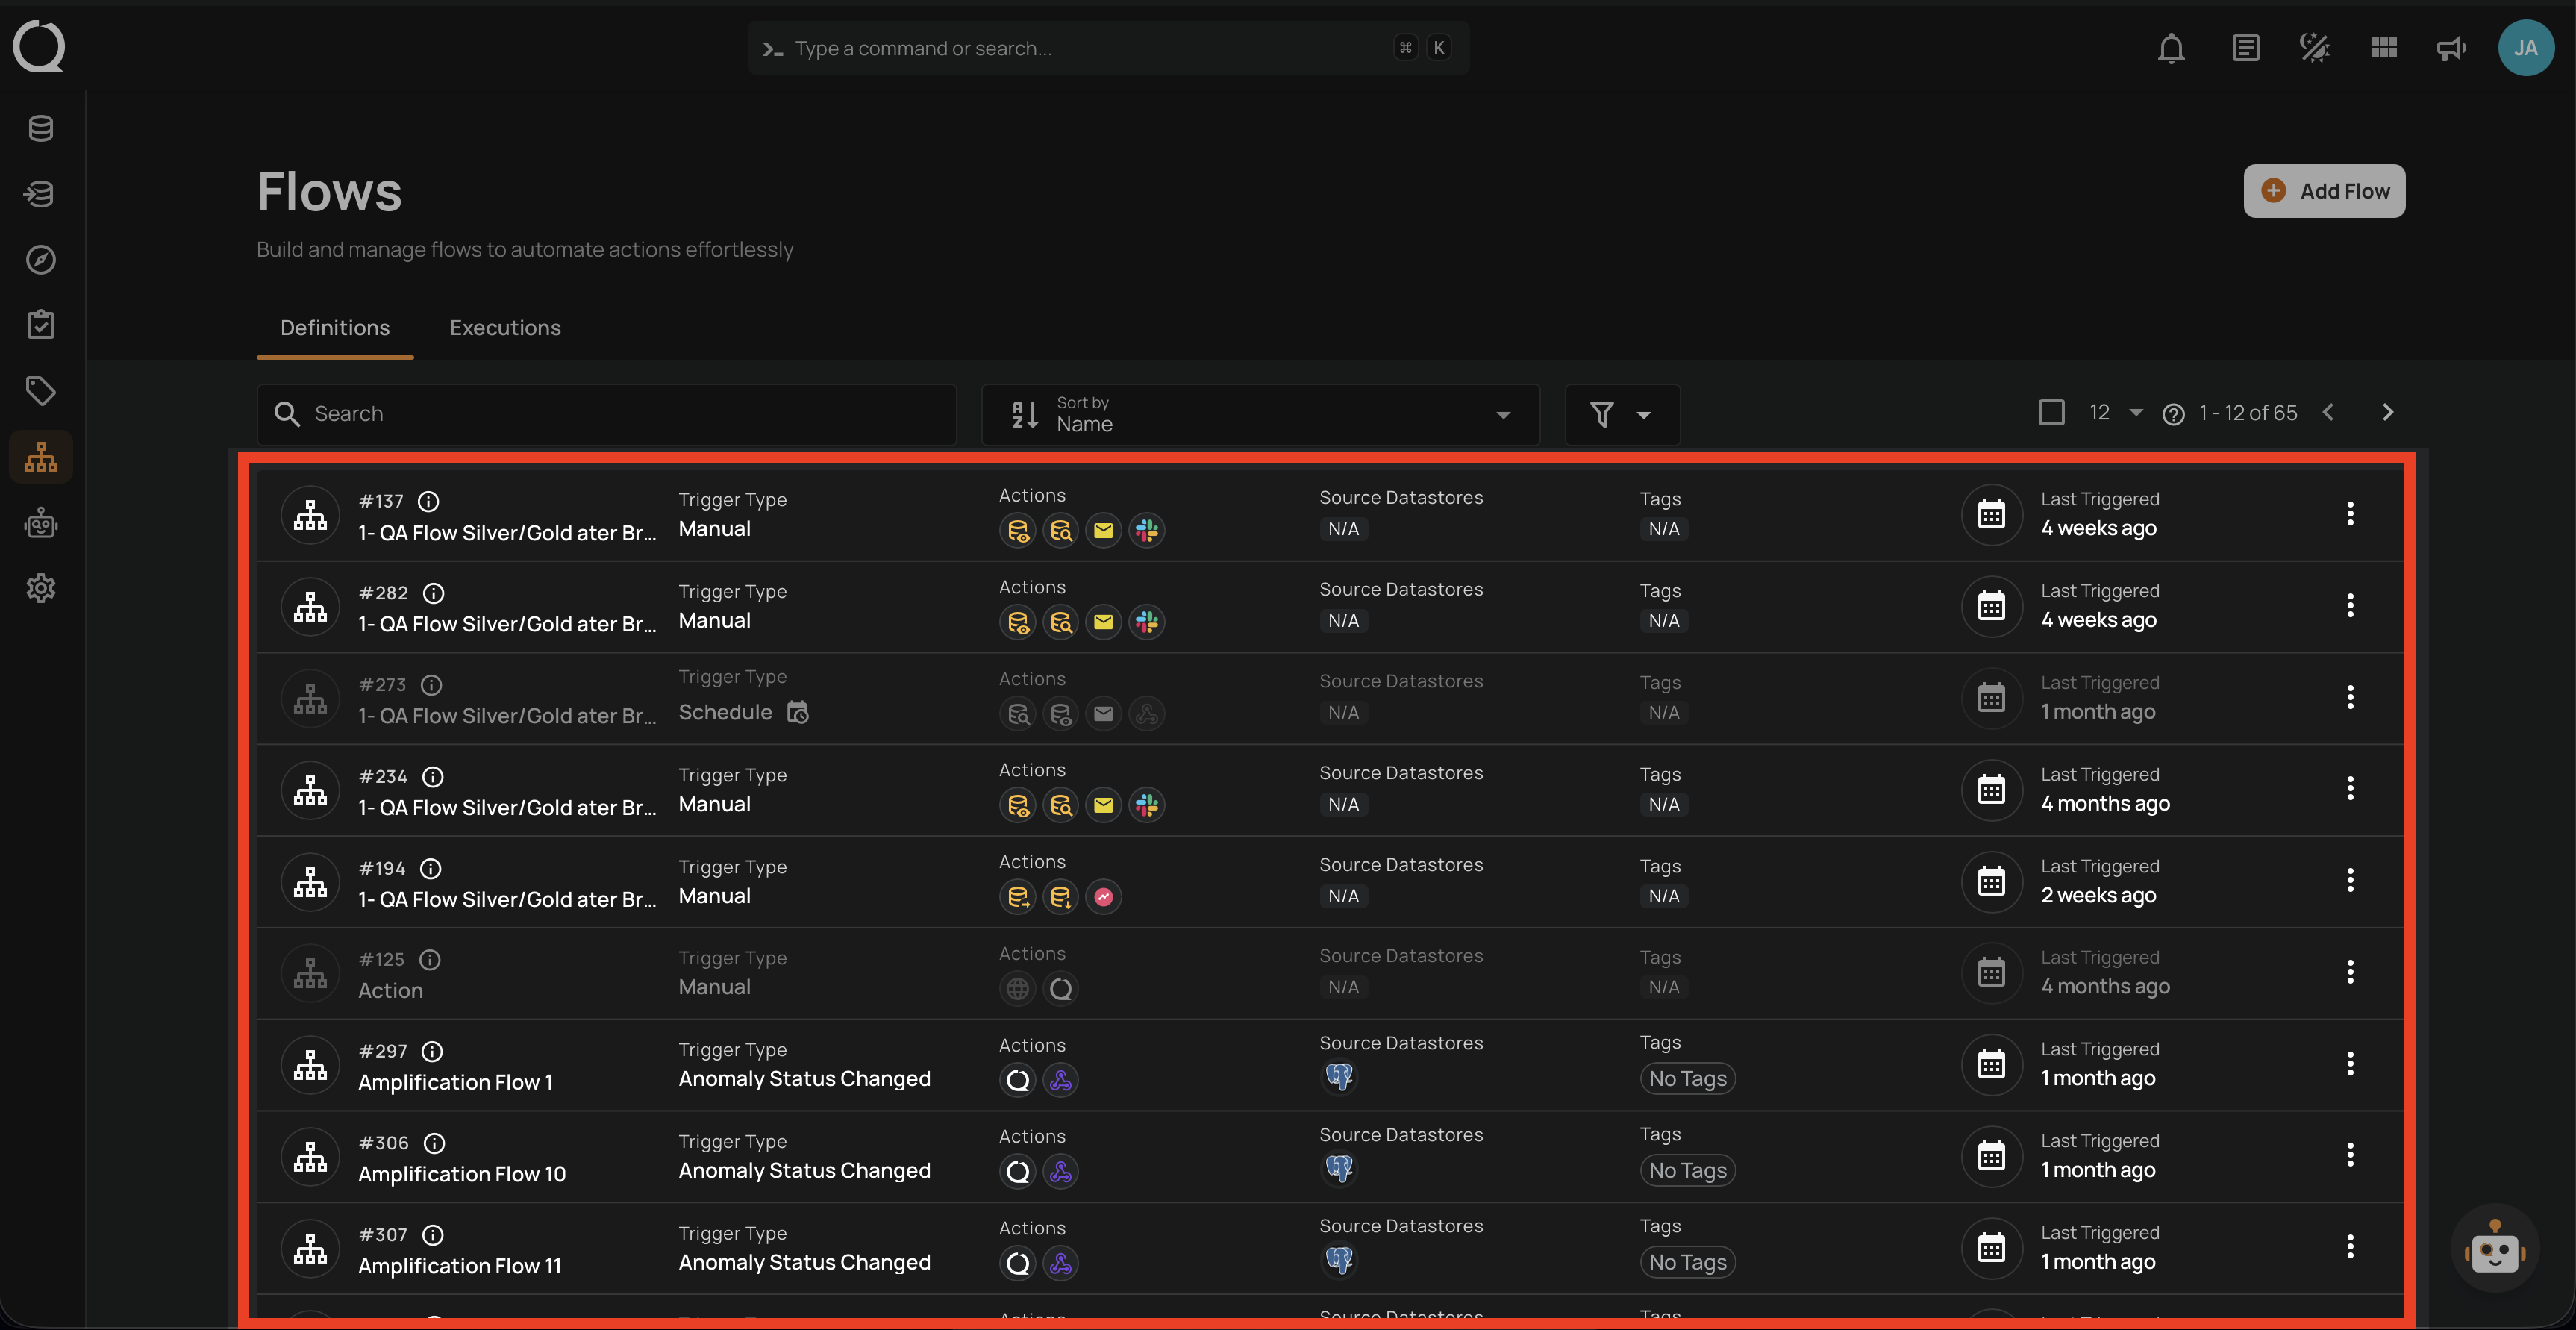
Flows
Automate and streamline:
- Trigger actions based on specific events.
- Manage workflows efficiently.
- Monitor and track execution status.
Platform Settings
Access key configuration areas:
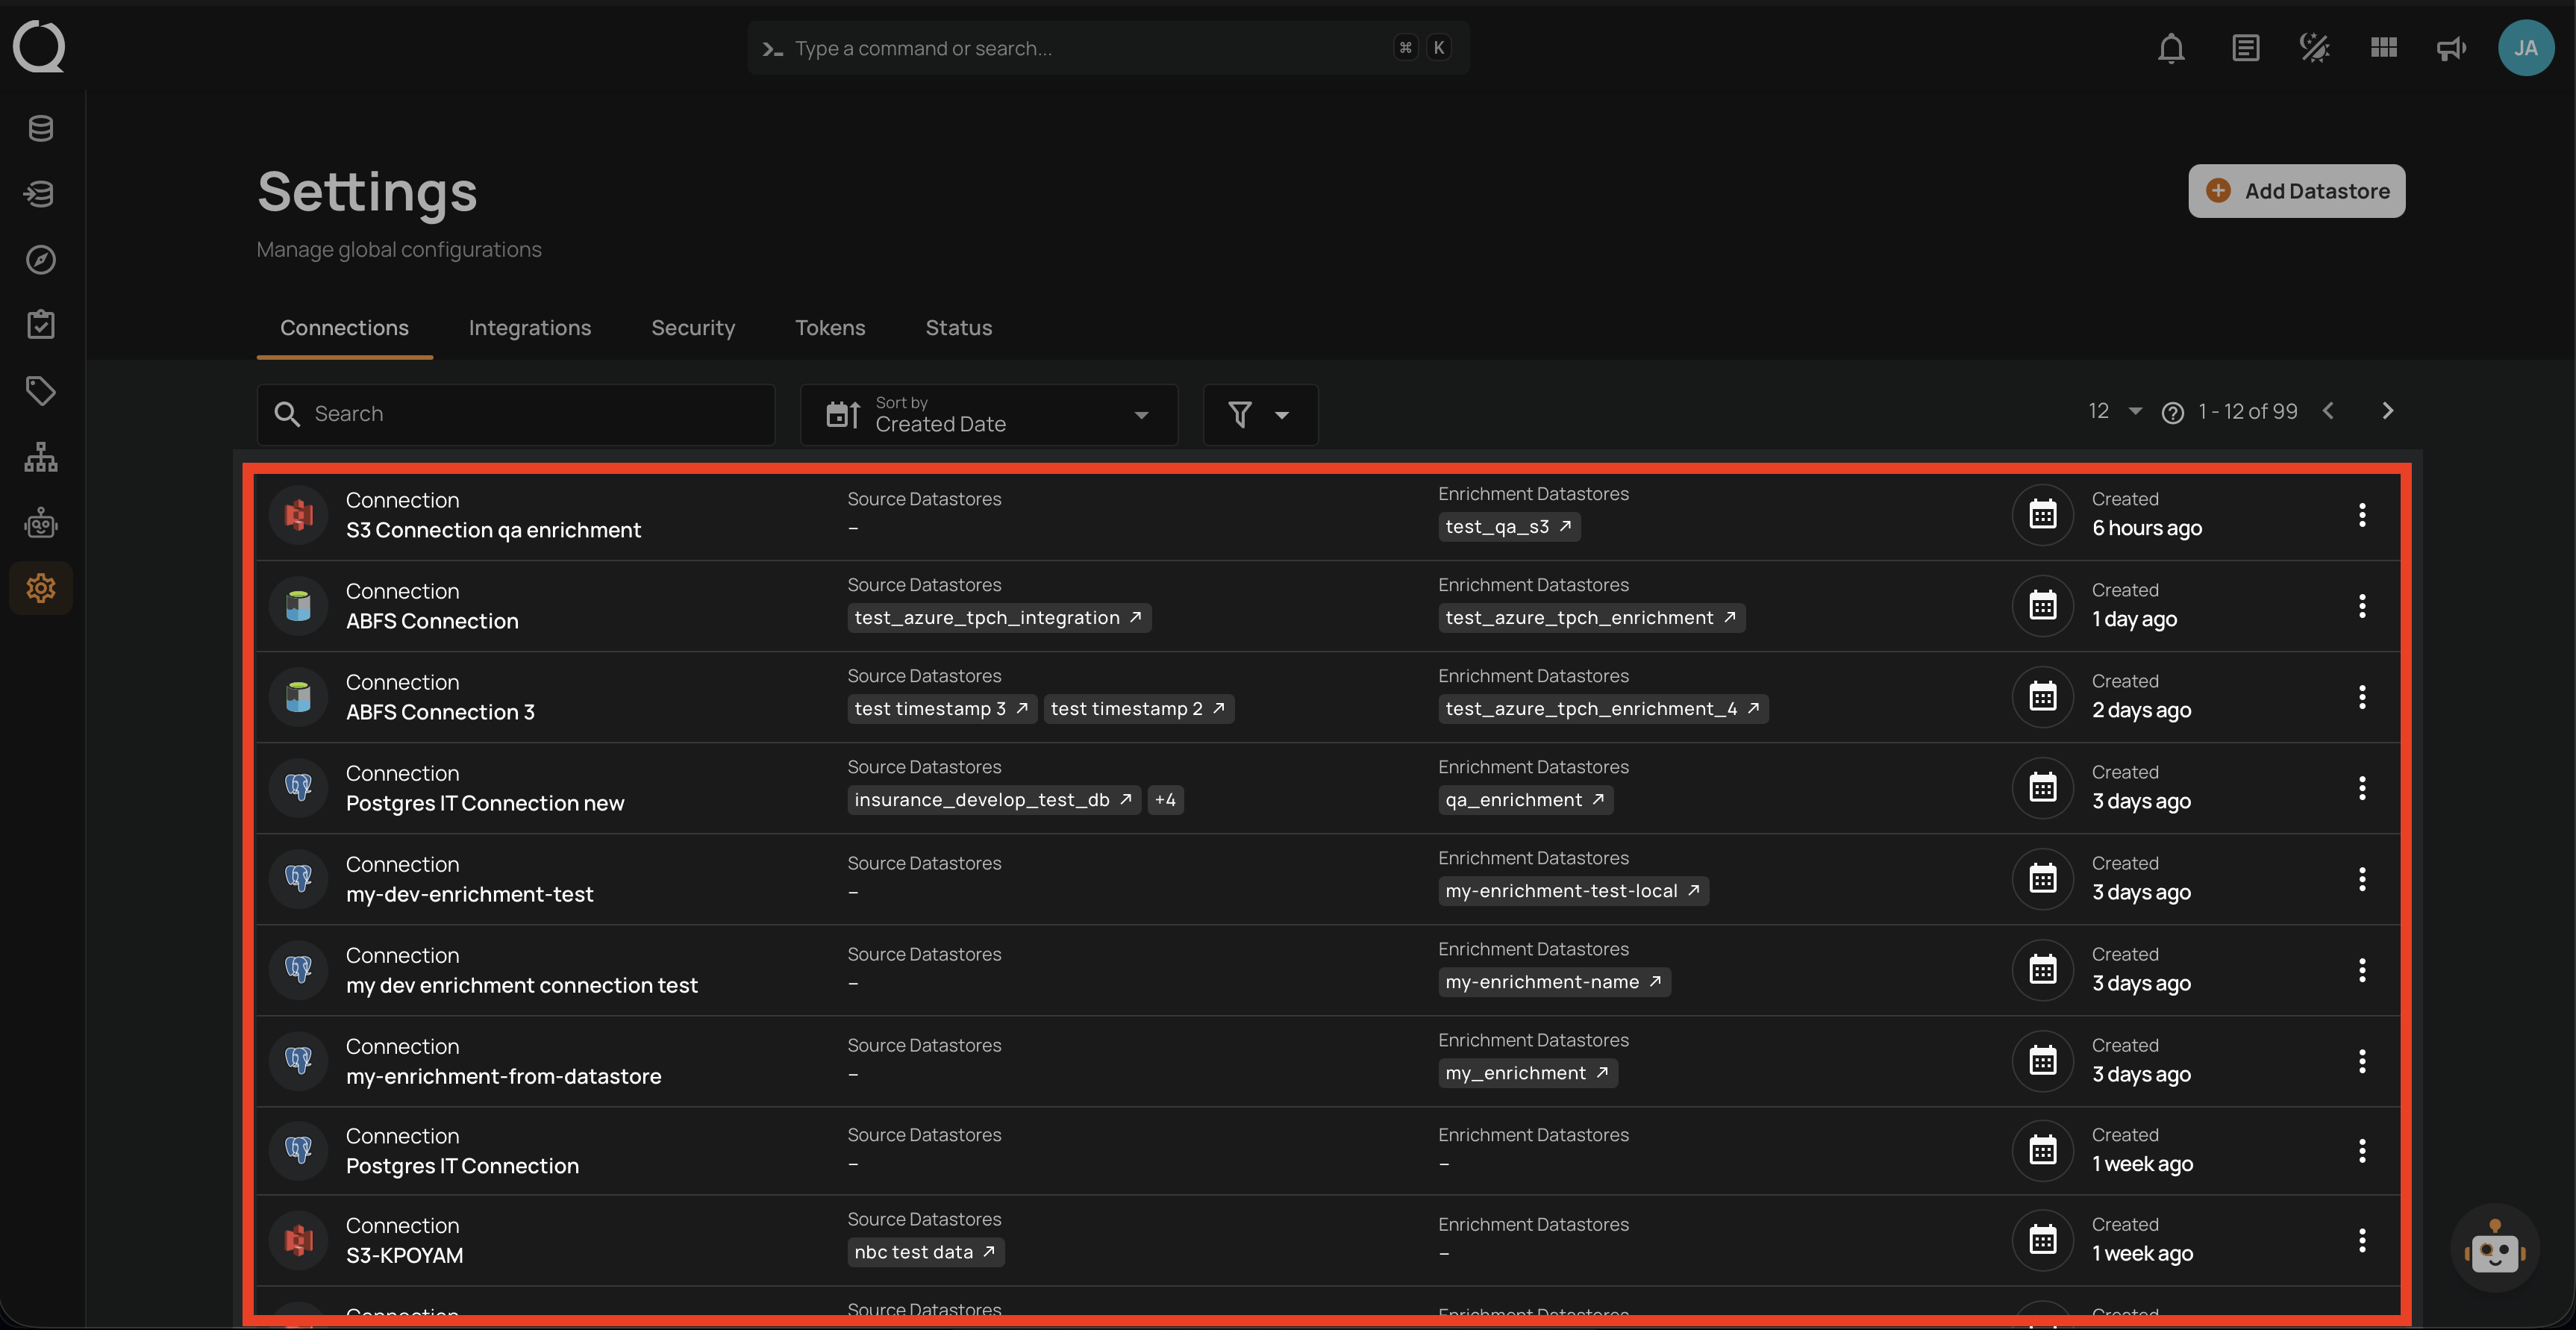
-
Connections
- Manage datastores.
- Configure integrations.
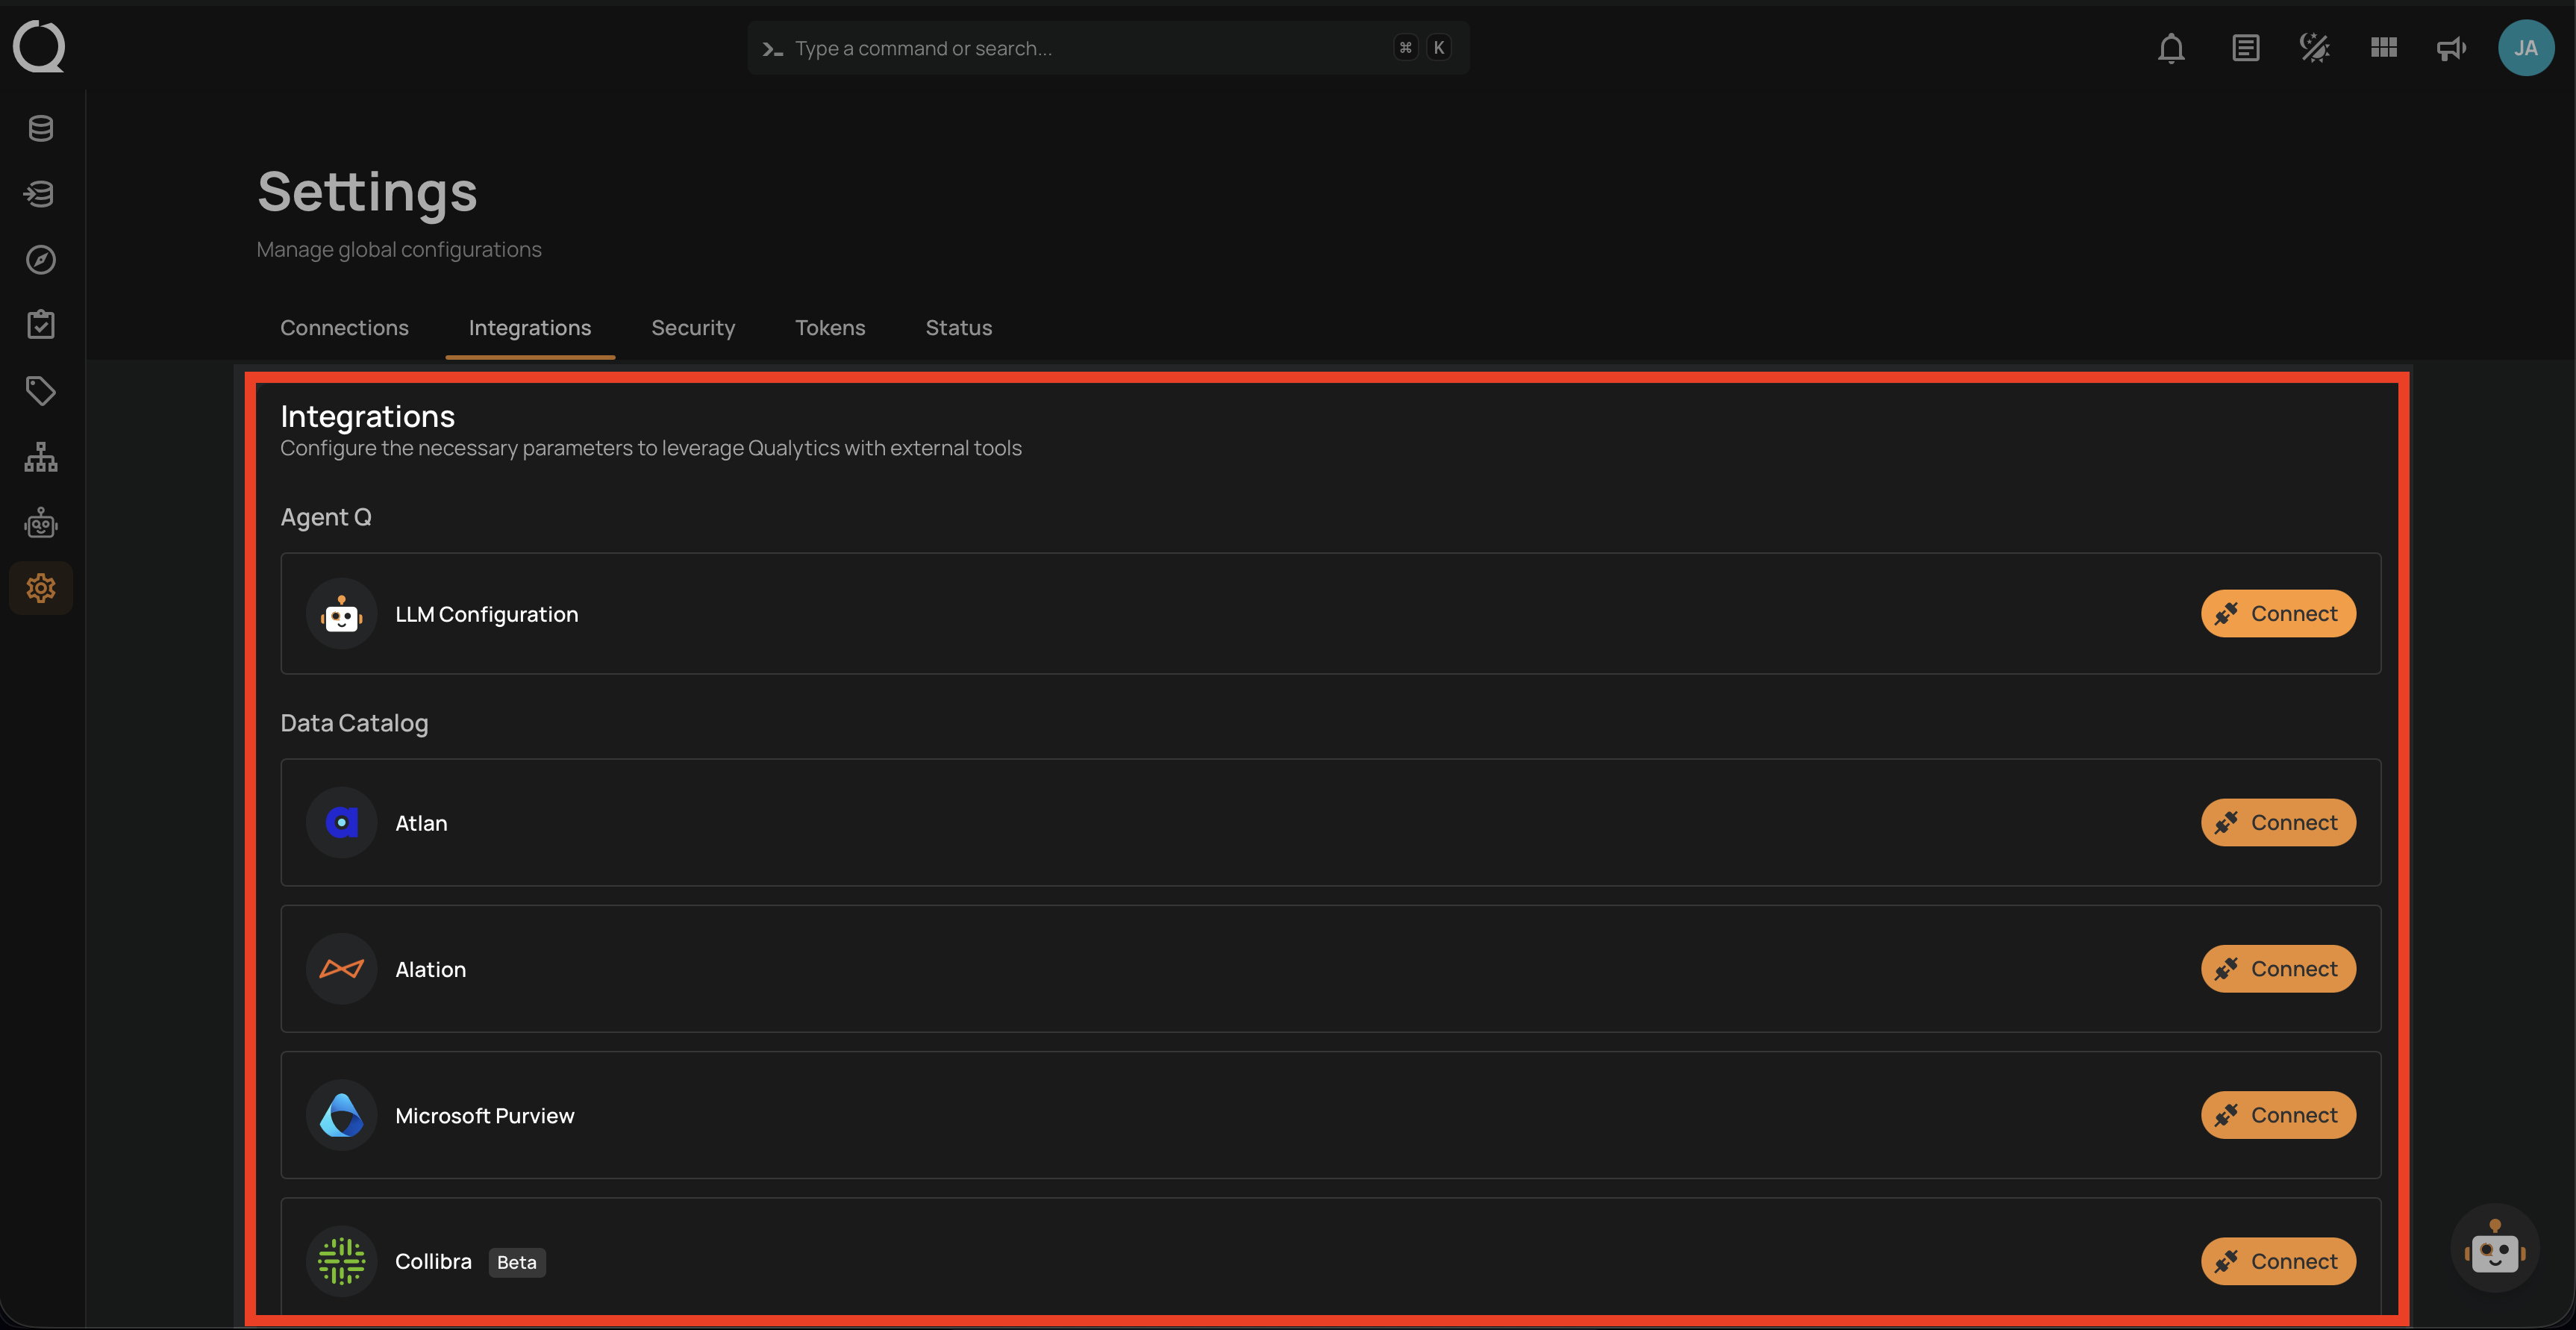
-
Integrations
- External tool setup.
- API configuration.
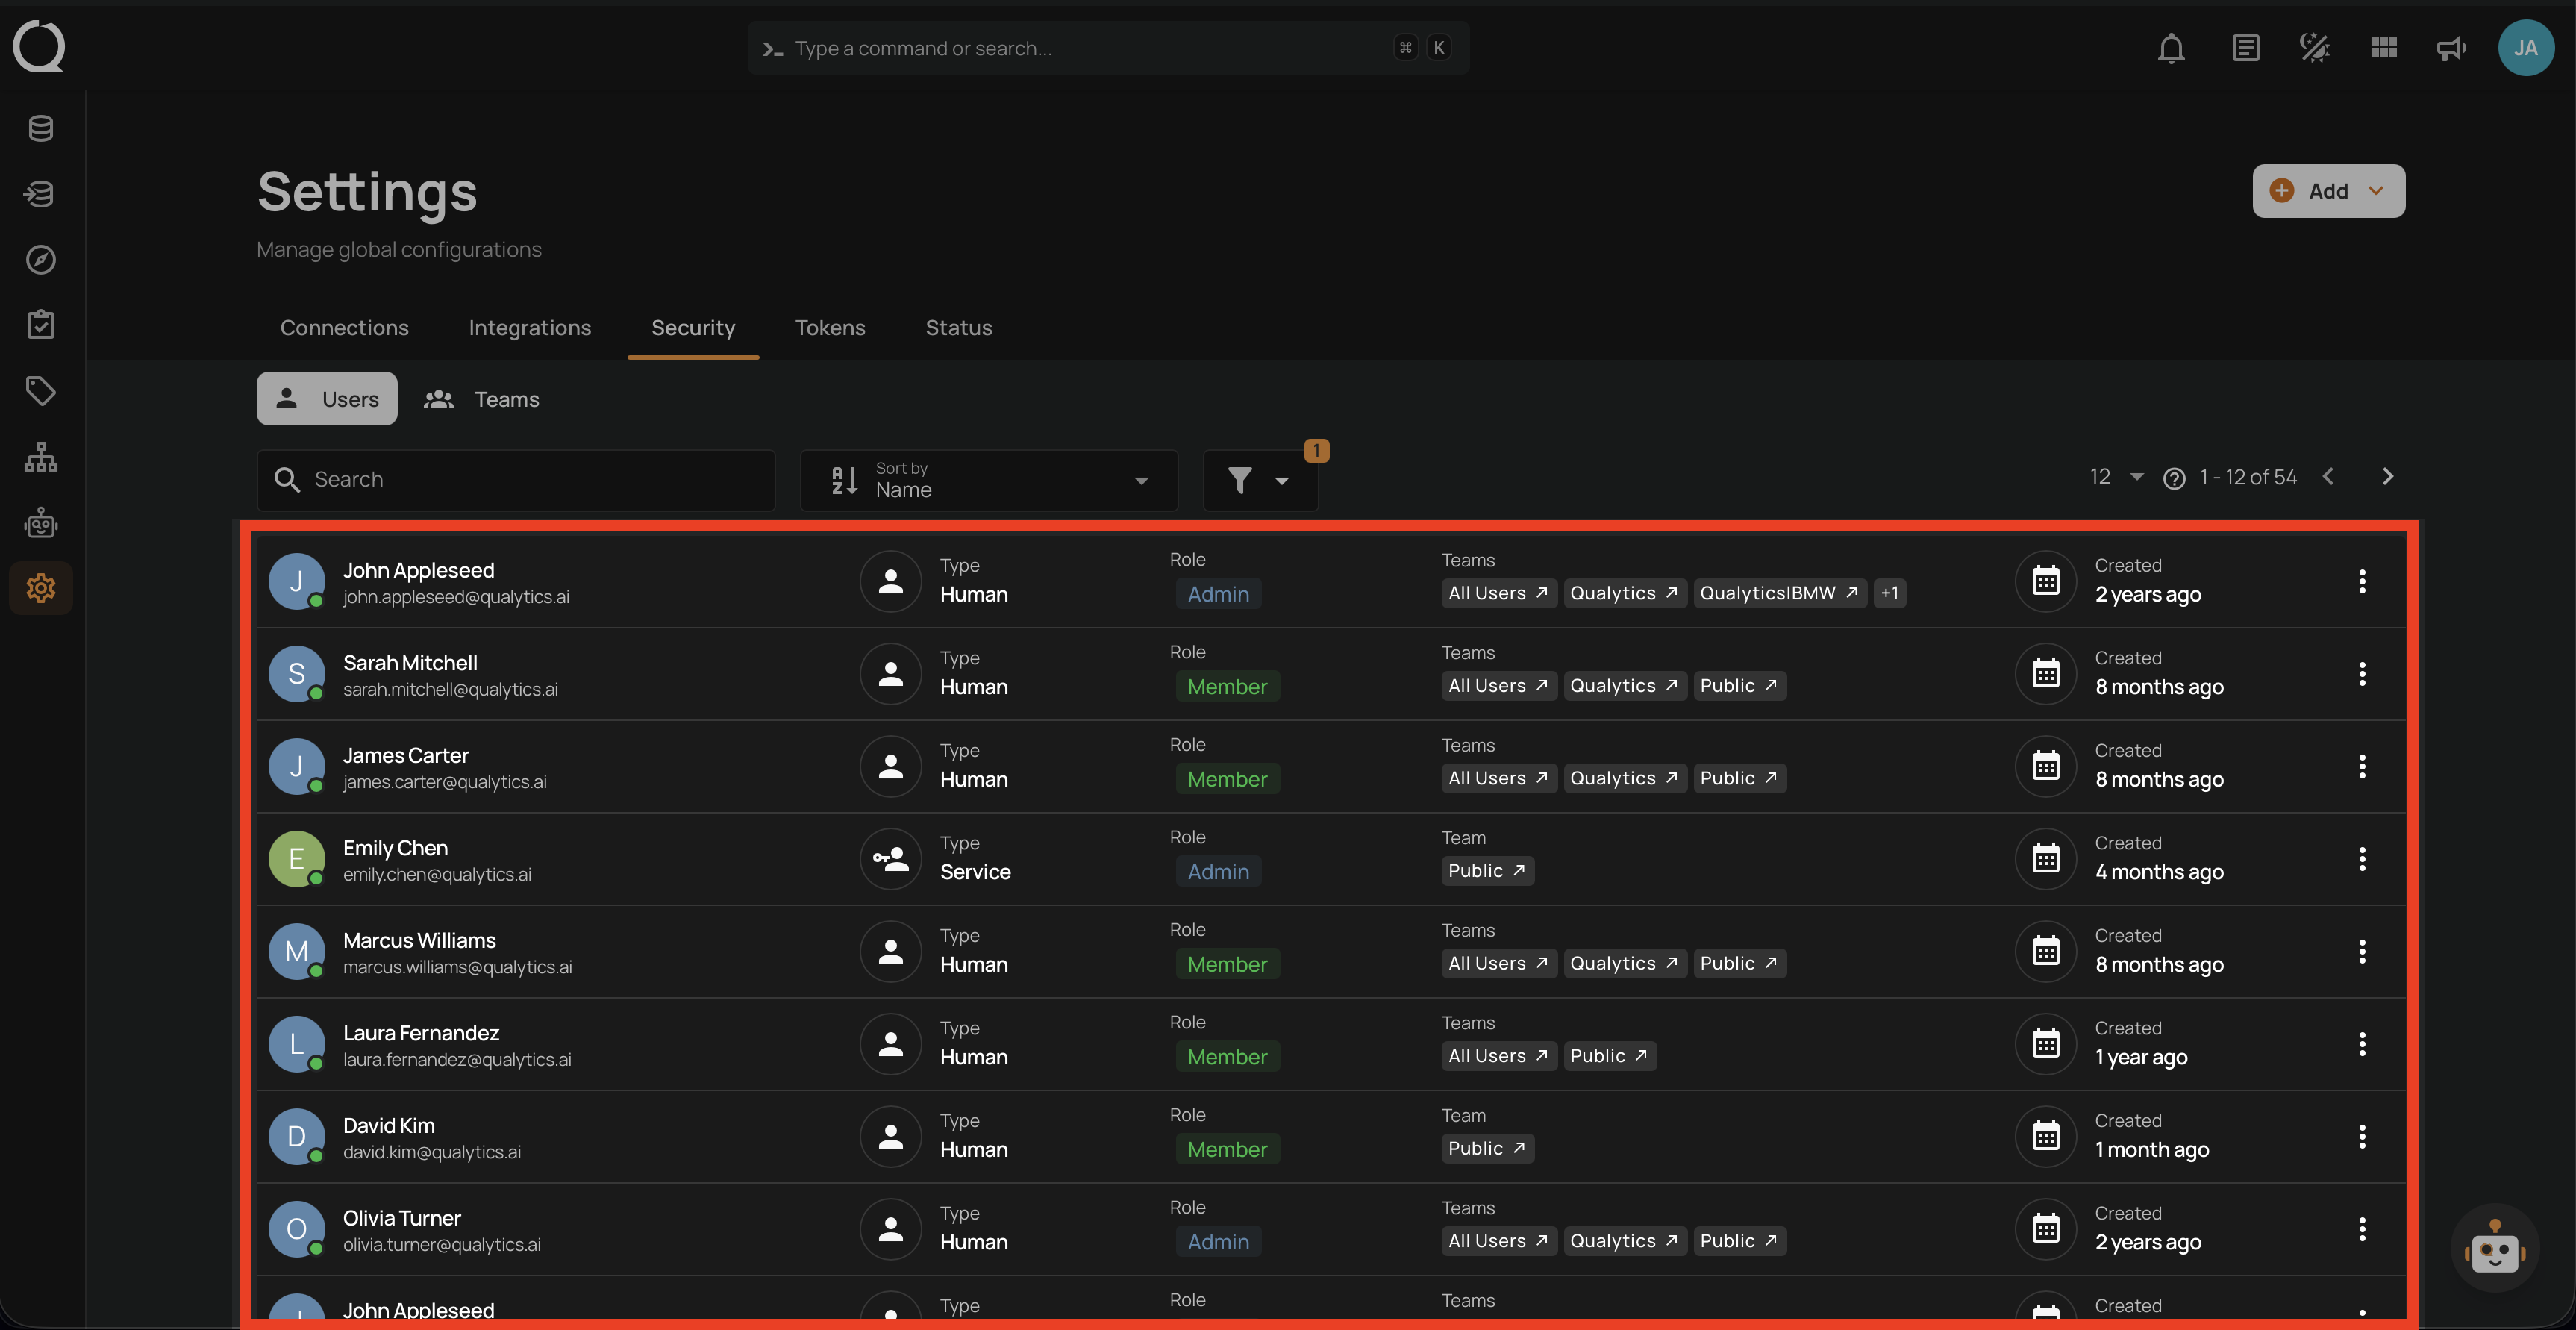
-
Security
- User management.
- Role assignments.
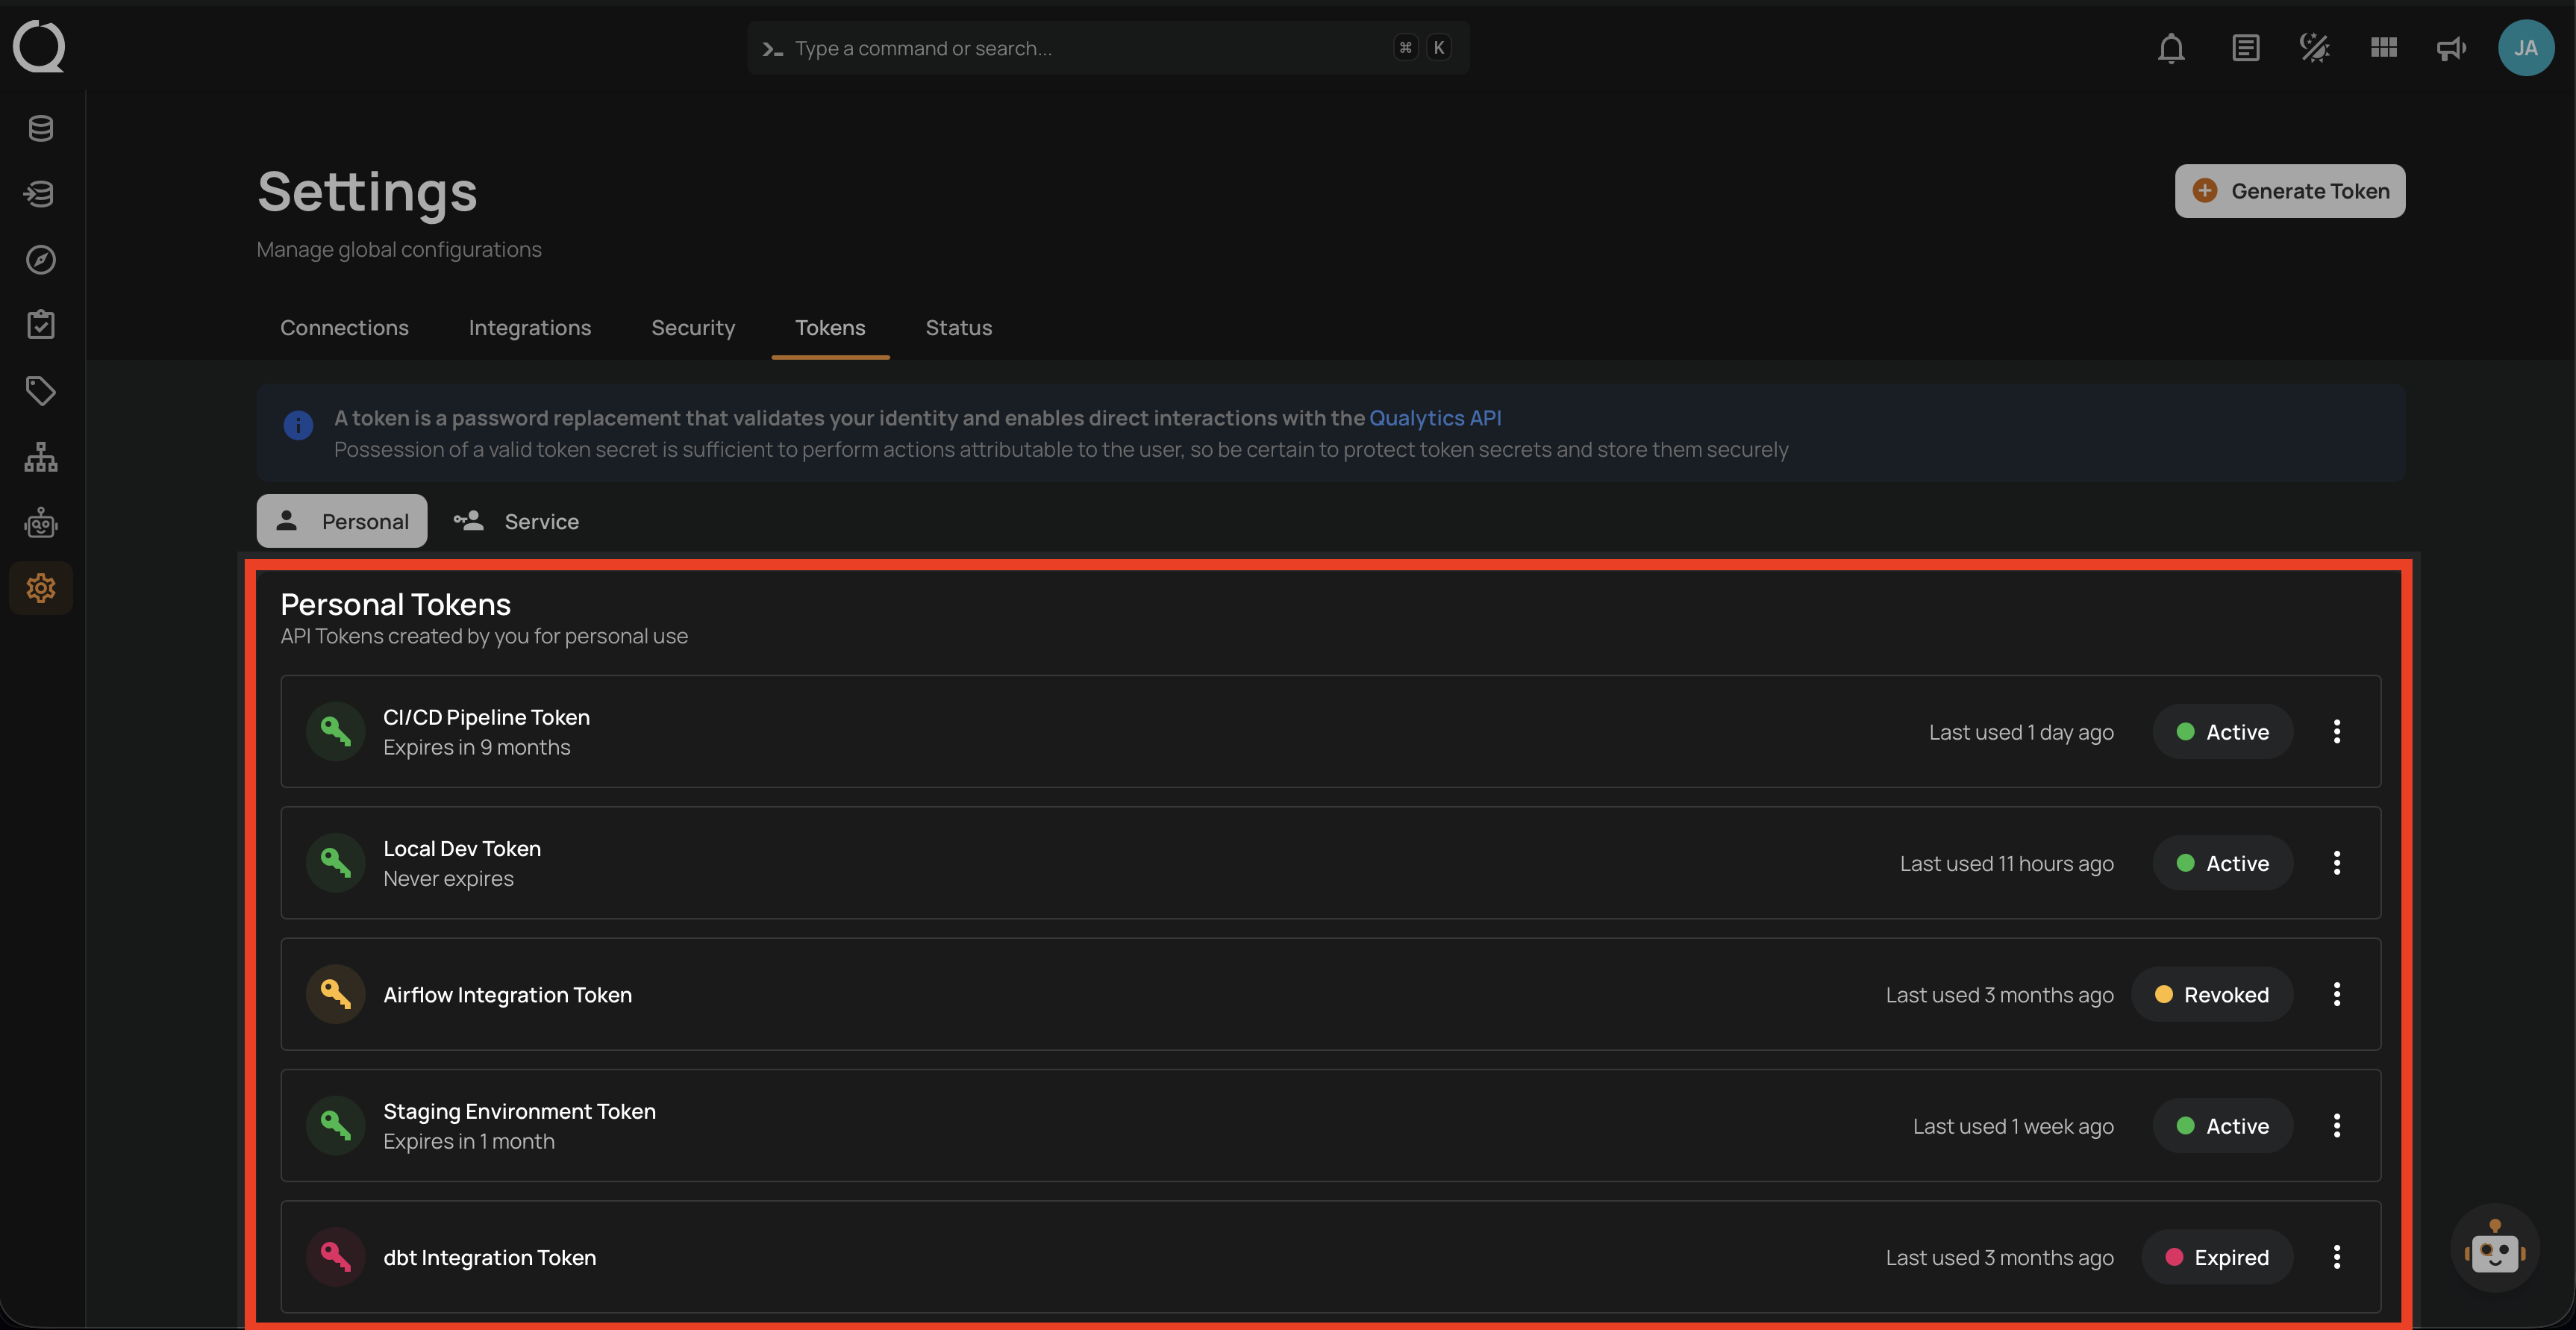
-
Tokens
- Generate and manage API tokens for programmatic access.
- Supports both Personal and Service token types.
- Tokens can be revoked, restored, or deleted at any time.
-
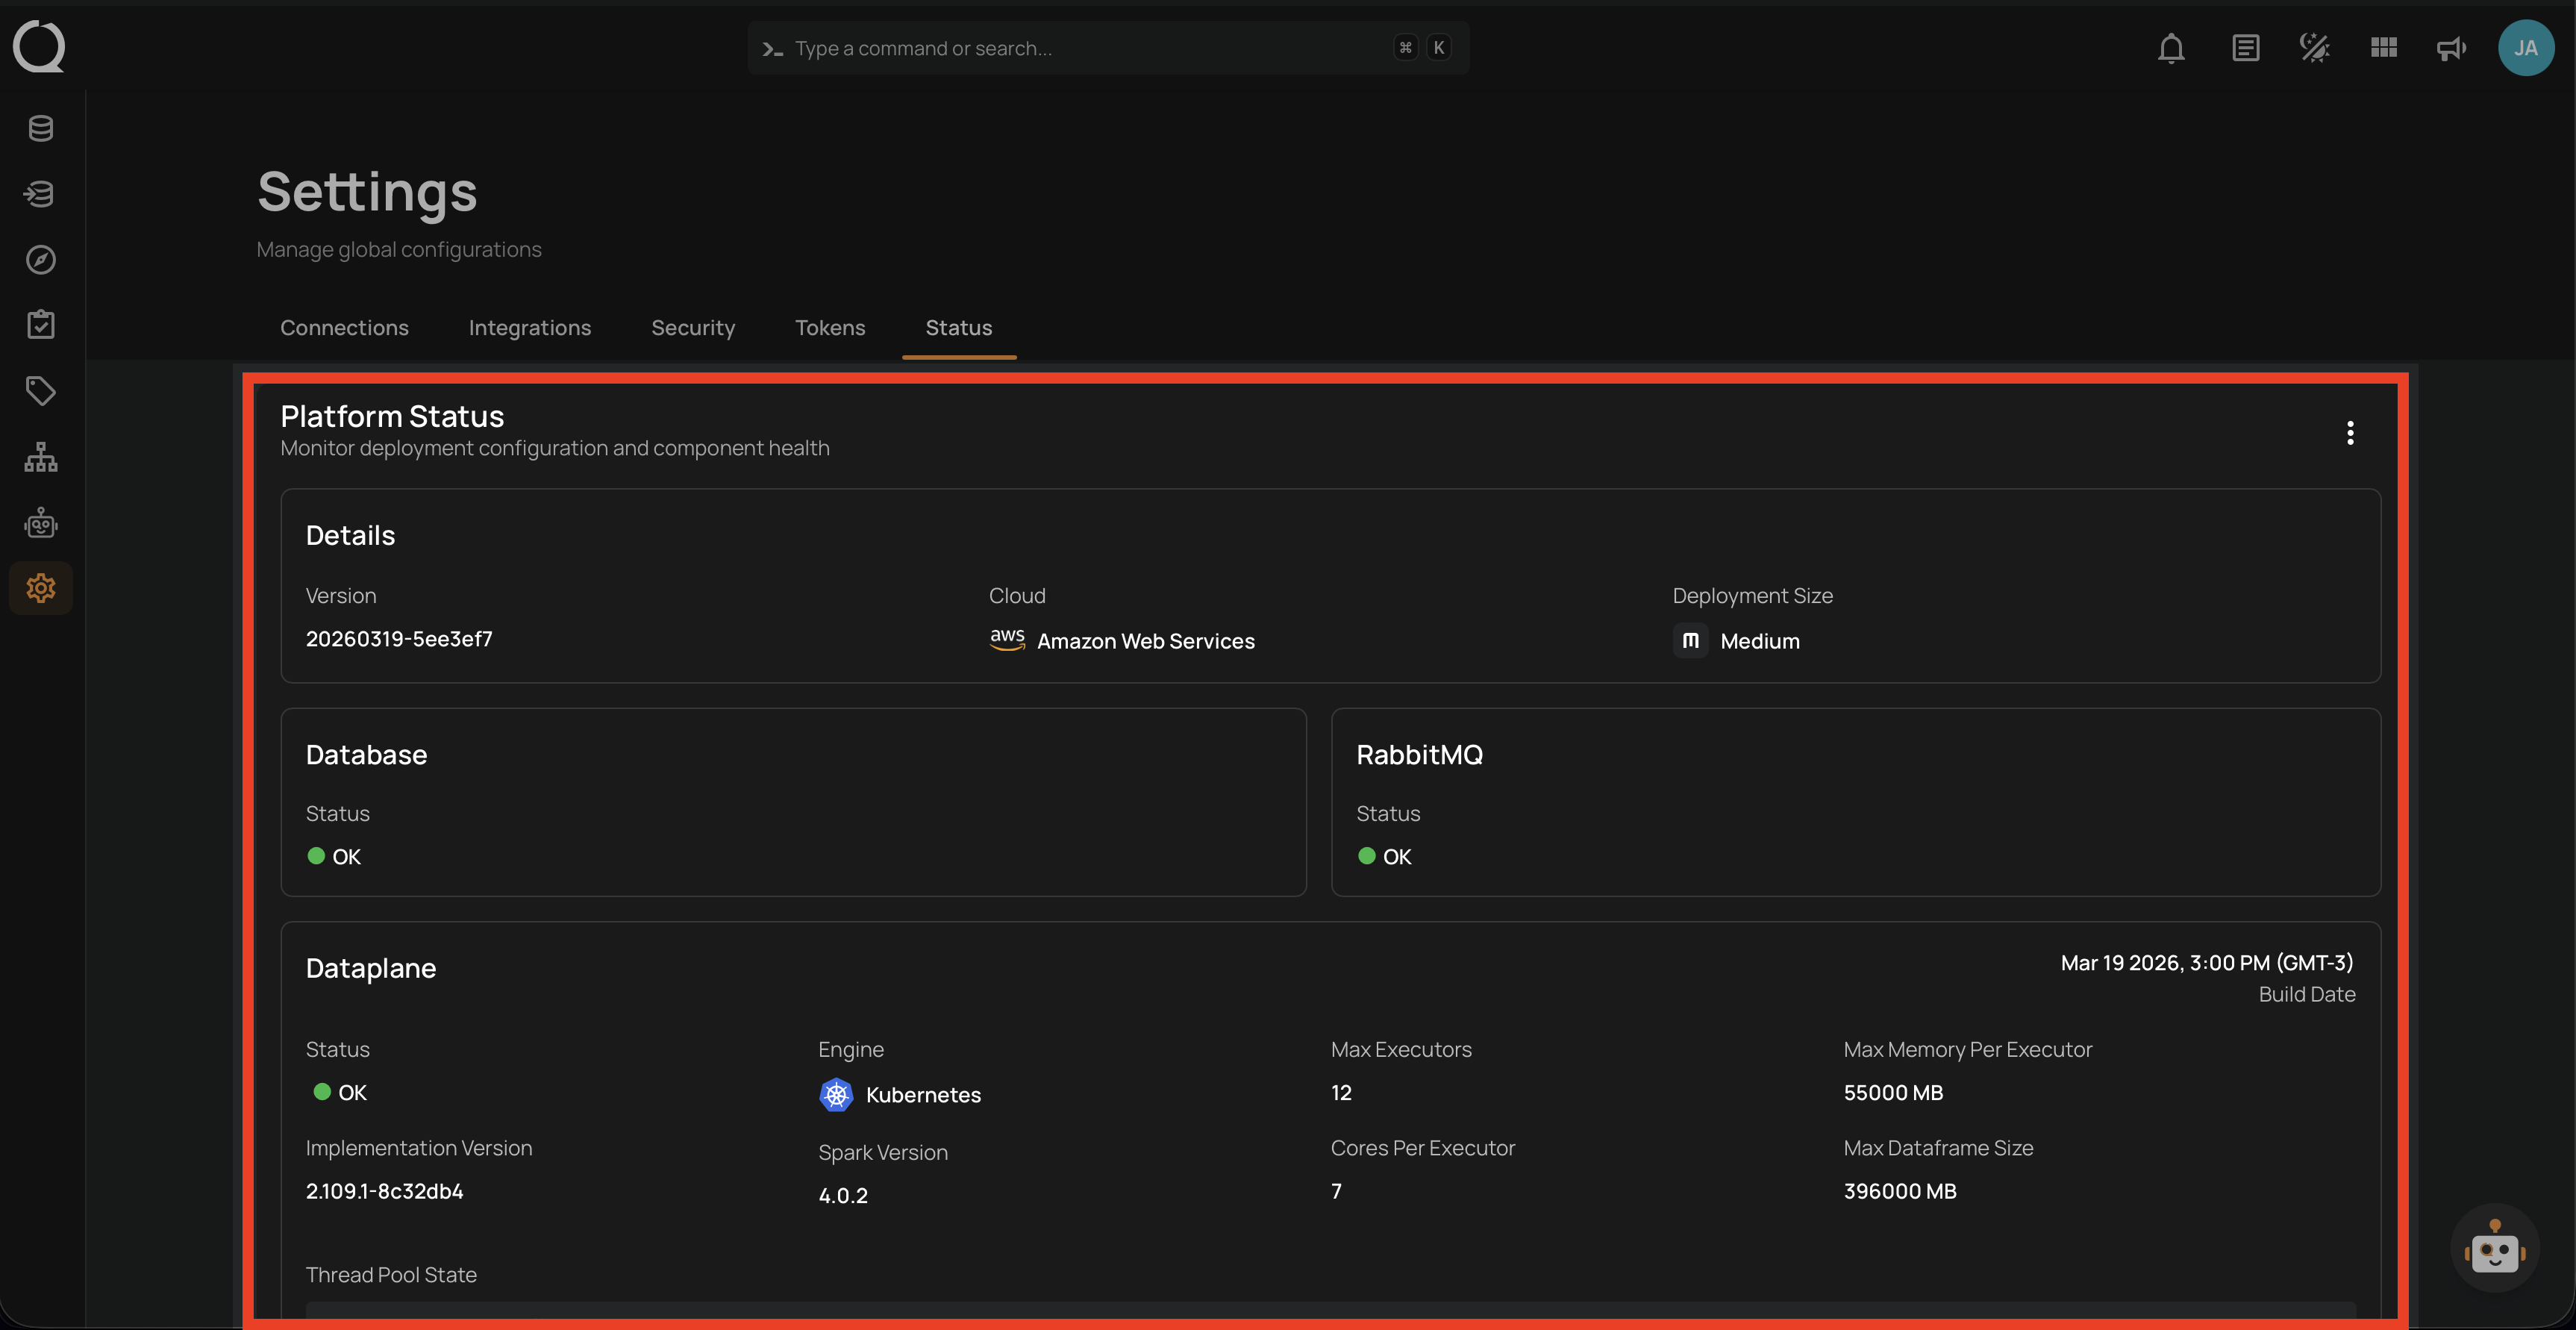
Status
- Deployment status.
- Analytics engine management.
Next Steps
Now that you're familiar with the Qualytics basics, consider:
- Setting up additional datastores.
- Creating custom quality checks.
- Configuring notifications.
- Exploring advanced features.
For detailed information on any topic, explore the relevant sections in our documentation.